NIFTY 50 INDEX
NIFTY 50 | Impulse Rally Nearing Completion - Selling Can Start Soon! ▼
NIFTY 50 appears to be nearing the final stage of Wave 5 of the larger degree Wave 1. Price has reached the crucial Fibonacci resistance zone at 24679, and the broader 24700-24800 range is shaping up as a strong shorting zone. This area is technically significant and could trigger profit booking or fresh selling pressure as we approach the upper boundary of the wave count.
If the index closes near the day's high today, there's a strong possibility that Monday opens with a gap-up, but this is likely to face heavy selling within the first 1-2 hours. The momentum is stretched, and the current rally looks exhausted on the lower time frames.
As we step into the next phase, a corrective Wave 2 is expected to unfold, with downside potential towards 24000 and even 23600 as part of this pullback. This leg could provide better positioning for medium-term traders. The broader structure now signals that the impulse rally is overextended, and selling can begin soon from these stretched levels.
NIFTY

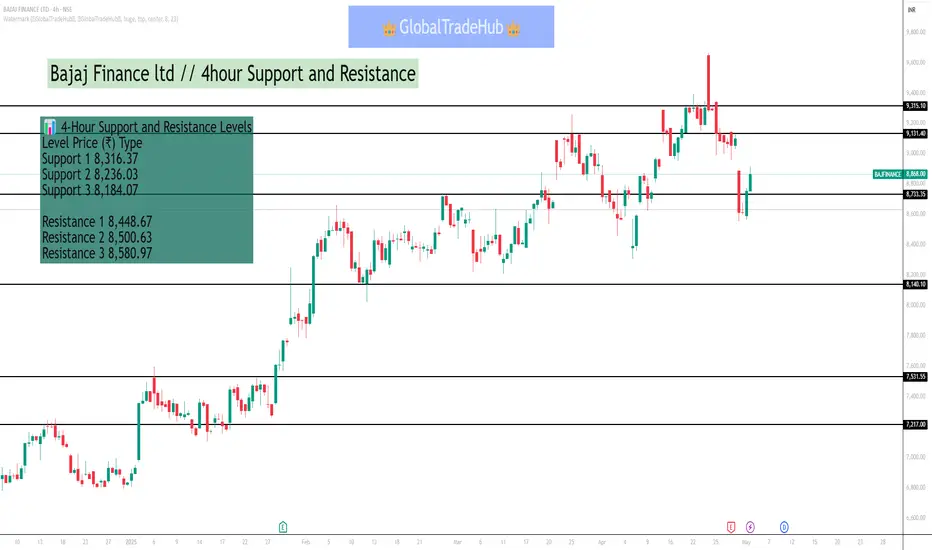
Bajaj Finance ltd // 4hour Support and ResistanceAs of May 3, 2025, Bajaj Finance Ltd (NSE: BAJFINANCE) is exhibiting the following key support and resistance levels on a 4-hour timeframe:
📊 4-Hour Support and Resistance Levels
Level Price (₹) Type
Support 1 8,316.37
Support 2 8,236.03
Support 3 8,184.07
Resistance 1 8,448.67
Resistance 2 8,500.63
Resistance 3 8,580.97
These levels are derived from the classic pivot point method and are crucial for traders to monitor, as movements beyond these points may indicate potential changes in the stock's trend.
🔍 Technical Indicators
As of the latest available data:
Relative Strength Index (RSI): 64.48, indicating an uptrend.
Stochastic RSI: 0.6, suggesting upward momentum.
Commodity Channel Index (CCI): 199.12, reflecting a strong uptrend.
Money Flow Index (MFI): 75.33, indicating strong buying pressure.
These indicators suggest a bullish trend, with the stock trading above its 20-day and 50-day Simple Moving Averages (SMA), and the 100-day and 200-day SMAs indicating an uptrend.
📈 Strategy Considerations
Bullish Scenario: If the stock price maintains above the support levels, particularly Support 1 at ₹8,316.37, it may continue its upward movement towards Resistance 1 at ₹8,448.67.
Bearish Scenario: A drop below Support 1 could signal a potential reversal or consolidation phase.
Please note that these levels are based on historical data and should be used in conjunction with other technical analysis tools and market conditions.
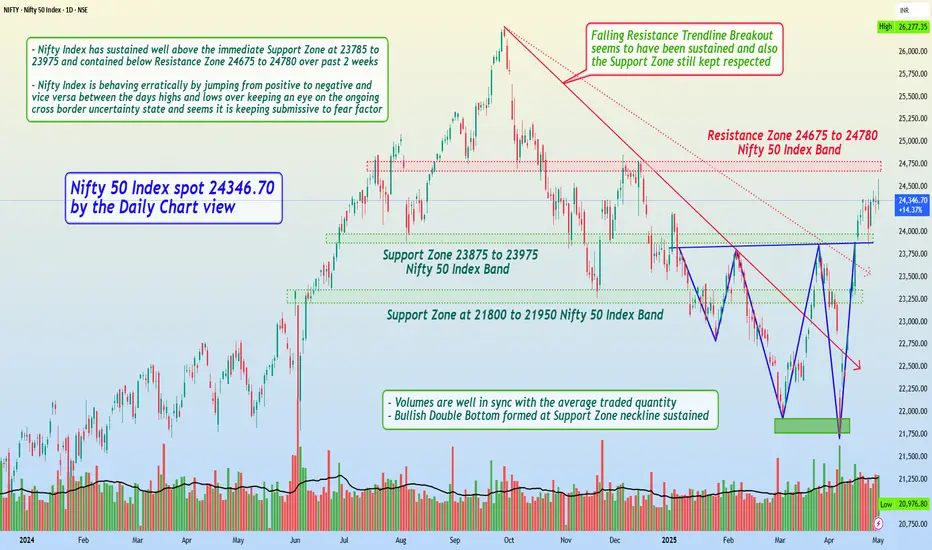
Nifty 50 Index spot 24346.70 by Daily Chart view - Weekly UpdateNifty 50 Index spot 24346.70 by the Daily Chart view
- Support Zone 23875 to 23975 Nifty 50 Index Band
- Resistance Zone 24675 to 24780 Nifty 50 Index Band
- Volumes are well in sync with the average traded quantity
- Nifty Index has sustained well above the immediate Support Zone at 23785 to 23975 and contained below Resistance Zone 24675 to 24780 over past 2 weeks
- Nifty Index is behaving erratically by jumping from positive to negative and vice versa between the days highs and lows over keeping an eye on the ongoing cross border uncertainty state and seems it is keeping submissive to fear factor
- Let us hope for the best to happen for a positive outcome over the coming days/weeks and foresee Nifty 50 Index to gradually and steadily progress towards the current ATH 26277.35 for a New ATH, in line with the Bank Nifty Index strides
How to Trade ?Set Up Your Trading Account. ...
Learn Market Basics. ...
Master Bids and Asks. ...
Use Fundamental and Technical Analysis. ...
Set Stop-Loss to Minimise Risk. ...
Start Small and Choose Stable Stocks. ...
Open a Demat account. ...
Get familiar with stock-related terms.

Divergence In the stock market, divergence refers to when the price of an asset moves in a direction opposite to what a technical indicator, like an oscillator, indicates. This discrepancy can signal a weakening trend and a potential reversal. There are two main types of divergence: bullish and bearish.

Support and Resistance part 2In technical analysis, support and resistance refer to price levels on a chart where the market's movement is expected to pause or reverse due to the forces of supply and demand. Support is a price level where the price has historically stopped falling, indicating that buyers are plentiful at that price point, and that the market is likely to bounce back upwards. Resistance, on the other hand, is a price level where the price has historically stopped rising, suggesting that sellers are abundant and the market is likely to fall back down.

Management and PsychologyTrading psychology refers to the emotional and mental state influencing a trader's decisions. It involves managing emotions like fear and greed, which can impact rational judgment and risk-taking, thus affecting trading outcomes. A disciplined mindset helps traders make logical decisions under pressure.

What is PCR ?PCR, or Polymerase Chain Reaction, is a molecular biology technique used to make many copies of a specific DNA segment. It's like a "molecular photocopying" process that amplifies a tiny DNA sequence into millions or even billions of copies. This technique is widely used in research, diagnostics, and forensics.

What are Financial Markets ?Financial markets are platforms where individuals and institutions buy and sell financial instruments like stocks, bonds, currencies, and derivatives. These markets facilitate the flow of capital, promote economic stability, and allow participants to manage risk.

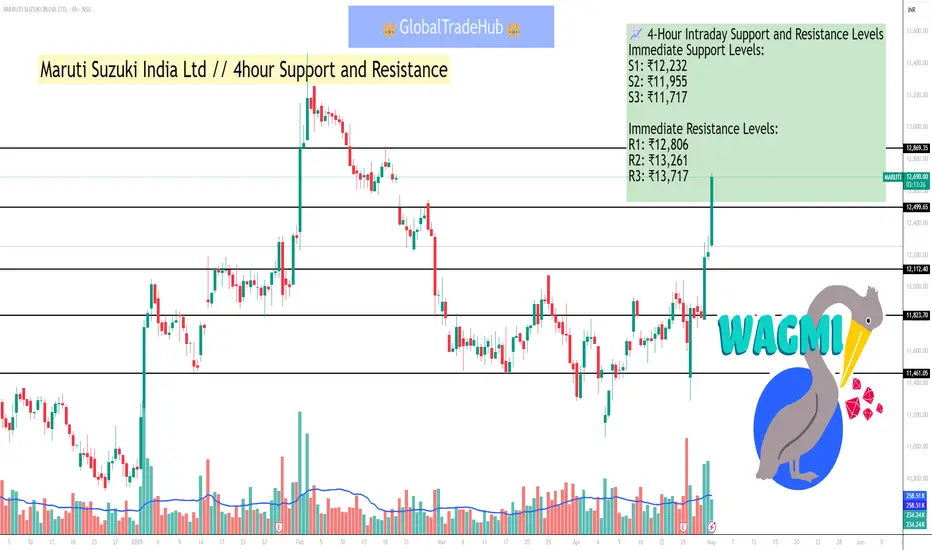
Maruti Suzuki India Ltd // 4hour Support and ResistanceAs of May 2, 2025, the 4-hour intraday chart for Maruti Suzuki India Ltd (NSE: MARUTI) indicates a bullish trend, with the stock trading at ₹12,257. The following support and resistance levels are derived from recent price action and technical analysis:
📈 4-Hour Intraday Support and Resistance Levels
Immediate Support Levels:
S1: ₹12,232
S2: ₹11,955
S3: ₹11,717
Immediate Resistance Levels:
R1: ₹12,806
R2: ₹13,261
R3: ₹13,717
These levels are based on recent price action and volume analysis, indicating potential breakout points and areas where the stock may find support.
🔍 Technical Indicators
RSI (14): 64.81, indicating bullish momentum.
MACD: 215.3, with a signal line of 116.03, suggesting upward momentum.
MFI (14): 76.87, indicating buying pressure.
EMA (50): ₹12,553.90, with the stock trading above this level, indicating a bullish short-term trend.
EMA (200): ₹12,348.91, with the stock trading above this level, indicating a bullish long-term trend.
These indicators suggest a continuation of the bullish trend, with potential for further upside movement.
📊 Chart Patterns
A recent Cup and Handle pattern has been observed, with the price breaking out from the handle formation. The measured move suggests a potential target of ₹13,280, contingent upon sustained volume and price momentum.
⚠️ Important Notes
Risk Management: Always use appropriate stop-loss orders to manage risk.
Market Conditions: Intraday levels are subject to change based on market conditions and news events.
Indian Oil Corporation LtdAs of May 2, 2025, the key intraday support and resistance levels for Indian Oil Corporation Ltd (NSE: IOC) are as follows:
Immediate Support Levels:
₹131.75
₹130.22
Immediate Resistance Levels:
₹138.63
₹146.46
These levels are derived from technical analysis and are subject to change based on market conditions.

State Bank of India // 2hour Support and ResistaneAs of May 2, 2025, the State Bank of India (SBIN) is trading at ₹728.05, up 0.84% from the previous close of ₹722.00.
📈 2-Hour Intraday Support and Resistance Levels
Based on recent technical analysis and intraday chart patterns, here are the key support and resistance levels for SBIN on a 2-hour timeframe:
Immediate Support Levels:
S1: ₹723.00
S2: ₹718.00
S3: ₹710.00
Immediate Resistance Levels:
R1: ₹735.00
R2: ₹745.00
R3: ₹755.00
These levels are derived from recent price action and volume analysis, indicating potential breakout points and areas where the stock may find support.
🔍 Technical Indicators
50-Day EMA: ₹858.16 (Stock is trading above this level, indicating a bullish short-term trend)
100-Day EMA: ₹839.78 (Stock is trading above this level, indicating a bullish mid-term trend)
200-Day EMA: ₹812.92 (Stock is trading above this level, indicating a bullish long-term trend)
MACD: Bearish crossover observed, suggesting potential short-term weakness
RSI (14): Below 30, indicating oversold conditions
MFI (14): 24.19, suggesting sideways movement
CCI (20): Below -100, indicating oversold conditions
William %R (14): -78.98, indicating oversold conditions
ADX (14): Above 20 with +DI below -DI, indicating a downtrend
PSAR: 238.73, acting as a stop-loss for long positions
These indicators suggest a potential short-term pullback, but the overall trend remains bullish.
📊 Chart Patterns
A recent Cup and Handle pattern has been observed, with the price breaking out from the handle formation. The measured move suggests a potential target of ₹1,342.35, contingent upon sustained volume and price momentum.
⚠️ Important Notes
Risk Management: Always use appropriate stop-loss orders to manage risk.
Market Conditions: Intraday levels are subject to change based on market conditions and news events.
Consult Professionals: Consider consulting with a financial advisor before making investment decisions.

NIFTYBANK INDEX#NIFTYBANK
Pre-Market Analysis for 02 May Nifty Bank
- *Gap-Up Opening*: GiftNifty indicates a gap-up opening.
- *Chart Analysis*:
- Clear selling indicates presence of sellers.
- Breakdown of 55000 level removed buyers and added fresh sellers.
- *Trading Strategy*:
- Consider staying on buying side, targeting sellers' stop-losses.
- Avoid selling in gap-down opening with negative movement, as there may not be sufficient downside buyers' stop-losses.
- *Important Reminders*:
Review the marked points on the chart for better understanding.
- Trade with proper confirmation and avoid trading in FOMO (Fear of Missing Out).
- Focus on making one well-planned trade per day.
- *Note*: This analysis is based on my perspective, and market situations can change quickly. Stay disciplined and prioritize risk management.

PRESTIGE ESTATES LTDPRESTIGE Estate Ltd view for Intraday 2nd May #PRESTIGE
Resistance 1385 Watching above 1387 for upside movement...
Support area 1360 Below 1360 ignoring upside momentum for intraday
Watching below 1358 for downside movement...
Above 1385 ignoring downside move for intraday
Charts for Educational purposes only.
Please follow strict stop loss and risk reward if you follow the level.

NIFTY 50 INDEX #NIFTY50 Analysis (02 May 2025):
• Pattern: Double Top near 24,520
• Resistance Zones:
* Major: 24,510 - 24,530
* Minor: 24,360-24,400
• Support Zones:
* Immediate: 24,150
* Strong: 24,000 - 23,840
(Bearish Reversal Indication)
RSI Divergence (not shown, assumed) hints at weakening momentum near top.
Fundamental Note: FIl flows, earnings season volatility, and U.S. Fed
commentary are driving current swings.

ICICI BANK LTD 15 MIN CHARTAs of May 2, 2025, the 15-minute intraday chart for ICICI Bank Ltd (NSE: ICICIBANK) indicates a bullish trend, with the stock trading at ₹1,250.05, up 0.49% for the day.
📈 Key Technical Levels
Resistance Levels:
R1: ₹1,245.82
R2: ₹1,259.55
R3: ₹1,275.00
Support Levels:
S1: ₹1,230.00
S2: ₹1,215.00
S3: ₹1,200.00
These levels are derived from recent price action and volume analysis, indicating potential breakout points and areas where the stock may find support.
📊 Chart Patterns
A recent Cup and Handle pattern has been observed, with the price breaking out from the handle formation. The measured move suggests a potential target of ₹1,342.35, contingent upon sustained volume and price momentum.
🔍 Market Sentiment
ICICI Bank's stock has shown resilience, with a 1.80% increase over the past week and a 16.05% rise over the past year. Analysts maintain a positive outlook, with price targets ranging from ₹1,290 to ₹1,675.

INDUS TOWERS LTDAs of May 2, 2025, the key intraday support and resistance levels for Indus Towers Ltd (NSE: INDUSTOWER) are as follows:
Immediate Support Levels:
₹341.47
₹336.37
₹331.27
₹323.02
Immediate Resistance Levels:
₹374.48
₹366.23
₹361.13
₹356.03
These levels are derived from technical analysis and are subject to change based on market conditions.

Divergence ConceptIn the stock market, divergence refers to a situation where the price of an asset (like a stock) is moving in the opposite direction of a technical indicator, such as an oscillator or momentum indicator. This discrepancy can signal a weakening trend or a potential reversal.

Technical ConceptA "technical concept" refers to a specific idea or principle within a technical field, like engineering, computer science, or a specific industry. It's a fundamental building block that helps explain how something works, what it does, and why it's used. These concepts are often complex and require a certain level of technical understanding.

Advanced Database Trading "Advanced Database Trading" typically refers to using advanced features and techniques within database management systems (DBMS) to handle complex data operations, enhance data management, and improve trading-related applications. This includes leveraging distributed databases, NoSQL systems, and techniques for real-time data processing and analysis.

Database Trading part 3Trading data is a sub-category of financial market data. It provides real-time information about stock and market prices as well as historical trends for assets such as equities, fixed-income products, currencies and derivatives. Trading data also includes information about trades historically and over the course of a trading day, such as the latest bid, asking price and time of the last trade.

MACD Part 2MACD, short for Moving Average Convergence Divergence, is a popular technical indicator used in trading to identify potential buy and sell signals, as well as trend reversals. It's essentially a momentum indicator that compares two moving averages (usually 12-period and 26-period exponential moving averages) to gauge the strength and direction of a trend.

RSI ExplanationThe Relative Strength Index (RSI) is a momentum indicator used in technical analysis to assess the speed and magnitude of price changes. It helps traders identify potential overbought and oversold conditions in a financial instrument, suggesting when an asset might be nearing a trend reversal. RSI values range from 0 to 100, with readings below 30 often indicating oversold conditions and readings above 70 suggesting overbought conditions'
