Adani Green Energy Ltd As of April 29, 2025, here are the key weekly support and resistance levels for **Adani Green Energy Ltd based on recent technical analyses:
📈 Weekly Support and Resistance Levels
| Type | Level | Value (₹) |
|------------|--------|-----------|
| Resistance 1 (R1) | 991.77 | ₹991.77 |
| Resistance 2 (R2)| 1,040.48 | ₹1,040.48 |
| Resistance 3 (R3) | 1,066.17 | ₹1,066.17 |
| Support 1 (S1) | 917.37 | ₹917.37 |
| Support 2 (S2) | 891.68 | ₹891.68 |
| Support 3 (S3) | 842.97 | ₹842.97 |
These levels are derived from recent technical analyses and can serve as potential reversal or breakout zones for the stock.
📊 Additional Technical Indicators
Relative Strength Index (RSI): The RSI is 42.48, indicating that the stock is in the neutral territory, suggesting neither overbought nor oversold conditions.
- Moving Averages:
- 5-Day EMA: ₹825.40
- 50-Day EMA: ₹973.00
- 200-Day EMA: ₹1,335.50
- Current Price: ₹919.15
The stock is trading below its 50-day and 200-day exponential moving averages (EMAs), suggesting a short-term bearish trend.
⚠️ Important Notes
- Market Conditions: The stock has experienced significant volatility, with a 52-week high of ₹1,753.17 and a low of ₹455.37. The recent price decline of 19.92% over the past month indicates increased market uncertainty. )
- **Trading Restrictions**: Please be aware of any trading restrictions or circuit limits that may apply to the stock.
Please note that these levels and indicators are based on historical data and technical analysis, and actual market conditions may vary. It's advisable to conduct further research or consult with a financial advisor before making investment decisions.
NIFTY

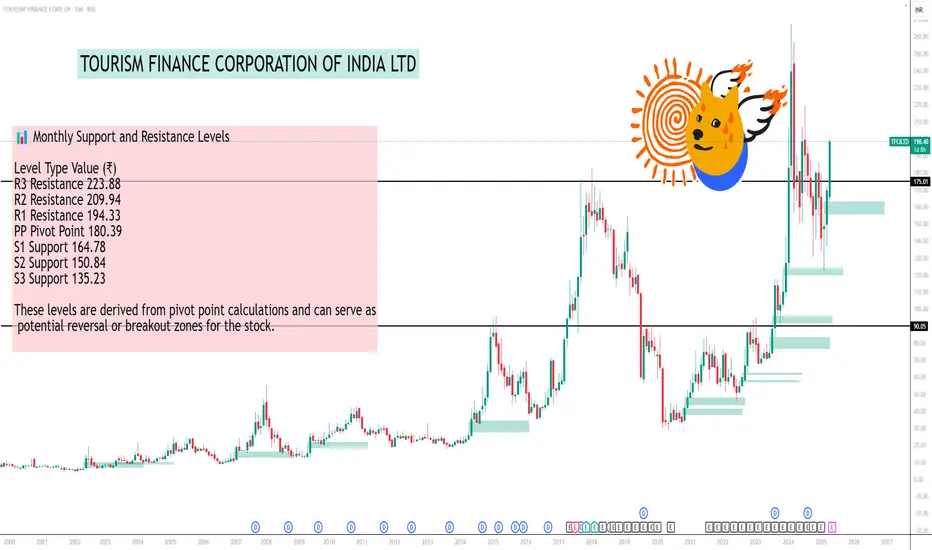
TOURISM FINANCE CORPORATION OF INDIAAs of April 29, 2025, here are the key support and resistance levels for Tourism Finance Corporation of India Ltd. (TFCILTD) based on recent technical analyses:
📊 Monthly Support and Resistance Levels
Level Type Value (₹)
R3 Resistance 223.88
R2 Resistance 209.94
R1 Resistance 194.33
PP Pivot Point 180.39
S1 Support 164.78
S2 Support 150.84
S3 Support 135.23
These levels are derived from pivot point calculations and can serve as potential reversal or breakout zones for the stock.
📈 Additional Technical Indicators
Relative Strength Index (RSI): 56.41, indicating a neutral to slightly bullish momentum.
Moving Averages:
20-Day SMA: ₹137.90
50-Day SMA: ₹152.87
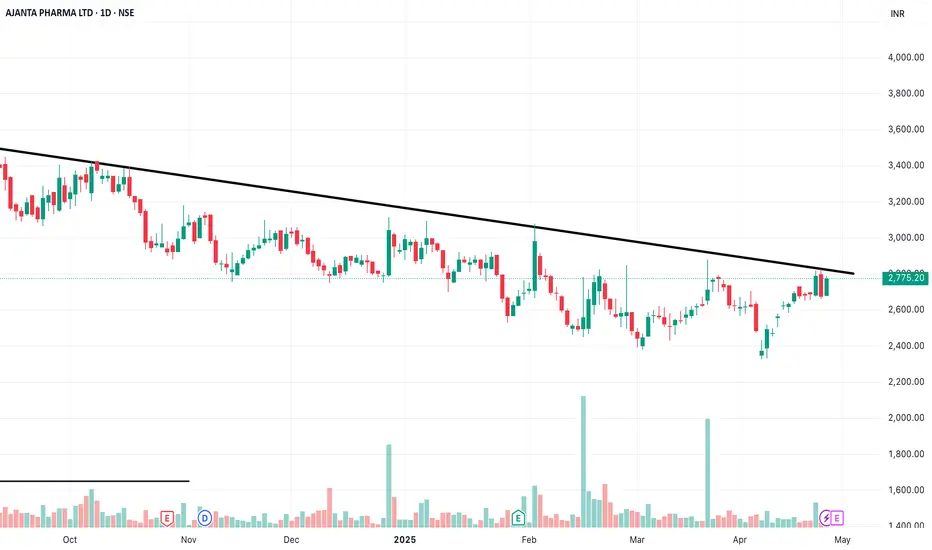
AJANTA PHARMA CMP 2775 Having trend line breakout and with this Breakout , with this breakout it may lead to all time high , Pharma industry is all time favourite and ready to move with appropriate correction.
Support and Resistance Part 2Support occurs at the point where a downtrend is expected to pause due to a concentration of demand. Resistance occurs at the point where an uptrend is expected to pause due to a concentration of supply. Support and resistance areas can be identified on charts using trendlines and moving averages.

Basic to Advance in TradingMake profits in intraday.
Stock market concepts and workings explained from very basic level.
Learn powerful day trading strategies.
Learn a step by step approach of how to trade in intraday.
Trend Following (Wealth Generation)
Learn the art of minimizing the risk and maximizing the return.

Management and PsychologyManagement psychology explores how psychological principles and theories can be applied to understand and improve organizational performance. It focuses on human behavior, motivation, and decision-making within a workplace context, helping managers develop more effective strategies for leading teams and achieving business goals.

PCR StrategyThe Put-Call Ratio (PCR) is a popular technical indicator used by investors to assess market sentiment. It is calculated by dividing the volume or open interest of put options by call options over a specific time period. A higher PCR suggests bearish sentiment, while a lower PCR indicates bullish sentiment.

RSI DivergenceRSI divergence occurs when the price of an asset and the RSI indicator move in opposite directions. This can signal a potential trend reversal or a weakening of the current trend. There are two main types: bearish and bullish divergence.

What is MACD ?MACD, or Moving Average Convergence Divergence, is a momentum indicator used in technical analysis to identify changes in the strength, direction, and duration of a trend. It's calculated by finding the difference between two exponential moving averages (EMAs) and then comparing that difference to its own EMA, according to Investopedia.

Explanation of RSIThe Relative Strength Index (RSI) is a momentum indicator used in technical analysis to assess the speed and magnitude of price changes. It helps traders identify potential overbought and oversold conditions in a financial instrument, suggesting when an asset might be nearing a trend reversal. RSI values range from 0 to 100, with readings below 30 often indicating oversold conditions and readings above 70 suggesting overbought conditions.

Bajaj Finance LTD // 1hour Support and ResistanceAs of April 28, 2025, Bajaj Finance Ltd (NSE: BAJFINANCE) is trading at ₹8,731.60. Based on the latest technical analysis, here are the key support and resistance levels for the 1-hour timeframe:
📊 1-Hour Support and Resistance Levels
Immediate Support (S1): ₹8,744.55
Immediate Resistance (R1): ₹9,002.55
These levels are derived from recent market data and technical analysis. Movements beyond these points may indicate potential changes in the stock's trend.
🔍 Technical Indicators
20 EMA (Exponential Moving Average): ₹8,393.26
50 EMA: ₹8,381.46
Signal: Strong Bearish
The 1-hour chart indicates a strong bearish trend, as both the 20 EMA and 50 EMA are trending downward. This suggests potential selling pressure in the short term.
⚠️ Important Notes
Breakout Above Resistance: If the stock price breaks above ₹9,002.55, it may signal a bullish trend.
Breakdown Below Support: A drop below ₹8,744.55 could indicate further downside potential.
Please note that technical analysis is subject to change based on market conditions. It's advisable to monitor the stock closely and consider consulting with a financial advisor before making any trading decisions.

AXIS BANK LTDAXIS BANK LTD-1W.NSE
Vol
Good chart structure
After a big breakout in previous week, stock has shown a profit booking from higher levels
If it closes above 1185-1200 levels, then more up move is possible
Entry Above 1200
Target 1270/1340
Stop loss 1120

ACC LTDACC LTD:-
As of April 28, 2025, ACC Ltd (NSE: ACC) is trading at ₹2,327.85. Based on recent technical analysis, here are the key intraday support and resistance levels for a 15-minute chart timeframe:
📉 Support Levels (15-Minute Chart)
Support 1 (S1): ₹2,316.93
Support 2 (S2): ₹2,306.02
Support 3 (S3): ₹2,294.98
These levels are derived from recent pivot point calculations and may act as potential entry points or stop-loss levels for short trades.
📈 Resistance Levels (15-Minute Chart)
Resistance 1 (R1): ₹2,327.97
Resistance 2 (R2): ₹2,338.88
Resistance 3 (R3): ₹2,349.92
These resistance levels are based on recent pivot point calculations and can serve as potential targets for long trades or areas to watch for price reversals.
🔍 Technical Indicators (15-Minute Chart)
EMA (5): ₹2,310.56 (Bullish)
EMA (10): ₹2,309.98 (Neutral)
EMA (15): ₹2,310.18 (Bullish)
EMA (20): ₹2,310.68 (Mild Bullish)
EMA (50): ₹2,319.19 (Mild Bearish)
The shorter-term EMAs (5, 10, and 15) indicate a bullish trend, suggesting upward momentum. However, the 50-period EMA shows a mild bearish trend, indicating potential resistance at higher levels.
⚠️ Important Notes
Market Conditions: The stock market is influenced by various factors, including economic data, corporate earnings, and global events. It's essential to stay informed about these factors when making trading decisions.
Risk Management: Always use proper risk management techniques, such as setting stop-loss orders and only risking a small percentage of your trading capital on each trade.
Consult Professionals: Consider consulting with a financial advisor or conducting further research before making any trading decisions.

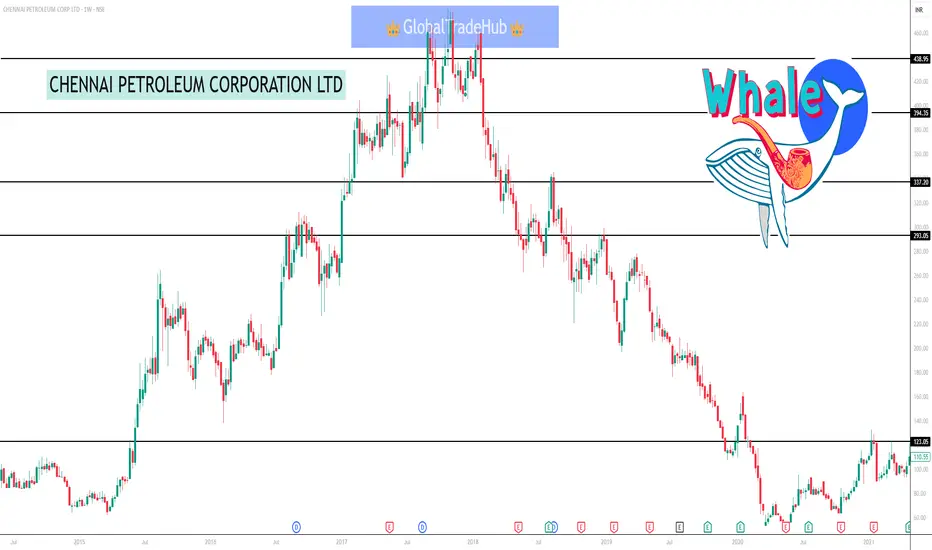
CHENNAI PETROLEUM CORPORATION LTD#CHENNPETRO
Weekly Time Frame Technical Analysis for Chennai Petroleum (CHENNPETRO) Potential Bullish Scenario:
If the bullish engulfing candle is confirmed with subsequent positive price action, the stock could see an upward move.
A break above the recent high around ₹670-1680 could signal further bullish momentum.
Potential Bearish Scenario:
Failure to sustain above the rising support trendline could lead to further downside.
Strong resistance might be encountered at higher levels, potentially limiting the upside.
Buy & Sell Setup (Weekly Time Frame):
Buy Setup:
Entry: Consider entering in the range of 2530 - ₹570, as suggested by some analysts, especially if there is confirmation of the bullish reversal.
Alternatively, a more conservative entry could be considered on a sustained break above ₹680. Targets:
Target 1: *650 - ₹670 (Short-term)
Target 2: *750 - ₹780 (Medium-term)
Target 3: *850+ (Medium to Long-term)
Stop Loss: Place a stop loss below the recent low or around 433 to manage risk, as suggested by some analyses. A slightly tighter stop loss could be considered based on your risk tolerance, potentially below a key weekly support level.
Sell Setup:
Entry: Consider a short position if the price breaks down decisively below the
rising support trendline, especially
Increased volume.
Targets: Potential targets could be previous support levels, such as ₹500, 450, and the recent low of *433.
Stop Loss: Place a stop loss above the breakdown level or a recent swing high to limit potential losses.
Important Considerations:
Potential Buy Setup Box:
Entry Zone: *580 - ₹635
This zone encompasses the current price action and the recent bullish engulfing candle. Entering within this range assumes the bullish momentum will continue. Target 1: *670 - ₹680 (Previous swing high, potential initial resistance)
Target 2: *750 - ₹780 (Medium-term target based on Fibonacci levels and previous price action)
Stop Loss: Below *530
This level provides a buffer below the recent low and the potential support trendline. A break below this could negate the immediate bullish scenario.
Potential Sell Setup Box:
Entry Zone: *670-2700
This zone represents a potential area of resistance based on the previous swing high. Shorting within this range assumes a failure to break above this level.
Target 1: *635 - *610 (Initial support level)
Target 2: *580 - ₹550 (Further support zone)
Stop Loss: Above *720
This level provides protection against a potential breakout above the resistance zone.
Visual Representation (Conceptual):
Potential Buy Setup:
Entry Zone: *580-2635
Target 1: 2670-680
Target 1: 670 - ₹680 Target 2: *750 - ₹780
Stop Loss: Below *530
Potential Sell Setup:
Entry Zone: *670 - ₹700
Target 1: *635-610
Target 2: 580-2550
Stop Loss: Above *720
This Analysis for only education purpose & learning
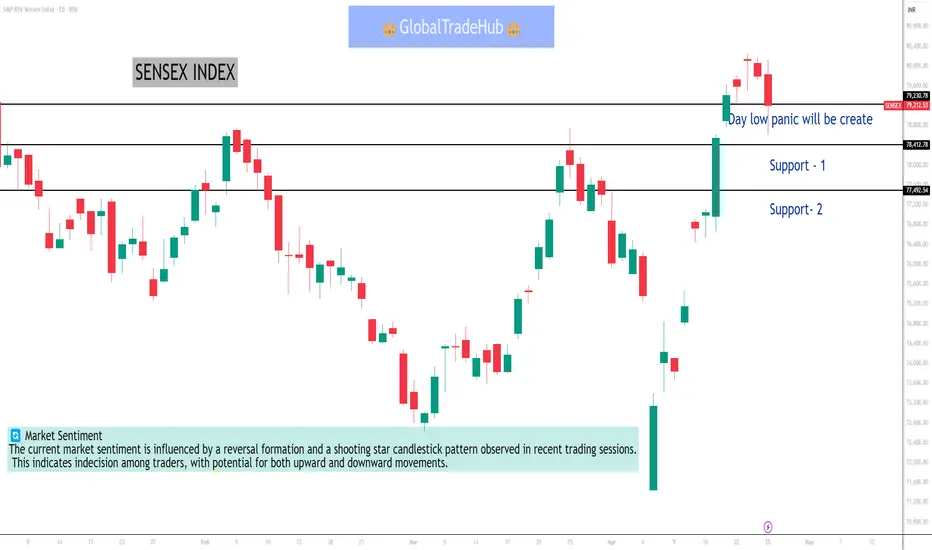
Sensex index Sensex index :-
As of April 28, 2025, the BSE Sensex is exhibiting a neutral to slightly bearish short-term trend. Technical indicators suggest that the index is trading within a defined range, with key support and resistance levels to watch for intraday trading.
📉 Support Levels
Immediate Support: Approximately 75,847
Secondary Support: Around 75,555
Tertiary Support: Near 75,096
These levels are derived from pivot point calculations based on the previous day's trading range. A breach below these supports could indicate further downside potential.
📈 Resistance Levels
Immediate Resistance: Approximately 77,349
Secondary Resistance: Around 77,057
Tertiary Resistance: Near 76,765
These resistance levels are also based on pivot point analysis. A breakout above these levels could signal a potential upward movement.
🔄 Market Sentiment
The current market sentiment is influenced by a reversal formation and a shooting star candlestick pattern observed in recent trading sessions. This indicates indecision among traders, with potential for both upward and downward movements.
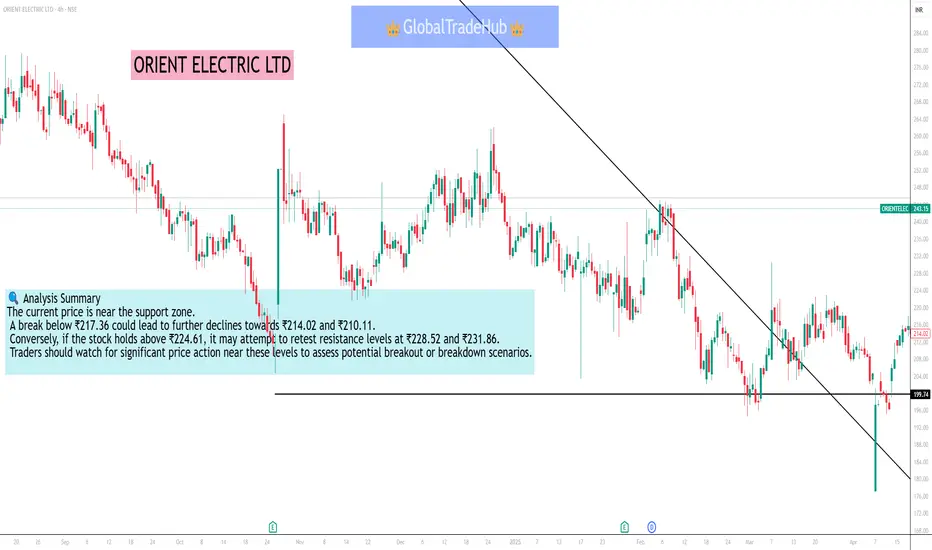
Orient Electric Ltd Orient Electric Ltd :-
🔹 Support Levels
S1: ₹217.36
S2: ₹214.02
S3: ₹210.11
🔹 Resistance Levels
R1: ₹224.61
R2: ₹228.52
R3: ₹231.86
These levels are derived from pivot point calculations and are widely used by traders to identify potential reversal points or breakout zones.
📊 Technical Indicators
Relative Strength Index (RSI): 57.51 (Neutral)
Average True Range (ATR): 11.34 (Indicates moderate volatility)
Moving Averages: The stock is trading below its 50-day, 100-day, and 200-day moving averages, suggesting a bearish trend.
🔍 Analysis Summary
The current price is near the support zone. A break below ₹217.36 could lead to further declines towards ₹214.02 and ₹210.11. Conversely, if the stock holds above ₹224.61, it may attempt to retest resistance levels at ₹228.52 and ₹231.86. Traders should watch for significant price action near these levels to assess potential breakout or breakdown scenarios.
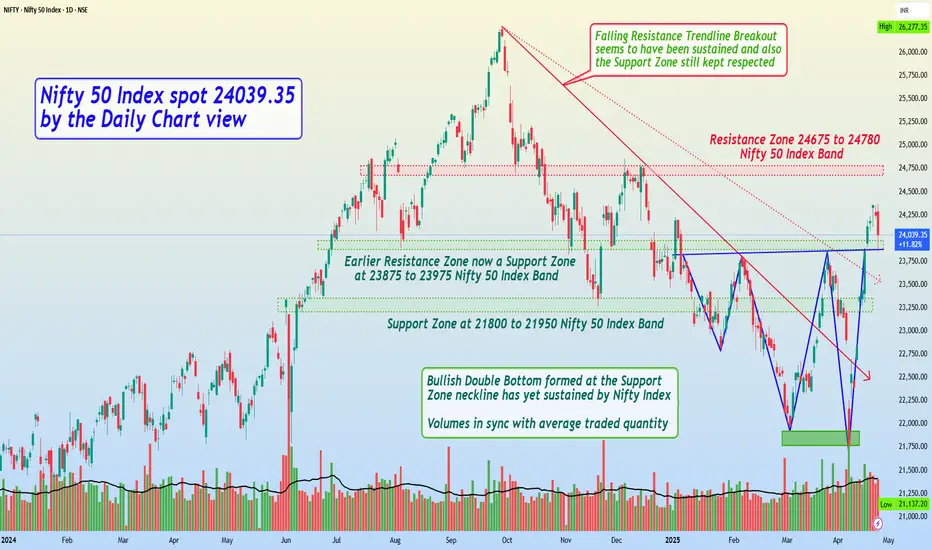
Nifty 50 Index spot 24039.35 by Daily Chart view - Weekly UpdateNifty 50 Index spot 24039.35 by the Daily Chart view - Weekly Update
- Resistance Zone 24675 to 24780 Nifty 50 Index Band
- Volumes are in good sync with the average traded quantity
- Both the Falling Resistance Trendlines have been decently maintained todate
- Earlier Resistance Zone now a Support Zone at 23875 to 23975 Nifty 50 Index Band
- Bullish Double Bottom formed at the Support Zone neckline has yet sustained by Nifty Index
RSI DivergenceRSI: Divergence appears when the RSI's highs or lows diverge from price. For example, if the price makes new lows but the RSI bottoms at higher levels, it signals bullish divergence; if the price makes new highs but the RSI peaks at lower levels, it signals bearish divergence.

Technical class 1In trading, "technical" refers to the practice of analyzing historical price and volume data to identify patterns and predict future price movements. This approach, called technical analysis, is a way to evaluate securities and forecast their behavior based on charts and statistical data.

Database Trading part 3InfluxDB is a high-performance, purpose-built time-series database designed for real-time analytics. It boasts low-latency writes, efficient storage, and a powerful query engine tailored for event-driven systems like algorithmic trading.

MACD Trading Part 2A common strategy is to buy when the MACD line crosses above the signal line, as this indicates bullish momentum. Another strategy is to sell when it crosses below (which indicates bearish momentum). Forex traders also often look for divergence

MACD Trading AnalysisIn trading, MACD stands for Moving Average Convergence Divergence. It's a technical indicator used to analyze the strength, direction, and momentum of a stock's price. The MACD helps traders identify potential entry and exit points in a trade by analyzing the convergence and divergence of two moving averages.

Advanced Database TradingAdvanced database systems are crucial in modern finance, particularly for trading, offering functionalities beyond standard relational database management systems. They provide tools for real-time data analysis, efficient storage, and low-latency writes, enabling algorithmic trading and other complex operations.
