Nifty Faces Resistance: Bullish Momentum Expected Above 24kNifty has breached its trendline resistance but encountered selling pressure near the 23,870 level, suggesting a possible pullback toward the 23,000 support zone.
A potential Inverted Head & Shoulder pattern is forming, which could signal a trend reversal. However, confirmation would require a decisive breakout and sustained hold above the 24,000 resistance level. Also the open interest data indicates strong call writing at 24,000, reinforcing its significance as a key resistance.
In the near term, the index is expected to trade sideways, with market participants awaiting Q4 earnings results for further directional cues. The upcoming earnings season will likely dictate the next major move in the market.
NIFTY

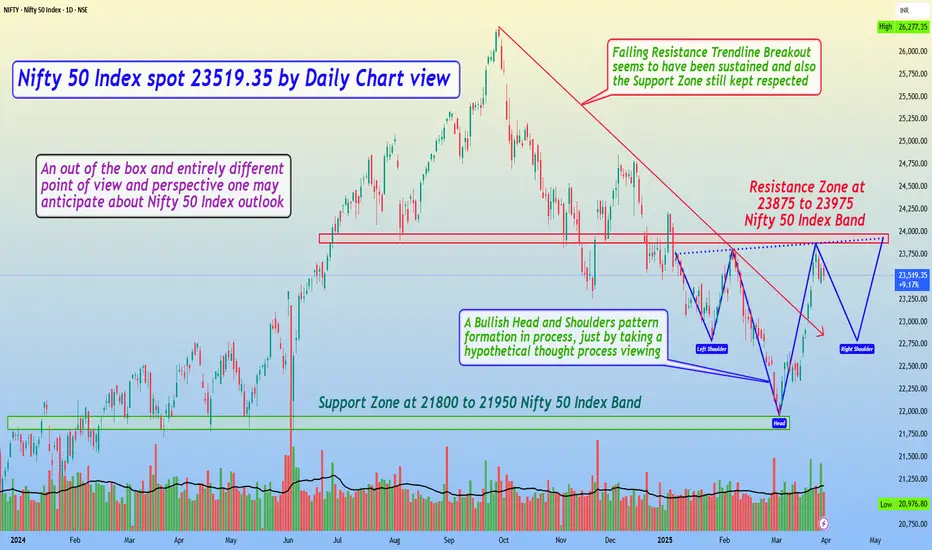
Nifty 50 Index spot 23519.35 by Daily Chart view - Weekly updateNifty 50 Index spot 23519.35 by Daily Chart view - Weekly update
- Support Zone at 21800 to 21950 Nifty 50 Index Band
- Resistance Zone at 23875 to 23975 Nifty 50 Index Band
- Falling Resistance Trendline Breakout seems to have been sustained and also Support Zone still kept respected
- A Bullish Head and Shoulders pattern formation in process, just by taking a hypothetical thought process viewing
- An out of the box and entirely different point of view and perspective one may anticipate about Nifty 50 Index outlook
- Going by this Hypothetical H&S probability for the Nifty 50 Index Chart, we may anticipate good fire crackers to observe
- As such this is just a high level technical chart pattern formation and the Market are always Supreme to work in their own ways
GIFT Nifty Projections for week 3 of March and beyondFundamentals/Basis :
Due to most uncertainties of the US related news including Trump Tariff wars, US shutdown vote, Russia Ukraine war ceasefire talks, US possible recession, most of the global economies were in downward trend including US,excepting china which is seeing correction /growth.
How India will deal with US tariffs is a wait and watch , which could come into effect starting April. With Ministers flying to US to negotiate and trying to find middle path, one can expect a reasonable middle ground with US tariffs, by increasing US supplies,reducing tariffs etc from the Indian govt. At this moment, Indian government might not go for a tit-for-tat approach , which will hurt its interests.
Technicals :
Most of the corrections had happened since the election of Trump, the Nifty had been on the decline since its highs of oct last year and is at lower than yearly lows.
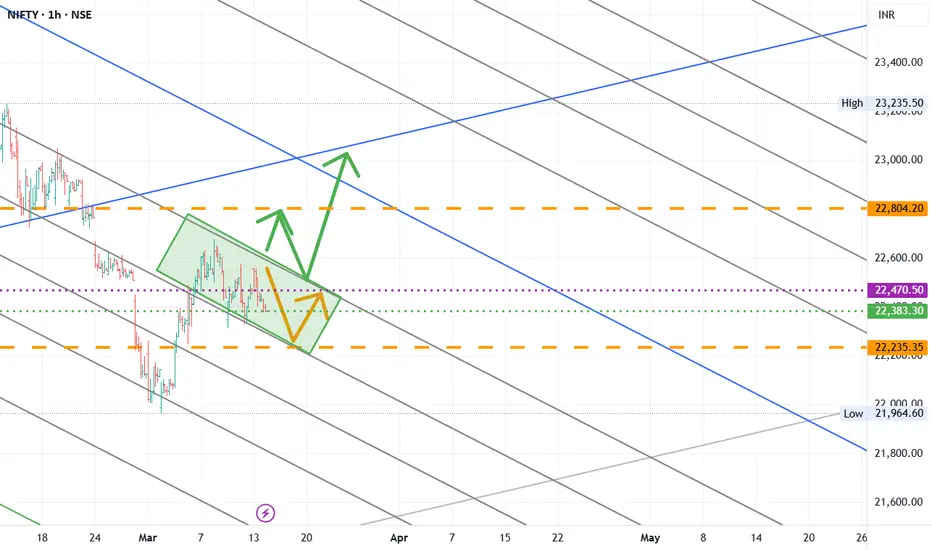
Price of Gift Nifty gives an early indication of the Nifty 50 movement.
Price is moving in a channel ,shown in the rectangular box and has a minor breakout.
Trade Idea:
If the Price breaks out of 22600, can test 22720-780- and after a retrace to a max of 450 can bounce again to 22940-23080
If the price could not break or sustain 22600 ,probable to fall with the channel again and test 22280-320.
These higher and lower levels mentioned will be decision points for further trends for the rest of the year.
Disclaimer : Analysis expressed are my own personal analysis and views. Not a SEBI registered analyst. Plan and trade as per your analysis.

NIFTY Analysis Mar Week 3 and beyondNote:
Most of the below Basis is given in my GIFT idea dated on same date.
Fundamentals/Basis:
Due to most uncertainties of the US related news including Trump Tariff wars, US shutdown vote, Russia Ukraine war ceasefire talks, US possible recession, most of the global economies were in downward trend including US,excepting china which is seeing correction /growth.
How India will deal with US tariffs is a wait and watch , which could come into effect starting April. With Ministers flying to US to negotiate and trying to find middle path, one can expect a reasonable middle ground with US tariffs, by increasing US supplies,reducing tariffs etc from the Indian govt. At this moment, Indian government might not go for a tit-for-tat approach , which will hurt its interests.
Technicals:
Most of the corrections had happened since the election of Trump, the Nifty had been on the decline since its highs of oct last year and is at lower than yearly lows.
Price is moving in a small channel ,shown in the rectangular box.
Trade Idea :
If the Price breaks out of 22600, can test 22780-810 and after a retrace to a max of 520 can bounce again to 22940-23080
If the price could not break or sustain 22600 ,probable to fall with the channel again and test 22280-230.
These higher and lower levels mentioned will be decision points for further trends for the rest of the year.
Disclaimer: Analysis expressed are my own personal analysis and views. Not a SEBI registered analyst. Plan and trade as per your analysis.
If you Like the Analysis and agree with , Hit the Boost button and share your views / agreements/constructive feedback in the comments.
HDFC Bank - Long Term AnalysisFundamentals/Basis:
HDFC Bank is an important scrip that need to be monitored on long term basis, if we invest or not.
This is due to the fact, as a leader in the banking industry and a heavy weight company in the Nifty and bank nifty constituencies, HDFC bank provides clues to the overall market direction (most of the times)
This analysis is for Long term and if time permits, will keep updating throughout the year.
Technicals :
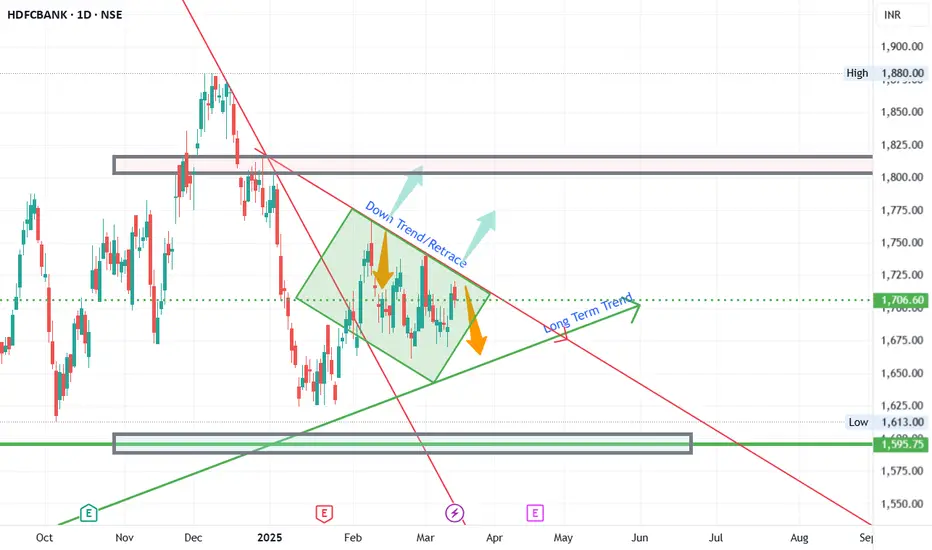
HDFC bank fell from its highs since end of 24 until jan. And had a retracement until approximately 1770 and formed a retracement trend direction.
Current range : 1600 to 1800 with 1700s as pivots.(Not formula but based on charts)
Trade Ideas :
If the price moves above the retracement line and sustains, go for long in the stock. Once it breaks lookout for confirmation at this trendline and also at the Long term trendlines for any retests.
Alternatively, if the price falls below the Long term trend direction, wait for confirmation on the bullishness.
Disclaimer : All the views and analysis provided are my personal analysis. Not a SEBI registered analyst. Plan and trade as per your analysis
If you Like the Analysis and agree with , Hit the Boost button and share your views agreements/constructive feedback in the comments.
Would you like me provide any of your favorite stocks analysis, let me know in the comment.
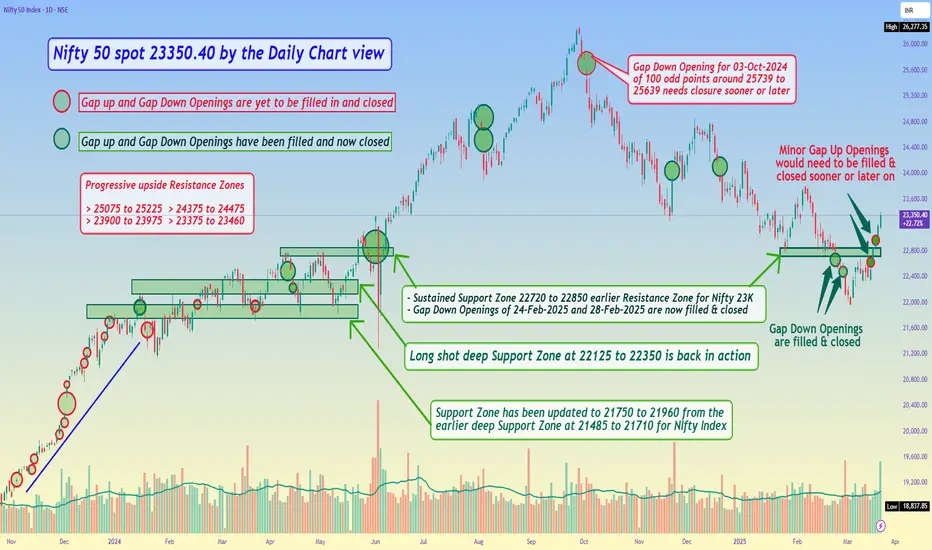
Nifty 50 spot 23350.40 by the Daily Chart view - Weekly updateNifty 50 spot 23350.40 by the Daily Chart view - Weekly update
- Sustained Support Zone 22720 to 22850 earlier Resistance Zone for Nifty 23K
- Minor Gap Up Openings around above Support Zone would need to be filled & closed sooner or later on
- Next set of Resistance Zones seen at indicative Nifty 50 Index levels of 23375 to 23460 and 23900 to 23975
NIFTY Prediction for Tomorrow – March 25, 2025What happened on last day:
As we discussed, the NIFTY has been in a sideways accumulation phase, and it has now broken to the upside.
If we look at the chart now:
The market is trading just below the 200 EMA (1D-tf) , which is acting as a strong resistance. Price has shown strong bullish momentum and has successfully broken out from the descending PINK trendline , which had held the price for over 10 months.
Structure-wise, NIFTY is forming higher highs and higher lows , suggesting a clear shift in momentum from bearish to bullish.
Price is trading above the 13, 50, and 100 EMAs , but still below the 200 EMA , which remains the immediate level to cross.
RSI = 64 , showing strong bullishness but not yet in the overbought zone — bulls still have strength.
Price is also trading above VWAP , confirming healthy bullish bias on the day.
All important breakout levels, retest zones, and trendlines are clearly marked on the chart.
Support levels: 22,775, 21,987, 21,840
Resistance levels: 23,600, 23,870, 24,790
If we look at the OI data:
PCR = 1.1 , showing a strong bullish structure in the options market.
There is strong Put writing at 23,000, 23,100, and 23,200 levels which are likely to act as near-term supports.
On the upside, significant Call writing is seen at 23,600, 23,700, and 23,800 levels — making them key resistance levels.
We are currently in the last week of the March monthly expiry (27 Mar) , so this OI structure gives strong directional cues.
If we look at the news & sentiment:
INDIA VIX = 12.6 , showing low volatility expectations.
No negative macro or global cues, INR and crude oil are stable.
Sentiment across financial media is cautiously bullish , with attention on whether NIFTY can sustain above the 23,600 zone.
I am expecting
The market to be sideways to bullish unless it breaks above 23,600 decisively, which could lead to further rally toward 23,870 and 24,790 .
Reasons:
✅ Breakout from 10-month falling channel
❗Price > EMA(13, 50, 100) but just below 200 EMA (Bullish but watch for breakout)
✅ Volume spike confirms institutional participation
✅ Clean higher-low structure forming
✅ Above 50 EMA and approaching 200 EMA
Verdict: Sideways or Bullish
Plan of action:
Sell 23,600 CE and 23,600 PE — hold the position within range.
Exit one leg if price breaks on either side with momentum and volume.

NIFTY - BULLISHWe have seen a decent time/price correction in main and broader indices.
I am expecting FULL recovery in 2025 and targets are 25000 and then 27000 for Nifty in 2025 itself.
More wealth will be created in beaten down quality mid and small cap segment.
Go long, Stay long.

Nifty 50 potential structure It seems nifty 50 complete correction for upside . Now it's time to hold investment. It might break once more impulse to downside potential. Do your analysis. The idea is only I got.

NIFTY Intraday Trade Setup For 20 Mar 2025NIFTY Intraday Trade Setup For 20 Mar 2025
Bullish-Above 22950
Invalid-Below 22900
T- 23125
Bearish-Below 22800
Invalid-Above 22850
T- 22635
NIFTY has closed on a slight bullish note with 0.32% gain today. Yesterday we discussed that 22900 will act as a confluence zone as that was 50% retracement zone , which resulted into sideways market. Index is at striking distance from 50 EMA in daily TF. Intraday traders should lower position size as it is a confluence zone in which bulls and bears may start tug of war. Let breakout happen or resistance to be taken.
Coming to Thursday's trade setup, if index opens flat and a 15 Min candle closes above 22950 then we will long for the target of 23125.
For selling we need a 15 Min candle close below 22800. T- 22635.
In case of a big gap up/down, wait till 10 o'clock and mark the high and low of the trading range (5MIN). Trade on this range breakout.
==========
I am Not SEBI Registered
This is my personal analysis for my personal trading. Kindly consult your financial advisor before taking any actions based on this.

NIFTY Intraday Trade Setup For 19 Mar 2025NIFTY Intraday Trade Setup For 19 Mar 2025
Bullish-Above 22900
Invalid-Below 22850
T- 23125
Bearish-Below 22680
Invalid-Above 22730
T- 22470
NIFTY has closed on a bold bullish note with 1.45% gain yesterday. 4 days range that we discussed was shifted last day and gave a very good momentum in the upside. Buy targets were achieved almost in flow. Now 22900 looks like a confluence zone as that's 50% retracement from previous swing high in daily TF, may act as resistance. In case it gives pullback breakout then will consider buy. 22680 will be intra support.
Coming to Wednesday's trade setup, if index opens flat and a 15 Min candle closes above 22900 then we will long for the target of 23125.
For selling we need a 15 Min candle close below 22680. T- 22470.
In case of a big gap up/down, wait till 10 o'clock and mark the high and low of the trading range (5MIN). Trade on this range breakout.
==========
I am Not SEBI Registered
This is my personal analysis for my personal trading. Kindly consult your financial advisor before taking any actions based on this.

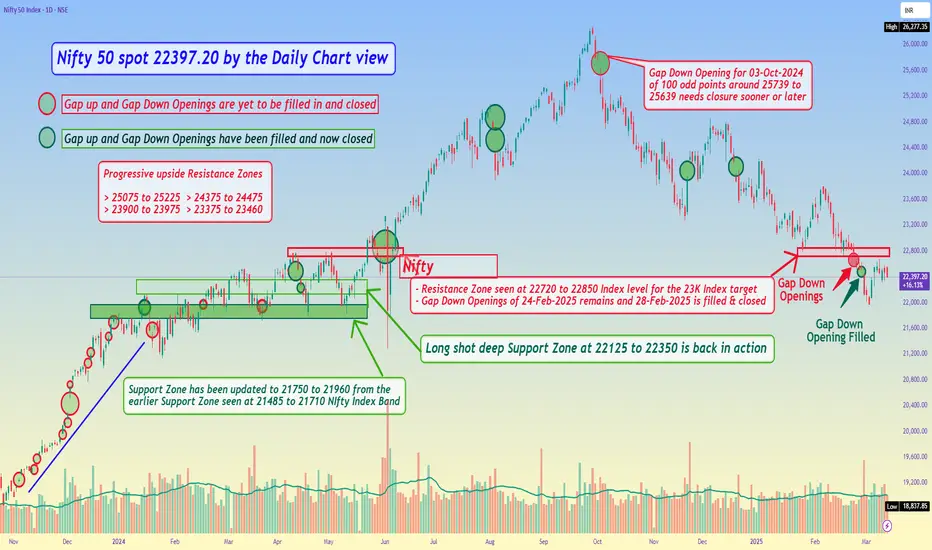
Nifty 50 spot 22397.20 by the Daily Chart view - Weekly updateNifty 50 spot 22397.20 by the Daily Chart view - Weekly update
- Resistance Zone seen at 22720 to 22850 Index level for the 23K Index target
- Gap Down Openings of 24-Feb-2025 remains and 28-Feb-2025 is filled & closed
- Long shot deep inline Support Zone seen at 22125 to 22350 is now back in action
Trent ..... bottoming signs seenChart is self explanatory. Trent after a correction may seems to end correction....
Risk i feel i less here than reward...
So my view from bearish turns to neutral
Now mild bullish rather......

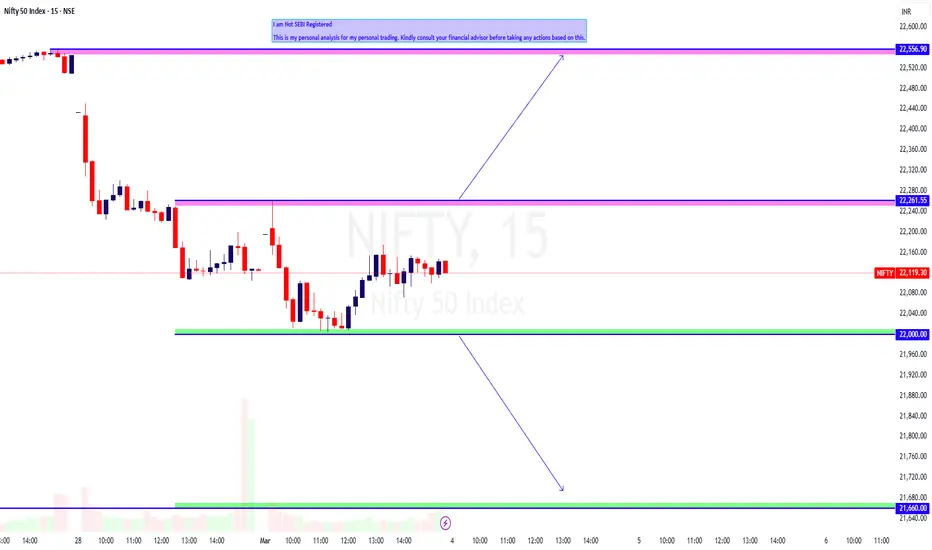
Nifty trade setup with support and resistance Key levels 💡 are mentioned in the chart 📊.
1. Bullish if Nifty trade and sustain above 22620-30.
2. Bearish if Nifty not hold 22420 level and further fall below 22320.
3. Between these trend lines higher chances of consolidation (Premium eating game)

Can NIFTY Regain Its Balance or Will It Plummet Further?Timeframe: 4h
After reaching a peak of 26,277 , the NSE NIFTY has begun to decline within a downward parallel channel. The Elliott wave structure can be identified as (W) – (X) – (Y) , where wave (X) peaked at 24,867 , followed by a downward movement for the final wave (Y). The price has fallen below the 20 , 50 , 100 , and 200 EMA levels, with an ATR of 166.36 .
The correction has several key levels to consider:
At 100% retracement of wave (W) at 21,962
At 100% retracement of wave (a) at 22,827
At the lower boundary of the corrective channel
Bearish sentiment is currently stronger than buyer demand. A reversal may occur either after a breakout from the parallel channel or at the lower boundary of the channel. This is possible as long as the swing low of 21,283 remains intact.
We will update further information soon.

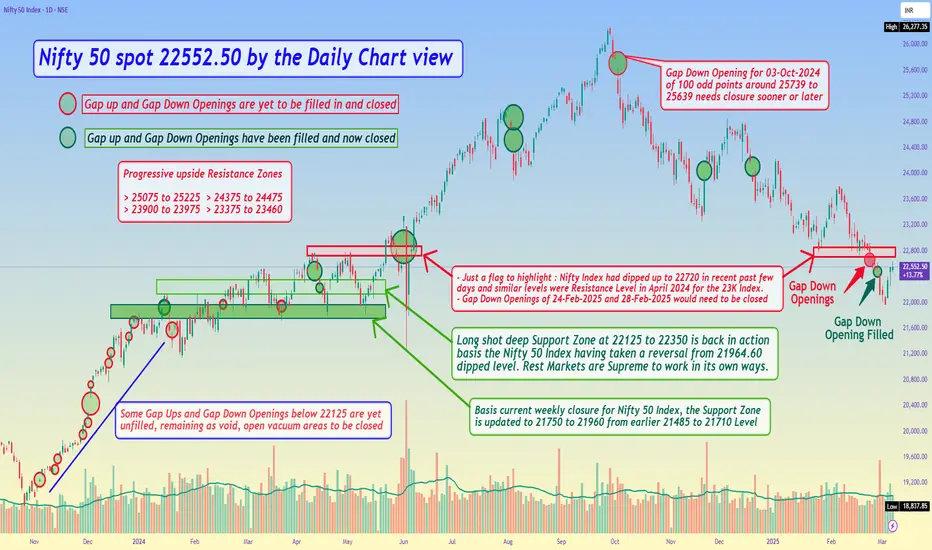
Nifty 50 spot 22552.50 by the Daily Chart view - Weekly Update*Nifty 50 spot 22552.50 by the Daily Chart view - Weekly Update*
- Gap Down Opening of 28th February, 2025 is now filled and has been closed
- Basis current weekly closure for Nifty 50 Index, the Support Zone is updated to 21750 to 21960 from earlier 21485 to 21710 Level
- Long shot deep Support Zone at 22125 to 22350 is back in action basis the Nifty 50 Index having taken a reversal from 21964.60 dipped level.
- Rest Markets are Supreme and work in their own ways. We can at most anticipate, expect and look forward for the best to happen by our assumptions
NIFTY Analysis for today 6 March 25As we discussed yesterday, Nifty took a pullback from 22000. It has shown a good bullish signal at this level.
If we look at the chart now:
The market is trading at 200 EMA (15 EMA) and 50 EMA (1 H - TF), which is going to provide resistance at this level. The market is trading in the accumulation phase. If it breaks this zone, then the next resistance is a higher trendline at 1D TF, which I shared yesterday.
Support levels: 21987, 21840
Resistance levels: 22400, 22615, 22775, 200 EMA

NIFTY prediction for tomorrow 5th March 25Nifty has been falling continuously for a month. If we look at the structure using price action.
If we look at the chart now:
The market is trading near the support zone. The market might take support at nearly 22,000 levels. Price is trading far away from the EMA, which shows the market is going to take some pullback to the upside. The market is going to be sideways for some time unless it breaks the Pink trendline to the upside.
Support levels: 21840, 21250
Resistance levels: 22775, 23488, 50 EMA, 200 EMA
If we look at the OI data:
PCR = 0.8, which shows a slightly bullish structure in the market. The market has 22100 as max pain. The market has good PE writing at lower levels; 22000 and 21900 have very good PE writing, which will act as good support in this area.
I am expecting
The market is to be sideways unless it breaks the PINK trendline.
Reason:
RSI = 21 shows a bullish structure. (Weak Bearish -> Bulls might start buying, soon)
Price < EMA(13, 50, 200), which indicates a good Bearish structure. (Bearish)
PCR = 0.8 indicates a slightly bullish bias direction in the market.
Price < VWAP shows a good Bearish structure in the market.
Verdict: Sideways
Plan of action:
follow the chart levels. You better go with the bound strategy.

NIFTY Intraday Trade Setup For 4 Mar 2025NIFTY Intraday Trade Setup For 4 Mar 2025
Bullish-Above 22270
Invalid-Below 22220
T- 22550+
Bearish-Below 22000
Invalid-Above 22050
T- 21660
NIFTY has closed on a flat note today, it was a 2 way move day. Index opened gap up and was sold into immediately till 22k. 22000 acted as an intraday support. 21600 zone will be a strong support zone as per 2.0 PRZ in daily and weekly TF. As of now we have been following sell on rise as index is continuously closing below PDH and is below 50 EMA in daily TF. 22270 and 22000 are intraday levels for tomorrow.
Coming to Tuesday's trade setup, if index opens flat and a 15 Min candle closes above 22270 then we will long for the target of 22550+.
For selling we need a 15 Min candle close below 22000. T- 21660.
In case of a big gap up/down, wait till 10 o'clock and mark the high and low of the trading range (5MIN). Trade on this range breakout.
==========
I am Not SEBI Registered
This is my personal analysis for my personal trading. Kindly consult your financial advisor before taking any actions based on this.
Nifty at a 1000-Day Trendline Support - Finally we are here !!Nifty is currently testing a confluence of two long-term trendlines – one from the monthly timeframe (blue line) and another from the weekly timeframe (yellow line). This 1000-day trendline cluster is a major reactive support zone, making this a make-or-break level for the index.
🔍 Key Observations:
✔️ The blue trendline represents a long-term uptrend, making it a crucial level for institutional traders.
✔️ The yellow trendline, which has also acted as a dynamic support, adds strength to this zone.
✔️ A breakdown below this cluster could open doors for further downside
✔️ However, if Nifty holds this level, a strong rebound can be expected, potentially continuing its long-term bullish structure.
🚀 What’s Next?
A weekly close below this zone could accelerate selling pressure.
If buying emerges, this could be a great risk-reward trade for swing and positional traders.
Price action confirmation is key before making any major trading decisions!
🔥 Will this historical support hold, or is a deeper correction coming? Drop your thoughts in the comments! 👇

Nifty 50: Mission Dive 2… Are We Gearing Up for Another Dive? Attention, traders! The Nifty 50 Air Force successfully completed its deep dive operation, hitting all marked coordinates—23,056, 22,208, and even making an exact low of 22,004.70, just kissing 22,003 like a pilot executing a perfect touch-and-go landing! 🎯
But before the ground crew could celebrate, Nifty pulled up and is now hovering at 22,121. So, what’s next? Is this a refuelling stop, or are we just gaining altitude for another nosedive? 🛫
The Battle Plan:
Nifty now faces enemy resistance at 22,413-22,455-22,670—a tough air defence zone. If it fails to break through, the flight path might take it towards deep bear territory at 21,287, 20,712, and, if things get really bumpy, 20,415. 🐻💥
🚨 Extreme Crucial Support Alert!
Before hitting full panic mode, one crucial airbase at 21,287 could provide emergency support. If this level holds strong, we might witness a solid counterattack from the bulls, leading to a potential rebound. However, if the support collapses, it’s a freefall toward 20,712 & 20,415—the deep war zones! 🚨📉
Trader’s Mission Briefing:
If Nifty breaches 22,670, it might try to regain lost altitude. 🚀
If it gets shot down at resistance, the descent mission resumes with 21,287 as the first landing strip. 🛬
Below 21,287, expect a sharp descent towards 20,712 and 20,415—time to brace for impact! 💣
Commanders, keep your trading parachutes (stop-losses) secured and eyes on the radar. The bears are still controlling the airspace, but 21,287 could be the last stronghold before bulls take a stand. This mission isn’t over yet! 🎖️
Over and out! 🛫⚡

Breakdown in NIFTY...Nifty has broken it's channel support line (Lower Channel Level) on weekly closing basis. Nifty's next two support after breakdown are marked with green lines.
Disclaimer: This is for demonstration and educational purpose only. This is not buying or selling recommendations. I am not SEBI registered. Please consult your financial advisor before taking any trade.

Nifty 50 Index 22124.70 by Daily Chart view: Different ViewpointNifty 50 Index 22124.70 by the Daily Chart view - Different Viewpoint
A different point of view for the Nifty 50 Index Technical Chart Setup Analysis. This is solely and purely my personal perspective for the Bearish Head & Shoulders pattern's. I will be happy to welcome and get your fine line pointers for the improvement on the Technical Analysis for this Chart Setup. Thank you in advance to One and All.
The 1st H&S Bottom is broken down and now need to look forward, if ..... Nifty 50 Index touches the 2nd H&S Bottom or takes an early reversal ..... Hope for the best to happen and keeping fingers crossed. God Bless All.
