NIFTY Intraday Trade Setup For 30 Dec 2025NIFTY Intraday Trade Setup For 30 Dec 2025
Bullish-Above 26050
Invalid-Below 26000
T- 26260
Bearish-Below 25900
Invalid-Above 25950
T- 25650
We discussed that index may test 25900 below 26110, triggered and reached. Last week a shooting star candle has been formed in weekly TF. Now below 25900 index may extend the move till 25650. Bullish move can be seen if index sustains above 26050. 50 EMA in daily TF can be a confluence zone, break of which will trigger a short term bearishness in overall market. Plan the view on 15 Min candle close.
I am Not SEBI Registered
This is my personal analysis for my personal trading. Kindly consult your financial advisor before taking any actions based on this.
NIFTY

Nifty 50 spot 26042.30 by Daily Chart view - Weekly UpdateNifty 50 spot 26042.30 by Daily Chart view - Weekly Update
- Nifty has closed fairly above the Support Zone
- Support Zone steadfast at 25710 to 26010 for Nifty Index
- Resistance Zone grounded at 26200 to ATH 26325.80 for Nifty Index
- Volumes have fallen well below the average traded quantity thru the week
- Falling Resistance Trendline and the Resistance Zone rejection remain intact

NIFTY Intraday Trade Setup For 26 Dec 2025NIFTY Intraday Trade Setup For 26 Dec 2025
Bullish- Above 26250
Invalid-Below 26200
T- 26370-450
Bearish-Below 26110
Invalid-Above 26160
T- 25935
NIFTY has closed on a slight bearish note last day, ending near day low. Below 26110 there is a chance of gap filling towards 25930 zone, strong support placed at 25900. On flat opening short below 26110 on a 15 Min candle close. In case index surprises bears above 26350, then index will shot up towards 26450 zone. Buy above 26350 on a 15 Min candle close. Intraday support lies near 25930-25950 and resistance at 26450. Index is in bulls grip overall.
I am Not SEBI Registered
This is my personal analysis for my personal trading. Kindly consult your financial advisor before taking any actions based on this.

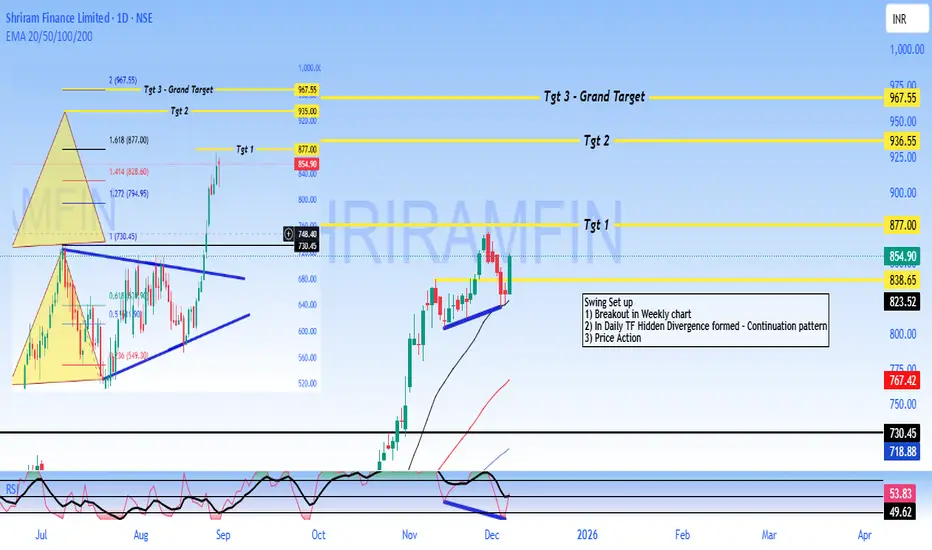
SHRIRAM - Buy - SwingTrading #Shriram Finance Limited - #Technical Analysis
Price: 854.90
#Technical Setup
Pattern: Continuation pattern with bullish hidden divergence following weekly breakout
Key Levels:
- Target 1: 877.00
- Target 2: 936.55
- Target 3: 967.55
- Support: 838 - 825 (critical)
- Major Support: 730.45
#Outlook
The chart shows a swing trading setup with upside potential toward 877 - 967 if support at 838 holds. A break below 825 would invalidate the bullish structure.
DISCLAIMER
This is NOT investment advice. This analysis is for educational purposes only. Trading involves substantial risk of loss. Always conduct your own research and consult a SEBI-registered financial advisor before making investment decisions. Past performance and technical patterns do not guarantee future results. The author assumes no responsibility for any losses incurred.
nifty 50 in coming weeks of 2026nifty 50 can be bought near 24700-300 range for 26700-27000 zones view invalid below 24200

APOLLO: Structural Reversal from Key Support Zone🚀 Long Setup: NSE:APOLLO Micro Systems (APOLLO)
Trade Parameters
Entry Zone: ₹245.00 – ₹255.00 (Current breakout level)
Stop Loss (SL): ₹214.00 (Weekly close basis / below structural support)
Target 1: ₹300.00 (Psychological & Analyst Consensus)
Target 2: ₹355.00 (All-Time High retest)
Risk/Reward Ratio: ~1:2.8
Technical Analysis
Support Rebound: The stock has successfully defended the ₹210–₹220 horizontal support zone, which acted as a major resistance-turned-support from mid-2025.
Momentum Shift: Today's 5% Upper Circuit hit at ₹249.80, accompanied by a spike in volume, signals the end of a 3-month correction/accumulation phase.
Trend Confirmation: The price has reclaimed the 20-week EMA, shifting the medium-term bias back to bullish.
RSI Recovery: RSI is turning up from the 40-level floor, suggesting the "oversold" energy is being replaced by fresh buying interest.
Fundamental Driver
The technical move is backed by the company's Q2 FY26 performance (highest-ever quarterly income of ₹226 Cr) and a massive ₹1,500 Cr order book. The recent licensing for high-energy explosives provides the long-term thematic tailwind for the Aerospace & Defense sector.

Kalyan Jewellers Bullish SetupKalyan Jewellers
F&O Segment Stock
The stock fell almost 50% from its high of about ₹783 in September 2024. But now it's finding good support, building a base, and moving inside a parallel channel. For the past year, it's been stuck in a range—which usually means a bigger move is getting ready (could be a channel, triangle, or some other pattern).
Here's why I'm positive about it:
It's holding strong at the channel's lower support line.
It's sitting right on key moving averages (EMA support).
There was a big jump in trading volume near the support zone, which shows real buyers stepping in.
The chart shows a few resistance levels above—these can become price targets if the stock breaks out.
For safety, keep your stop loss at the previous major low for capital protection.
Trade wisely.

RR KABEL : Breakout Soon Candidate NSE:RRKABEL
🔹 Technical View
Strong recovery from ₹900 zone
Price testing major resistance at ₹1,500–1,510
Above ₹1,510 (weekly close): Breakout → ₹1,650–1,800
Support: ₹1,380–1,400
Structure turning higher high–higher low → bullish bias
🔹 Fundamental Snapshot
Strong brand in wires & cables
Consistent growth, improving margins
Beneficiary of housing, infra & electrification demand
🔹 Outlook
Above ₹1,510: Momentum trade active
Below ₹1,380: Consolidation risk
Medium–Long term: Structurally bullish
Disclaimer:
This content is shared strictly for educational and informational purposes.
We are not SEBI-registered investment advisors or analysts.
The views expressed are personal opinions, based on publicly available data and market observations.
Please consult a SEBI-registered investment advisor before taking any investment or trading decisions. Any actions taken based on this
content are entirely at your own risk and responsibility.
Trade Secrets By Pratik

KEI : Strong Business, Breakout Loading..??NSE:KEI
🔹 Technical Analysis
Price approaching long-term falling trendline
Break & sustain above ₹4,300 → bullish breakout confirmation
Resistance: ₹4,300–4,350
Support: ₹3,790
Above ₹4,300 → ₹4,600–4,900 possible
Below ₹3,790 → consolidation / pullback risk
🔹 Fundamental Snapshot
Strong player in cables & wires
Consistent revenue & profit growth
Healthy ROE, strong execution track record
Beneficiary of power, infra & real estate capex
🔹 Future Growth Outlook
Demand tailwinds from:
Power transmission
Renewables
Infrastructure push
Capacity expansion supports long-term growth
Structurally bullish business
🔹 View
Short term: Breakout watch above ₹4,300
Medium–Long term: Bullish on dips
Risk: Failure near trendline → range-bound move
==============
⚠️ Disclaimer:
==============
This content is shared strictly for educational and informational purposes.
We are not SEBI-registered investment advisors or analysts.
The views expressed are personal opinions, based on publicly available data and market observations.
Please consult a SEBI-registered investment advisor before taking any investment or trading decisions.
Any actions taken based on this content are entirely at your own risk and responsibility.
========================
Trade Secrets By Pratik
========================

NIFTY Intraday Trade Setup For 22 Dec 2025NIFTY Intraday Trade Setup For 22 Dec 2025
NIFTY has closed on a positive note last day. Consecutive 4 pinbars have formed in weekly TF. A good consolidation near ATH. Now we have zones marked for the next leg of move. 26400 and 25700 are key levels for any directional move either side. It is simply sideways inside this range.
Above 25060 index will be bullish in intraday and 25890 is the downside gateway. Plan trades on 15 Min candle close on intraday levels.
26250 and 25800 zone will be intraday resistance and support respectively.
I am Not SEBI Registered
This is my personal analysis for my personal trading. Kindly consult your financial advisor before taking any actions based on this.

Nifty 50 spot 25966.40 by Daily Chart view - Weekly UpdateNifty 50 spot 25966.40 by Daily Chart view - Weekly Update
- Nifty has closed within Support Zone range upper end
- Support Zone remains steady at 25710 to 26010 for Nifty Index
- Resistance Zone stands firmly at 26200 to ATH 26325.80 for Nifty Index
- Volumes synced closely with avg traded quantity over the entire past weeks
- Falling Resistance Trendline Breakout in a steady making process by weekly closure

NIFTY50 – Short Term Support TradeNIFTY50 has been trading inside a falling channel for the last ~15 sessions, indicating controlled corrective price action.
Key Short-Term Support Zone:
25,780 – 25,835
Why this zone matters (Confluence):
0.50 Fibonacci retracement (50%)
Mid-point / 50% of the falling channel
Volume Area Low (VAL) – strong demand zone
Multiple tests without breakdown
Trade Plan (Short Term):
Buy near: 25,800 ±
Stop Loss: Below 25,720 (closing basis)
Breakdown below 25,720 invalidates the setup and may extend the corrective move.
As long as price holds above the support zone, buy on dips is favored within the channel.
Fibonacci + Structure + Volume = High-probability support.

Nifty 50 Analysis for Short and Long TermIn the video, few points that are discussed are :
Nifty 50 is sustaining on long term chart.
Nifty 50 is sideways to bearish on short term chart.
Check the past chart and control your emotions in short term up and down moves.

Nifty 50 Swing Trading setup - RRR 1:3Nifty swing trading setup analysis through Elliott wave Downside risk max 200 points target 600 point reaching possible on before 02/01/2026 maximum hold 2 weeks this setup useful for swing traders so go long at 25900-25800 Risk reward is good 1:3 Happy trading Journey

Nifty 50 spot 26046.95 by the Daily Chart viewNifty 50 spot 26046.95 by the Daily Chart view
- Support Zone is intact at 25710 to 26010 for Nifty Index
- Resistance Zone stands stable at 26200 to ATH 26325.80 for Nifty Index
- Volumes keeping stable under average traded quantity over past few days
- Falling Resistance Trendline Breakout attempts seem in the making process

Nifty 50 analysis for 11th December Nifty is bearish for me till we are below 26,000 on daily closing basis.
the view for tomorrow is sell on rise.
make sure to keep these charts levels marked on yours.

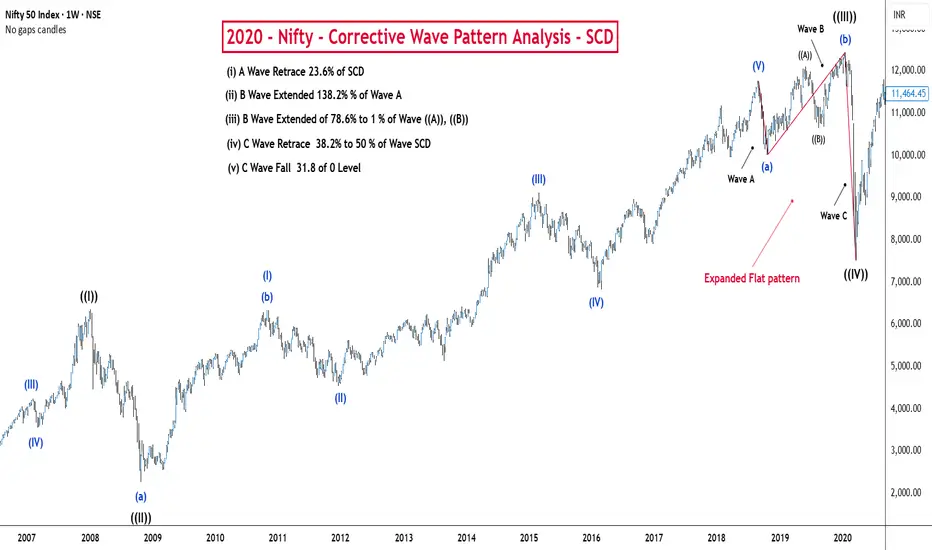
2008 Nifty 50 Crash - Analysis2008 Nifty 50 Crash Around 65% of 0 level complete study analysis of corrective wave pattern (Running Flat)

2020 Nifty Correction Analysis 2020 Corona Period Nifty 50 Fall at 38.2% of 0 level complete study analysis of corrective wave pattern (Expanded Flat)
SBI Buy - Range Breakout - Technical analysis#State Bank of India - #TechnicalAnalysis - #sbin
Price: 948.85 |
#Technical Setup
Pattern: #Swing trade setup with All-Time High (ATH) breakout confirmed on monthly chart. #Pullback/base formation in progress before next upward move.
Strategy: Conservative buy on breakout on candle-closing basis
Entry: Buy above 973.30
Stop Loss: 944.45
**Key Levels:**
- Target 1: 1,025.00
- Target 2: 1,055.80
- Grand Target: 1,144.00
- Support: 961.78 - 944.45
#Technical Observations
1. **Range & ATH Breakout** confirmed on monthly timeframe
2. Current pullback/base formation before next leg up
3. **EMA's aligned** confirming uptrend structure
4. **Hidden Divergence (HD)** formed in RSI - trend continuation pattern
5. Price action remains constructive on daily chart
⚠️ DISCLAIMER
**This is NOT investment advice.** This analysis is for educational purposes only. Stock trading involves substantial risk of loss. Past performance and technical patterns do not guarantee future results. Always conduct your own research and consult a SEBI-registered financial advisor before making any investment decisions. The author assumes no responsibility for trading losses incurred.

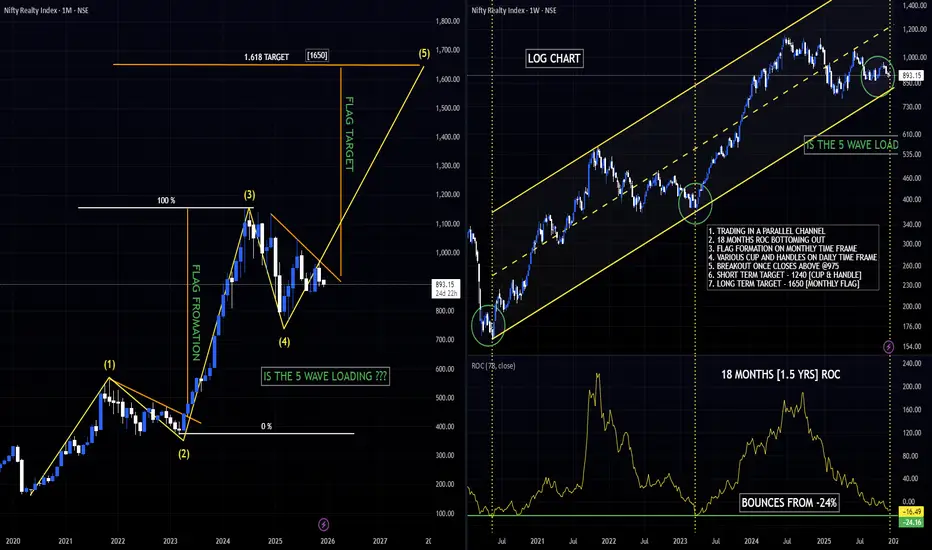
NIFTY REALTY [CNXREALTY] ABOUT TO GIVE THE BIGGEST RALLY?Technical Setup 🚀
1. Trading in a parallel channel
2. 18-month ROC bottoming out
3. Flag formation on the monthly time frame
4. Multiple cup-and-handle patterns on the daily time frame
5. Breakout expected once it closes above ₹975
6. Short-term target: ₹1,240 (Cup & Handle)
7. Long-term target: ₹1,650 (Monthly Flag)
Feel free to share your thoughts in the comments!
Not SEBI-registered ⏐ All views are personal ⏐ Not investment advice
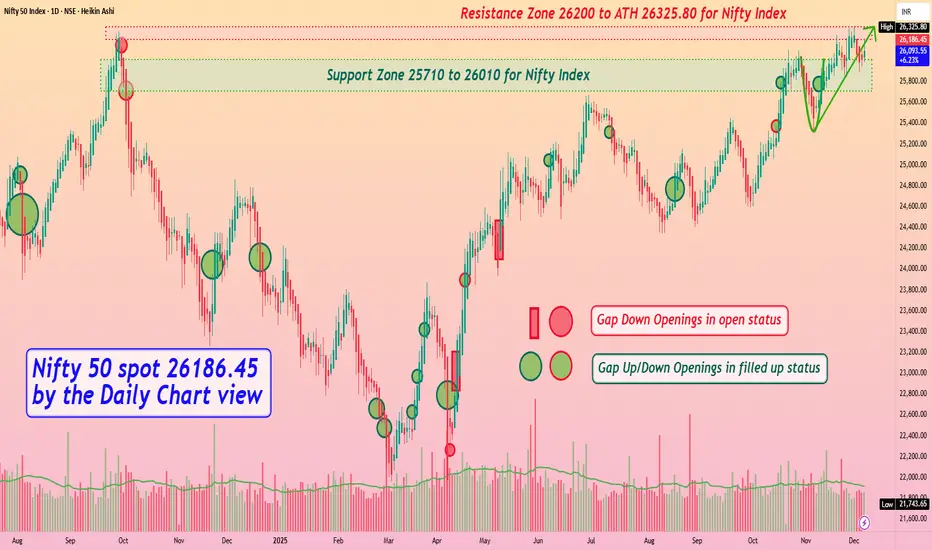
Nifty 50 spot 26186.45 by Daily Chart view - Weekly updateNifty 50 spot 26186.45 by Daily Chart view - Weekly update
- Support Zone 25710 to 26010 for Nifty Index
- Resistance Zone 26235 to ATH 26310.45 for Nifty Index
- Anticipate the subdued Bullish momentum to continue for Nifty 50
- Moreso Geo-Political tariff tricklers with certain Domestic factors creating weakness
SRF LTD - Short term Investment#SRF Limited - Technical Analysis
Current Price: 2,927.30
Quick Overview
Strategy: Short to Long Term Investment
Pattern: Multi-year consolidation breakout (Jan'21-Feb'25) with successful retest
#Technical Setup
✅ Long Consolidation Breakout & Retest - 4-year base broken
✅ Buy on Dips - Current correction = opportunity
✅ Sorted EMAs - All moving averages bullish
✅ Higher Highs - Clean uptrend structure
#Key Levels
Support:
- 2,838 (Immediate)
- 2,720 (Strong)
- 2,400 (Major - Weekly SL)
Targets:
- T1: 3,163
- T2: 3,472
- T3: 4,049
Entry Zones:
- Primary: 2,850 - 2,950 (Current)
- Secondary: 2,720 - 2,800 (on dips)
Risk-Reward: 1:2.3 (to final target)
#Strategy - Build positions in tranches during dips. Hold for short term for optimal returns. Book partial at ₹3,163, hold core for higher targets.
Disclaimer: For educational purposes only. Not investment advice. Markets are subject to risks. Consult a SEBI-registered advisor before investing. Past performance doesn't guarantee future results.
#SRFLimited #LongTermInvesting #BreakoutTrading #TechnicalAnalysis #NSE #ChemicalStocks #PatiencePaysPremium #IndianStockMarket #PositionalTrading

Indian Metals & Ferro Alloys - Buy - Swing Trading#Indian Metals & Ferro Alloys Ltd - #Swing Trade Setup
Current Price: 1,348.10
Technical Setup
Swing Trade Configuration:
✅ **All-Time High Breakout** - Stock has broken out from its previous ATH
✅ **Sorted EMAs** - Moving averages aligned in bullish formation
✅ **Consolidation Above ATH** - Price sustaining above breakout zone
✅ **Range Breakout** - Successfully broken and retested key resistance
Key Observation
Accumulation After ATH Breakout & Range Breakout After Retest
The stock is showing classic post-breakout behavior with accumulation building above the all-time high. The successful retest of the breakout level (962- 1,049 zone) has provided an excellent entry opportunity for swing traders.
Price Targets
Target 1: 1,418
Target 2: 1,498
Target 3: 1,614
Target 4: 1,829
Stop Loss: Below 1,049
Disclaimer: This analysis is for educational purposes only and should not be considered as financial advice. Trading and investing in stocks involves risk. Please conduct your own research or consult with a SEBI-registered financial advisor before making any investment decisions. Past performance is not indicative of future results.
#SwingTrading #StockMarket #TechnicalAnalysis #IndianStocks #BreakoutTrading #NSE #RetestOpportunity #TrendIsYourFriend #IMFA #MetalStocks
