NIFTY - Breakdown OR Support...Nifty is third time at it's channel support line (Lower Channel Level). Weekly close below it will confirm breakdown.
Nifty's next two support after breakdown are marked with green lines.
Disclaimer: This is for demonstration and educational purpose only. This is not buying or selling recommendations. I am not SEBI registered. Please consult your financial advisor before taking any trade.
NIFTY

NIFTY Intraday Trade Setup For 24 Feb 2025NIFTY Intraday Trade Setup For 24 Feb 2025
Bullish-Above 22850
Invalid-Below 22800
T- 23050
Bearish-Below 22720
Invalid-Above 22770
T- 22390
NIFTY has closed on slight bearish note with 0.58% cut last week. Index has been trading below 50 EMA in daily TF since last few months. Till it is trading below 50 EMA, overall sentiment will be sell on rise. To check bullish reversal last swing high will be important for consideration. As of now 23850 is the last swing high. Since last 4 sessions index has been descending at 22720.. Breakdown can trigger a move towards 22390.
Coming to Monday's trade setup, if index opens flat and a 15 Min candle closes above 22850 then we will long for the target of 23050.
For selling we need a 15 Min candle close below 22720. T- 22390.
In case of a big gap up/down, wait till 10 o'clock and mark the high and low of the trading range (5MIN). Trade on this range breakout.
==========
I am Not SEBI Registered
This is my personal analysis for my personal trading. Kindly consult your financial advisor before taking any actions based on this.

Nifty 50 spot 22795.90 by the Daily Chart viewNifty 50 spot 22795.90 by the Daily Chart view
- Nifty 50 Index 22775 to 22950 Support Band is yet sustained
- Long shot deep Support Zone seen at 22125 to 22350 which for now seems bit (un)likely by current technical chart status setup
- Just a flag to highlight : Nifty Index had dipped up to 22720 in recent past few days and similar levels was Resistance Level in April 2024 for 23K Index target
- Few of the Gap Ups and Gap Down openings, yet are remaining to get closed and filled in below the Old Long Shot Support Zone at 22125 to 22350 for Nifty Index levels

"Analyzing Nifty 50: Support, Resistance, and Trade Insights"Let's take a look at the Nifty 50 chart to analyze current support and resistance levels, and whether it's a good time to consider a bullish trade or if the market might drop further.
Currently, the Nifty 50 is showing a downtrend, forming lower highs and lower lows. This suggests that the market is struggling. However, there is a bottom trend line that supports the index quite well. Despite this, recent heavy selling by Foreign Institutional Investors (FIIs) means we haven’t seen a clear reversal pattern yet. Right now, the market is consolidating near this trend line.
For the Nifty to turn bullish, we would need to see a strong buying moment . We hope the index doesn’t fall below this trend line, but if it does, we could see a drop of several hundred points.
At this point, it might be wise to hold off on making any trades until we have clearer confirmation of market direction. For those considering a bullish position, a sensible stop-loss would be below 22,700 .
Please remember, this is for educational purposes only. Make sure to do your own analysis before making any trades and don't just follow someone else's advice blindly.

Nifty laying traps... another one for sellers...Hello Traders!
The market is constantly trapping sellers without moving to the downside. Right now, nothing in draw on liquidity is obvious. It, frankly, can go either ways . And what does it mean when we can frame both sides of market using ICT concepts? It means that we have LOW PROBABILITY conditions . I'm sitting on the sidelines until the market gains clarity, favouring buyside delivery.
As long as the invalidation low of 22725 holds, my bias would remain bullish . Once that low is taken, I'm not interested in price and would wait for the market to provide more info.
When it looks that it can go either ways, the market structure gets filthy and PRECISION leaves the chat. WAIT FOR MORE CLARITY . Or gamble . It's absolutely your choice .
Have a safe trading day.
GLGT.

Nifty ready to move higher...Hello traders!
The market delivered exactly as we had expected for yesterday's trading. I've mentioned in the video idea what is to be expected for today's trading.
Not financial advice.
GLGT.

Sit STILL today! Let the GAMBLERS sacrifice themselves to LUCK.Hello traders!
Hope you find this video analysis helpful.
Not financial advice.
GLGT.

Nifty 50 Index spot 22929.25 by Monthly Chart viewNifty 50 Index spot 22929.25 by Monthly Chart view
- Nifty 50 Index trending along the Rising Support Trendline 4th time over since March 2020.
- Support point starting March 2020, next in March 2023 followed in Nov 2023 and now in Feb 2025.
- *What can we anticipate and can we hope for some upside reversal from here ????*

Pulling the Elephant by the tail...Hello traders!
Sellside has been delivered... Any shorts now are in grave jeopardy... Chasing the market at this point is like pulling the ELEPHANT by the tail and expecting it to get pulled...
In short, enjoy the weekend now and kill all short positions... Sellers in jeopardy for the last hour of trading... Market repricing to 22922 and above.
GLGT.
Not financial advice....

Nifty 50 spot 22929.25 by the Daily Chart viewNifty 50 spot 22929.25 by the Daily Chart view
- Just an FYI to note, for the current status of the Nifty 50 Index Daily Closure
- Nifty 50 Index 22775 to 22950 Support Band is yet sustained and nothing more to quote

Nifty about to TRAP longs... Bullish? Think AGAIN!Hello traders!
I'm looking at equal lows/sellside as the draw. My narrative is that we would take out any longs remaining with BUYSIDE at 23144.70 .
If we gap up above buyside, which is what I expect, it would be an easy day for shorts.
If we gap down, we may see a rush up to buyside and then take the move forward to SELLSIDE at 22786.90 .
But whatever the gap scenario is, my draw remains towards 22786.90...
GLGT!
Not financial advice.

Nifty 50 spot 22985.25 by the Daily Chart viewNifty 50 spot 22985.25 by the Daily Chart view
- Sustained Support Zone for Nifty 50 Index 22775 to 22950 levels
- Will the Support Zone pass the 2nd retest after 1st test done on 27-January-2025
- Let's hope for the best to happen and look forward to see how things unfold going ahead

NIFTY 50 I Falling Wedge Pattern + Bulllish Divergence Nifty 50 Index is currently trading within a very important zone in simple words called area of interest Usually consisting of demand or supply zone. This level has acted as a solid base for the index.
The NIFTY 50 index presents a promising opportunity to initiate long positions at these levels (CMP23,000), Aligning well with the risk reward ratio and making it a favourable entry point for traders looking for Taking advantage of the upcoming trend.
The index has shown a pattern of forming lower highs and lower lows, which indicates a downtrend. However, the Relative Strength Index (RSI) is showing a contrasting pattern of higher highs and higher lows. This divergence between price action and RSI suggests a potential shift in momentum and a possibility of a short covering rally.
Adding to this I see a falling wedge pattern which is a bullish signal suggesting an upward price movement which typically appears in a downtrend and often seen as a bullish Reversal pattern.
The analysis holds true when price close above 23,824 - daily timeframe.
While entering on current levels also has good opportunity of risk reward ratio, I suggest looking for a pin bar candle on today's close will Confirm Market picking support from the levels .
Conversely if nifty 50 index continues to recover, We could see a push towards 24,200 and 24,800 Which represent key Resistance areas. A good breakout above these levels likely signal Continuation of bullish trends in the indian markets.

Tata consumer products ltdTata Consumer Products Ltd. has an average target of 1152.17. The consensus estimate represents an upside of 12.83% from the last price of 1021.20. View 22 reports from 7 analysts offering long-term price targets for Tata Consumer Products Ltd..
For the quarter, Revenue from operations grew by 9% (8% in constant currency) as compared to corresponding quarter of the previous year, with strong performance in India business, which grew 10%. Profit before exceptional items and tax at Rs 509 Crores is higher by12%.

Nifty 50 23559.95 Daily Chart view - Update on 02-Feb-2025Nifty 50 spot 23559.95 by the Daily Chart view
- Resistance Zone 23900 to 23975 Index level
- Resistance Zone 23375 to 23460 turned to Support Zone still been sustained
- Nifty Daily Chart view of 02-February-2025

NIFTY FRIDAY TRADE PLANFriday trade plan based on hourly chart.
NIFTY is in Impulse diagonal abcde, with e in progress.
Making Higher High Higher Low
Bullish Structure
Gap up Sustained
RBI Meet repo rate announcement 7 Feb 10 am. Can be volatile keep, trade cautiously.
Disclaimer: I am not SEBI registered analyst. These are not buy/sell recommendations. Trading/investing can be very risky, reach out to a authorised consultant before making any decisions. I do not claim/promise any profits.

NIFTYBANK FRIDAY TRADE PLAN Friday trade plan based on hourly chart.
Banknifty in Impulse diagonal abcde, with e in progress.
Making Higher High
Higher Low
Bullish Structure
Gap up Sustained
RBI Meet repo rate announcement 7 Feb 10 am. Can be volatile keep, trade cautiously.
Disclaimer: I am not SEBI registered analyst. These are not buy/sell recommendations. Trading/investing can be very risky, reach out to a authorised consultant before making any decisions. I do not claim/promise any profits.


NIFTY Intraday Trade Setup For 5 Feb 2025NIFTY Intraday Trade Setup For 5 Feb 2025
Bullish-Above 23770
Invalid-Below 23720
T- 24050
Bearish-Below 23500
Invalid-Above 23550
T- 23250
NIFTY has closed on a bullish note with 1.62% gain today. It has closed above 50 EMA in daily TF after almost 2 months. Index has consolidated within small range for last 20 days, it has started to rise again but I wont turn bullish until it gives a pullback and then start to make a bullish price structure in daily TF. Since it has closed above EMA bullishness may continue tomorrow above 23770.
Coming to Monday's trade setup, if index opens flat and a 15 Min candle closes above 23770 then we will long for the target of 24050.
For selling we need a 15 Min candle close below 23500. T- 23245.
In case of a big gap up/down, wait till 10 o'clock and mark the high and low of the trading range (5MIN). Trade on this range breakout.
==========
I am Not SEBI Registered
This is my personal analysis for my personal trading. Kindly consult your financial advisor before taking any actions based on this.

united brevages (ubl)united brevages (ubl)
Swing Trade
Stock Name - United Beverages
Chart - Dailly O
CMP2295.15
Buy 2200-2220
■ SL-2100 X
Target
2600+
Time Duration: 3-4 momths
Potential Return 17%
Keep an eye
#UBL
SOON
In June 2021, Heineken N.V. bought out Mallya's 15% stake in United Breweries Limited for ₹5,825 crores (US$730 million) from the Debt Recovery Tribunal. With this, Heineken's stake in the company increased to 61.5%, taking control of United Breweries.

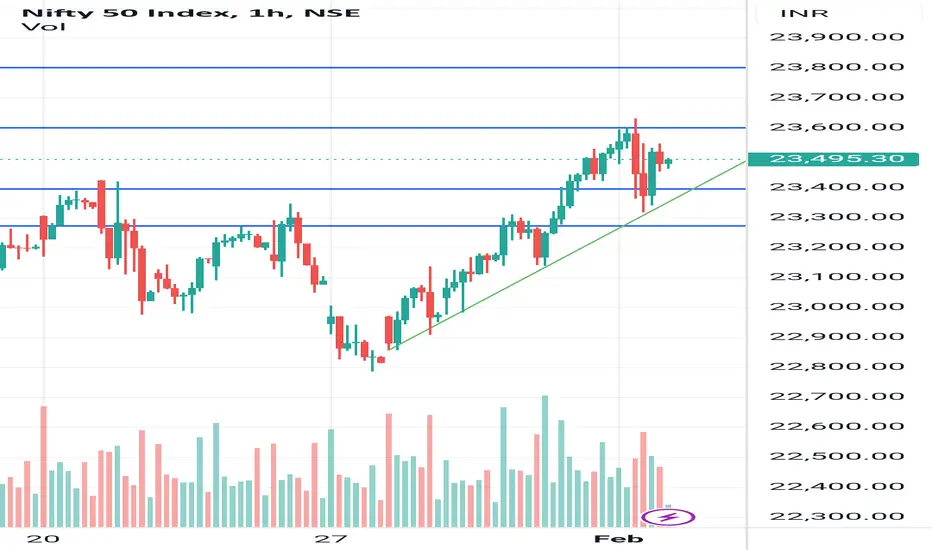
Nifty analysis for Monday trade setup 🛑 Stoploss is your seatbelt 🪢 buckle up always to protect your hard 💰 earned capital. 🧿
Nifty short term trend is bullish if sustain above 📈 green trend line.
1. Nifty sustain and hold 23600 level we can easily catch 23800 level. ✈️
2. If it breaks trend line and 23300 we may see 23150-23100. 📉
3. Can not predict clear direction between 23300-23600.
Nifty 50 spot 23482.15 by the Daily Chart viewNifty 50 spot 23482.15 by the Daily Chart view
- Nifty 50 Index 22775 to 22950 Support Band is yet sustained
- Resistance Zone 23375 to 23460 to turn in as a probable Support Zone

Nifty 50 spot 23507.50 by the Daily Chart view*Just an FYI to share on the Nifty 50 Index Chart shared last week*
*Nifty 50 spot 23507.50 by the Daily Chart view*
- Nifty 50 Index 22775 to 22950 Support Zone has been sustained by Daily upwards closure above it
