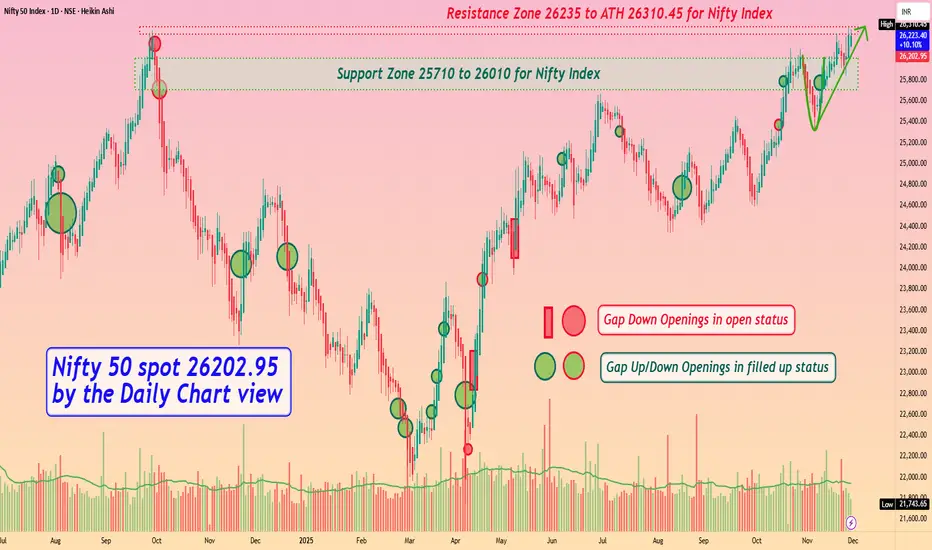
Nifty 50 spot 26202.95 by Daily Chart view - Weekly updateNifty 50 spot 26202.95 by Daily Chart view - Weekly update
- Support Zone 25710 to 26010 for Nifty Index
- Resistance Zone 26235 to ATH 26310.45 for Nifty Index
- Finally after 14 months Nifty 50 hit New Lifetime High Milestone 26310.45
- Hope to see Bullish momentum continue for Nifty 50 with positive expectation
NIFTY
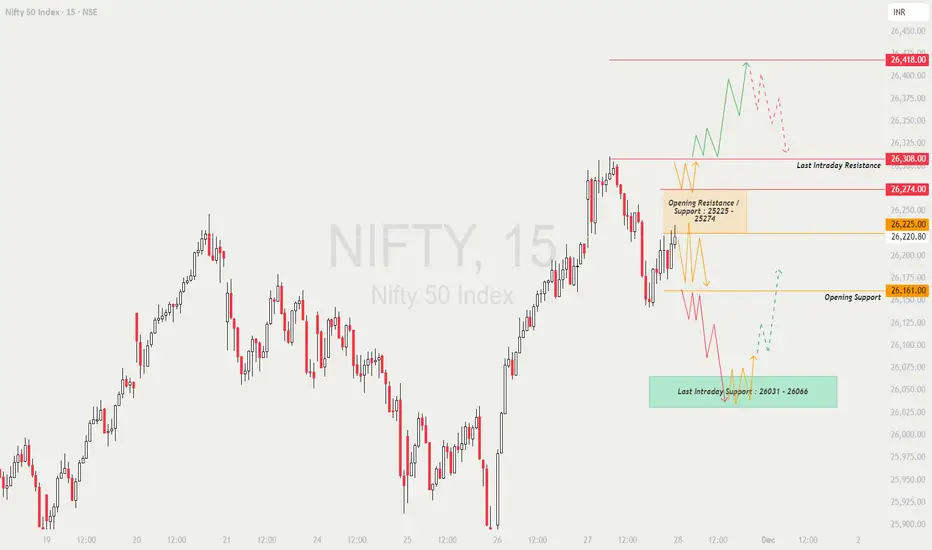
NIFTY : Trading levels and Plan for 28-Nov-2025📊 NIFTY TRADING PLAN — 28 NOV 2025
Nifty closed around 26,220, after bouncing strongly from lower levels and now sitting just below an important Opening Resistance / Support Zone (26,225–26,274).
The market is positioned between major overhead resistance and key intraday support.
This increases the importance of the opening direction.
Key Intraday Levels
🟧 Opening Resistance / Support Zone: 26,225 – 26,274
🟥 Last Intraday Resistance: 26,308
🟥 Profit Booking Zone: 26,418
🟩 Opening Support: 26,161
🟩 Last Intraday Support: 26,031 – 26,066
🟢 SCENARIO 1 — GAP-UP OPENING (100+ Points)
If Nifty opens around 26,300–26,350, it directly enters the resistance territory.
If price sustains ABOVE 26,308 for 10–15 minutes →
⭐ Expect bullish continuation toward → 26,360 → 26,395 → 26,418
If Nifty rejects 26,308 with sharp wicks →
Expect pullback toward → 26,274 → 26,225
Avoid long entries immediately at open — gap-ups near resistance can cause bull traps.
Best long setup = Breakout → Retest above 26,308 → Continuation.
📘 Educational Note:
Resistance-based gap-ups often create volatility. Always wait for confirmation candles, not emotional entries.
🟧 SCENARIO 2 — FLAT OPENING (26,200–26,250 Range)
A flat open places Nifty inside or just below the Opening Resistance / Support Zone.
A breakout above 26,274 →
Targets → 26,308 → 26,360 → 26,418
Failure to sustain above the zone may drag price back to 26,161.
Inside the 26,225–26,274 zone →
No high-probability trade. Avoid jumping into noise.
Best trades:
✔️ Breakout retest above 26,274
✔️ Breakdown below 26,161
✔️ Long from Last Intraday Support 26,031–26,066 (strong bounce zone)
💡 Educational Tip:
Flat openings provide the most reliable trend insight through the first 15-min candle. Let price choose direction — don’t force trades.
🔻 SCENARIO 3 — GAP-DOWN OPENING (100+ Points)
A gap-down around 26,080–26,120 brings Nifty near the Opening Support (26,161) area.
If price rejects 26,161 with bullish wick →
Reversal targets → 26,200 → 26,225 → 26,274
If price breaks 26,161 decisively →
Price will slide quickly toward the big support → 26,031–26,066
A strong bounce at 26,031–26,066 offers an attractive long opportunity.
If 26,031 breaks with momentum →
Expect downside extension → 25,980 → 25,940
📘 Educational Note:
Gap-downs into support often give excellent reversal trades — but NEVER without confirmation.
Watch for higher lows or bullish engulfing candles.
💼 RISK MANAGEMENT TIPS FOR OPTION TRADERS 💡
Avoid the first 5 minutes — large gap openings often reverse quickly.
Use ATM or ITM options for directional momentum.
NEVER average a losing option trade.
Use fixed SL based on structure, not on premium.
When VIX is low → prefer option buying.
When VIX is high → hedged option selling is safer.
Book partial profits near resistance zones like 26,308 & 26,418.
⚠️ Golden Rule:
Protect your capital first — good opportunities always come after clarity.
📌 SUMMARY
Bullish Above → 26,274
Targets → 26,308 → 26,360 → 26,418
Bearish Below → 26,161
Targets → 26,120 → 26,066 → 26,031 → 25,980
High-Risk Zones:
🟧 26,225–26,274 (Opening whipsaw zone)
🟥 26,308–26,418 (Profit booking region)
🧾 CONCLUSION
Nifty is approaching a strong overhead resistance zone, and the opening candle will decide whether we get a breakout continuation or a pullback day.
The highest-probability trades will come from:
✔️ Breakout retest above 26,274
✔️ Rejection / reversal at 26,308
✔️ Bounce from 26,031–26,066
✔️ Breakdown below 26,161 for momentum shorts
Trade only clean structures — avoid noise inside the middle consolidation zone.
⚠️ DISCLAIMER
I am not a SEBI-registered analyst.
This analysis is meant only for educational purposes.
Please consult a certified financial advisor before trading or investing.
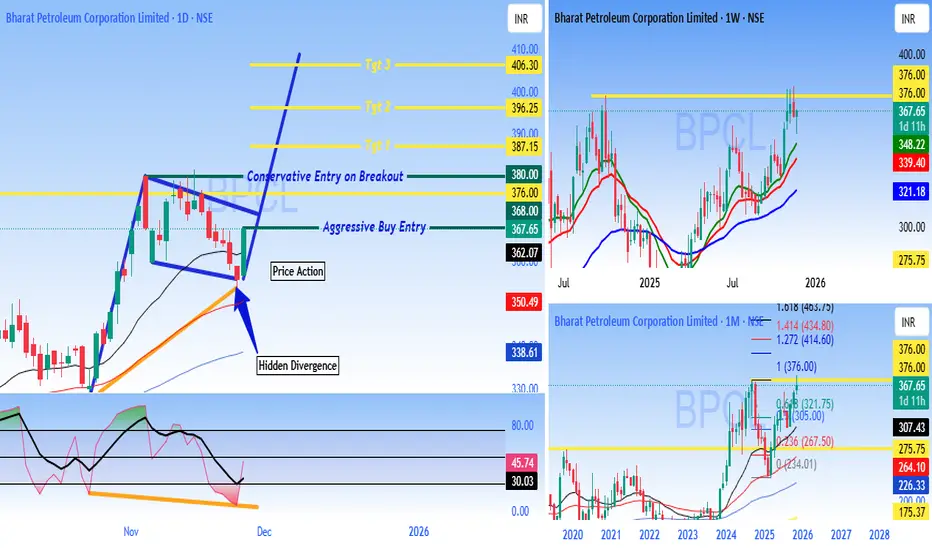
BPCL - Buy - ATH breakout - Technical Analysis#Bharat Petroleum Corporation Limited (BPCL) - #Technical Analysis Report
Current Price: 356.80 (Daily)
Multi-Timeframe Technical Analysis:
BPCL is displaying strong bullish momentum across multiple timeframes with a compelling technical setup featuring **Hidden Divergence** and a clear breakout structure on the daily chart.
Daily Chart Analysis - Key Technical Patterns:
1. Hidden Divergence Confirmed
- Classic Trend continuation signal indicating the uptrend is likely to resume with strength
2. Breakout Structure
- Stock has broken out from a consolidation zone around ₹362
- Currently trading above key resistance turned support
3. Trade Entry:
Aggressive Buy Entry:
As #Priceaction has formed already for traders who want immediate entry Buy will be active above 367.65
Conservative Entry on Breakout:
Initiate trades on candle close above 380
Price Targets
Target 1: 387.15
Target 2: 396.25
Target 3: 406.30
These targets are based on Fibonacci extensions and resistance zones from the pattern structure.
Weekly & Monthly Chart Context
Weekly Chart Shows:
- Strong uptrend since 2024 lows
- Stock trading near multi-year highs around 367-370 zone
- Higher highs and higher lows pattern intact
- Moving averages well-aligned in bullish configuration
Monthly Chart Indicates:
- Long-term recovery from 2020-2023 correction phase
- Breaking out from multi-year resistance zone
- Potential for extended rally toward ₹376-400 zone
Momentum Indicators
- Hidden divergence on daily timeframe = Bullish continuation
- Price action showing strength above key moving averages
- Volume expansion on breakout candles (positive sign)
- RSI/Momentum indicators supporting the upward move
The combination of bullish patterns and momentum indicators suggests potential for continuation toward higher targets. Traders should maintain strict risk management and adjust positions based on price action at key levels.
DISCLAIMER
This analysis is for educational and informational purposes only and should NOT be considered as investment advice or a recommendation to buy, sell, or hold any securities - I am NOT a SEBI registered analyst or investment advisor - This is purely a technical analysis based on chart patterns, indicators, and price action - Past performance and technical patterns do not guarantee future results - Trading and investing in stocks involves substantial risk of loss and may not be suitable for all investors - Always conduct your own research, due diligence, and analysis before making any investment decisions - Consult with a qualified financial advisor before taking any investment positions - The author/analyst holds no responsibility for any profits or losses incurred based on this analysis - Risk management is crucial - never invest more than you can afford to lose - Stop losses are mandatory for capital protection - Markets can remain irrational longer than you can remain solvent
Trade/Invest at your own risk. DYOR (Do Your Own Research).
#BPCL #TechnicalAnalysis #StockMarket #NSE #IndianStocks #Trading #HiddenDivergence #Breakout #OilAndGas #PSU #ChartAnalysis #TradingView #SwingTrading #DayTrading #PriceAction #StockTrading #MarketAnalysis #OMC #EnergyStocks #BullishSetup
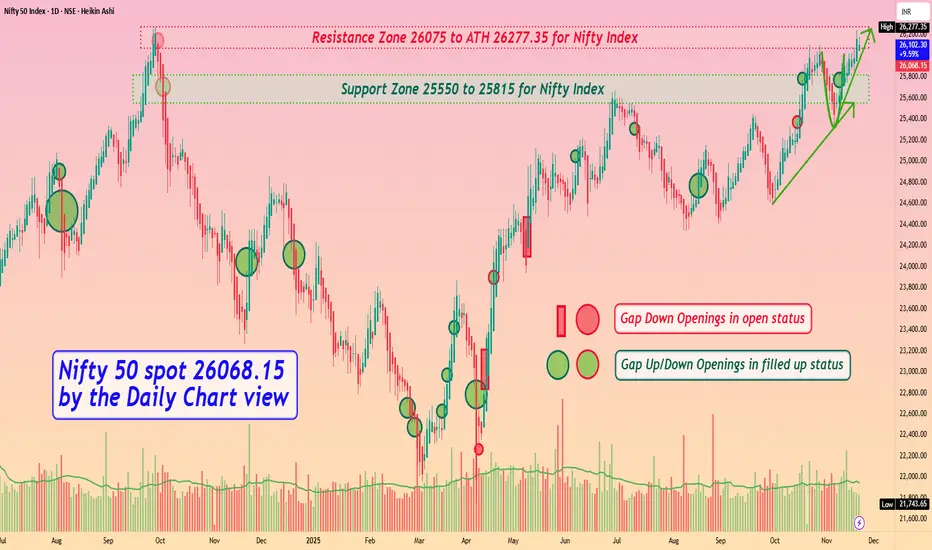
Nifty 50 spot 26068.15 by the Daily Chart view - Weekly updateNifty 50 spot 26068.15 by the Daily Chart view - Weekly update
- Support Zone 25550 to 25815 for Nifty Index
- Resistance Zone 26075 to ATH 26277.35 for Nifty Index
- Nifty keeping off to create ATH by Domestic and Geo Political events
- Bullish momentum intact but general Global paleness keeps New ATH distant
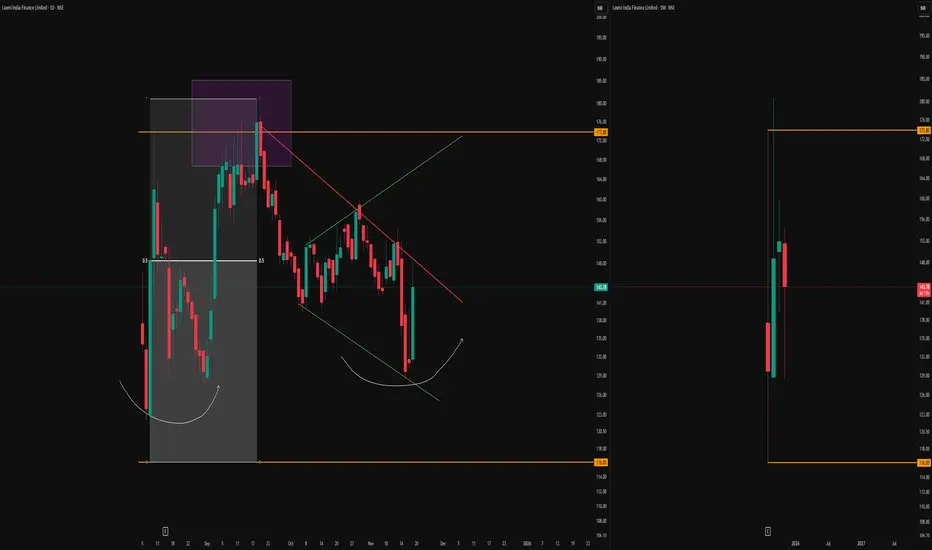
Multi-Timeframe Structure and Supply Observations-Green Broadening Pattern
A distinct broadening pattern is forming, mapped out by the green lines on the daily chart. This structure highlights expanding volatility, which often captures both swing highs and lows as price oscillates between opposing boundaries.
-Monthly High-Low Anchors
The orange horizontal lines represent the high and low of the first monthly candle, visible on the right—these serve as crucial long-term reference levels.
-Purple Box and Monthly Supply Manipulation
Up near the orange monthly resistance, the purple box marks a period of price interaction and ‘manipulation’ around the top supply. This box encapsulates a classic area where aggressive sellers and liquidity seekers converge, sometimes engineering fakeouts or squeezes before the real direction is chosen.
-Equilibrium and Rounded Higher Lows
Within the broadening pattern, a clear equilibrium zone is formed (represented by the midline drawn through the structure). This acts as a median for price oscillations and often becomes a pivot for both upward and downward moves. The two semi-circular white arcs on the left chart illustrate the emergence of higher lows
-Context from Monthly Timeframe
On the right, the monthly chart remains essential for framing all of the above
This analysis is solely observational and intended for educational purposes. No forecasts or trade signals are provided. Please exercise full discretion and undertake your own due diligence before making any trading decisions.
NIFTY KEY LEVELS FOR 19.11.2025NIFTY KEY LEVELS FOR 19.11.2025
Timeframe: 3 Minutes
If the candle stays above the pivot point, it is considered a bullish bias; if it remains below, it indicates a bearish bias. Price may reverse near Resistance 1 or Support 1. If it moves further, the next potential reversal zone is near Resistance 2 or Support 2. If these levels are also broken, we can expect the trend.
When a support or resistance level is broken, it often reverses its role; a broken resistance becomes the new support, and a broken support becomes the new resistance.
If the range(R2-S2) is narrow, the market may become volatile or trend strongly. If the range is wide, the market is more likely to remain sideways
please like and share my idea if you find it helpful
📢 Disclaimer
I am not a SEBI-registered financial adviser.
The information, views, and ideas shared here are purely for educational and informational purposes only. They are not intended as investment advice or a recommendation to buy, sell, or hold any financial instruments.
Please consult with your SEBI-registered financial advisor before making any trading or investment decisions.
Trading and investing in the stock market involves risk, and you should do your own research and analysis. You are solely responsible for any decisions made based on this research.

Bank Nifty Target 69000 for upcoming Year 69000 Namaskaram Investor
This is a long Term forecast, in which we will discuss about the furture for bank nifty in upcoming months. Off course all the explanation will be give in the video, So kindly watch that to understand my view. It will be available after an hour.

Nifty Breaks Key Support at 25920 — Bears Take the Wheel!Nifty has decisively broken below the crucial support zone at 25920, and price is currently holding under this level—an early sign that bearish momentum may continue. As long as 25975 remains unbroken on the upside, the short-term bias stays negative.
A potential short opportunity may emerge on retests or continued rejection below 25920, with price targets at:
TP1: 25850
TP2: 25800
This setup remains valid unless Nifty reclaims and sustains above 25975.
📌 Disclaimer:
This analysis is for educational purposes only and is not financial advice. Always manage risk and follow your trading plan.
Your feedback drives our content and keeps everyone trading smarter. Let’s make those pips together! 🚀
Happy Trading,
– The InvestPro Team

Deepak Fertilizer - Technical AnalysisDEEPAK FERTILISERS & PETROCHEMICALS CORPORATION LTD.
CMP:1,453.32
CHART OBSERVATIONS
Strong Historical Momentum: Stock showed powerful uptrend with 4 months of continuous momentum building base for next upside.
EMA Confirmation: Multiple EMAs sorted bullishly in both Monthly and Weekly timeframes
Higher Lows Pattern: Price forming higher lows indicating retracement / accumulation.
Trendline Support: Blue descending trendline acting as dynamic support.
Current Structure
Consolidation Phase: Stock consolidating in a defined range after significant rally
Breakout Setup: Price testing resistance of descending trendline - potential breakout candidate
KEY TECHNICAL LEVELS
Resistance Zones (Upside Targets)
- Target 1: 1,778.60
- Target 2: 2,020.60
- Target 3: 2,328.45
- Target 4: 2,668.30
Support Zone
- Accumulation Zone: 1,400 - 1,200 (highlighted in blue rectangle)
TRADING STRATEGY
Conservative Approach:
- Accumulate in parts within the blue zone (1,200 - 1,400)
- Conservative entry can be taken when trendline breaks or price action confirms
Aggressive Approach:
- Entry when 5% upmove is seen in stock price from current levels
- Breakout above descending trendline with volume confirmation
Risk Management
- Stop Loss: Close below 1,132 on weekly closing basis
- Position Sizing: Allocate 2-3% of portfolio per position
- Pyramiding: Add positions on dips within accumulation zone
Target Achievement Timeline
- T1 (1,778): Short to Medium term (3-6 months)
- T2-T4: Medium to Long term (6-18 months)
CONCLUSION
Deepak Fertilisers is displaying a healthy technical setup with strong foundational support from EMA structure across multiple timeframes. The current consolidation offers an attractive risk-reward opportunity for accumulation. Patient investors can build positions in parts, while momentum traders should wait for trendline breakout confirmation.
The stock has demonstrated robust momentum historically and appears to be building base for next leg of upside movement.
DISCLAIMER:
This analysis is for educational and informational purposes only and should not be construed as investment advice or a recommendation to buy, sell, or hold any securities.
- Past performance is not indicative of future results - Stock markets are subject to risks including loss of principal - The author is not a SEBI registered analyst/advisor
- This is a personal view based on technical analysis only - Investors are advised to consult with certified financial advisors before making investment decisions - The author does not guarantee accuracy of data or projections - Trading/Investing in securities is subject to market risks
#DEEPAKFERT #TechnicalAnalysis #StockMarket #NSE #FertilizerStocks #SwingTrading #PositionalTrading

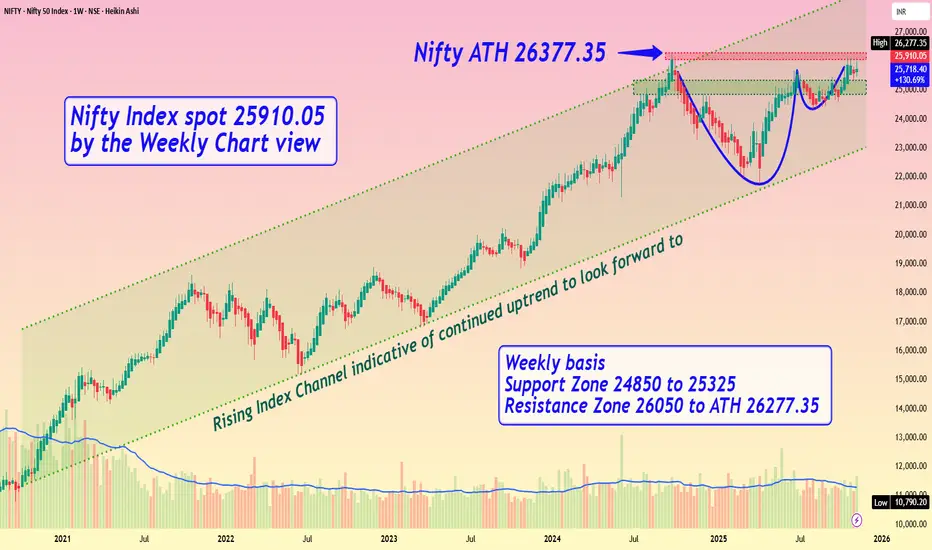
Nifty Index spot 25910.05 by the Weekly Chart viewNifty Index spot 25910.05 by the Weekly Chart view
- Weekly basis - Support Zone 24850 to 25325
- Weekly basis - Resistance Zone 26050 to ATH 26277.35
- Rising Index Channel indicative of continued uptrend to look forward to .....
- Bullish Cup and Handle pattern shows breakout expectation from Resistance Zone
Stop Trying to Recover Losses. Start Trying to Build ConsistencyHello Traders!
Every trader goes through losses. But what separates a struggling trader from a successful one is not the size of their wins, it’s what they focus on after a loss.
Most traders waste months trying to “get back” the money they lost.
But the truth is simple: the more you chase recovery, the more you lose.
Your real job is not to recover losses, it’s to build consistency.
1. Loss Recovery Creates Emotional Pressure
When you trade just to recover what you lost, you stop thinking logically.
You increase lot size, enter without confirmation, and ignore your plan.
This emotional pressure makes you take trades you would never take in a calm state.
Recovery trading doesn’t fix losses, it multiplies them.
2. Consistency Has No Ego
Consistency doesn’t care about your last loss or last win.
It’s about following the same rules every day, no matter what happened yesterday.
Small, controlled wins compound over time, and slowly replace every old loss.
Consistency creates stability. Stability creates clarity. Clarity creates profits.
3. When You Stop Chasing, You Start Thinking
You no longer rush entries, you wait for your setup.
You risk only what fits your plan, not what your emotions whisper.
You accept that losses are part of your business, not threats to your ego.
A calm mind sees opportunities a stressed mind can’t.
4. The Real Recovery Happens Naturally
When your focus shifts from recovering to improving, your trades automatically become better.
Consistency makes your equity curve smoother.
Slow, steady growth quietly replaces big losses without you forcing anything.
Professional traders don’t “recover”, they simply continue.
Rahul’s Tip:
Your next breakthrough won’t come from a big winning trade, it will come from a week where you followed your plan perfectly, even if the profits were small.
Consistency is your strongest weapon in trading. Use it.
Conclusion:
Stop fighting your past losses, they’re already gone.
Focus on building the habits that ensure you never repeat them again.
Recovery is temporary. Consistency is permanent.
If this post shifted your mindset, like it, share your thoughts in comments, and follow for more honest trading psychology lessons!
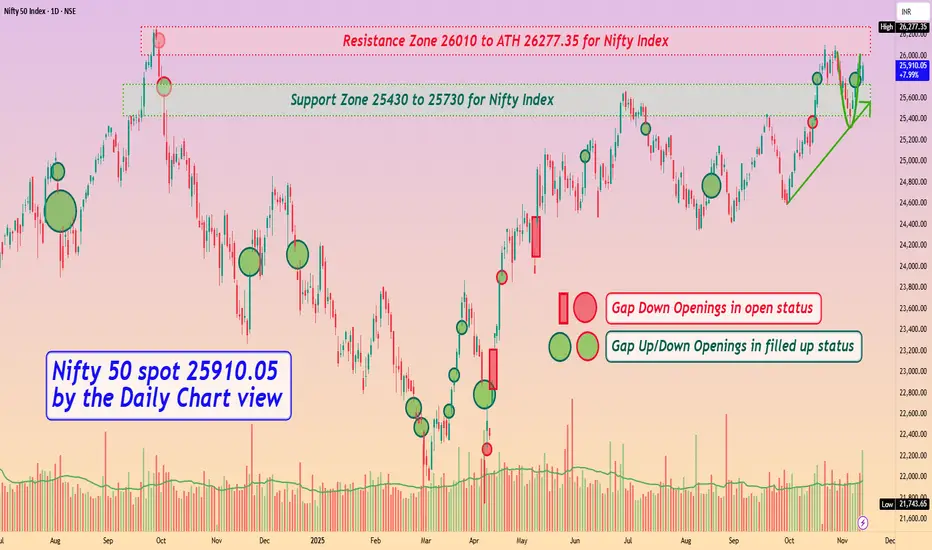
Nifty 50 spot 25910.05 by Daily Chart view - Weekly UpdateNifty 50 spot 25910.05 by Daily Chart view - Weekly Update
- Support Zone 25430 to 25730 for Nifty Index
- Resistance Zone 26010 to ATH 26277.35 for Nifty Index
- Rising Support Trendline seems respected by weekly positive closure
- Rounding Bottom Bullish momentum by Resistance Zone neckline seems sustained
- Nifty timidly shy from creating a New Lifetime High by crossing ATH final hurdle remains effectively elusive
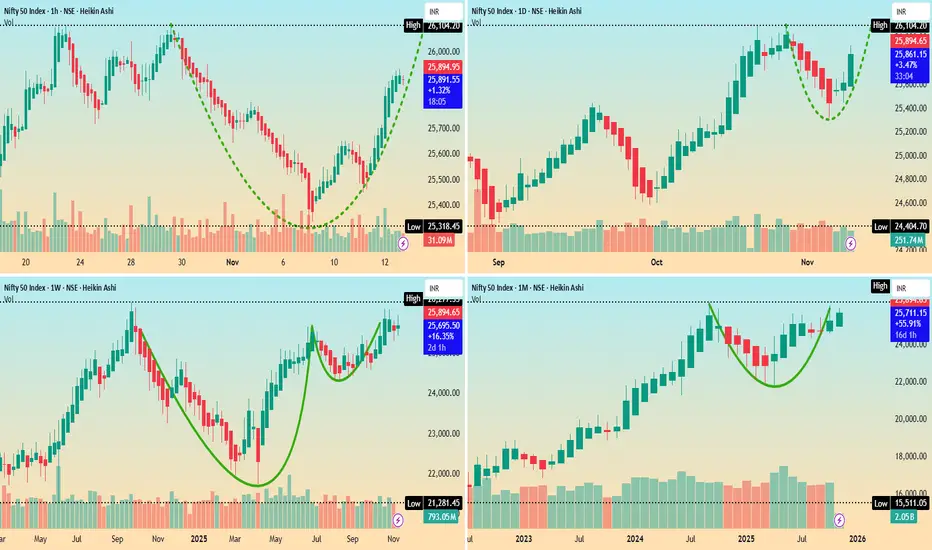
Nifty 50 Index spot 25890 Multi Timeframe viewsNifty 50 Index spot 25890 Multi Timeframe views
Major Timeframes showing Bullish Chart view by Hourly, Daily, Weekly and Monthly, so hope for the best to happen 🤞🏼😊
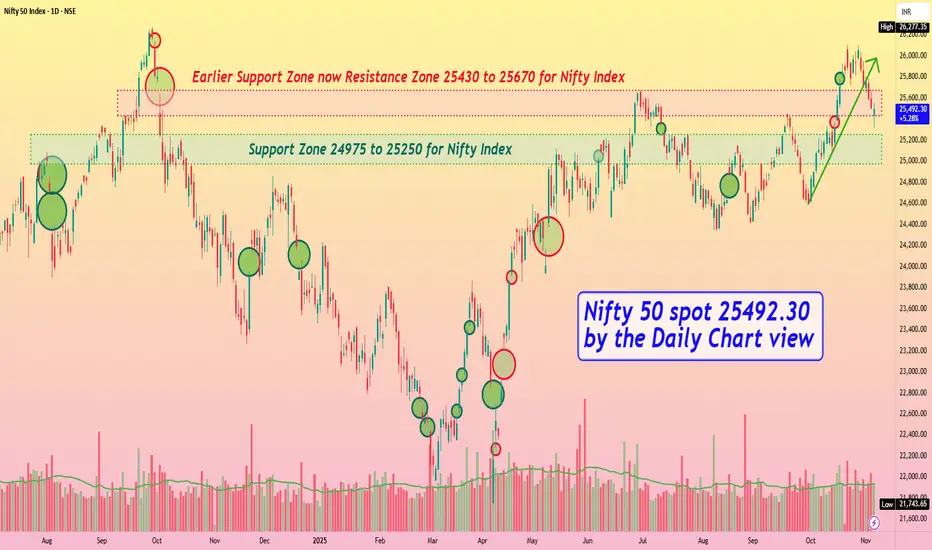
Nifty 50 spot 25492.30 by the Daily Chart view - Weekly updateNifty 50 spot 25492.30 by the Daily Chart view - Weekly update
- Support Zone 24975 to 25250 for Nifty Index
- Earlier Support Zone now Resistance Zone 25430 to 25670 for Nifty Index
- Rising Support Trendline Breakdown done basis the ongoing weak sentiments in general
- The final hurdle ATH remains elusive and Nifty keeps distinctly shy to create a New Lifetime High
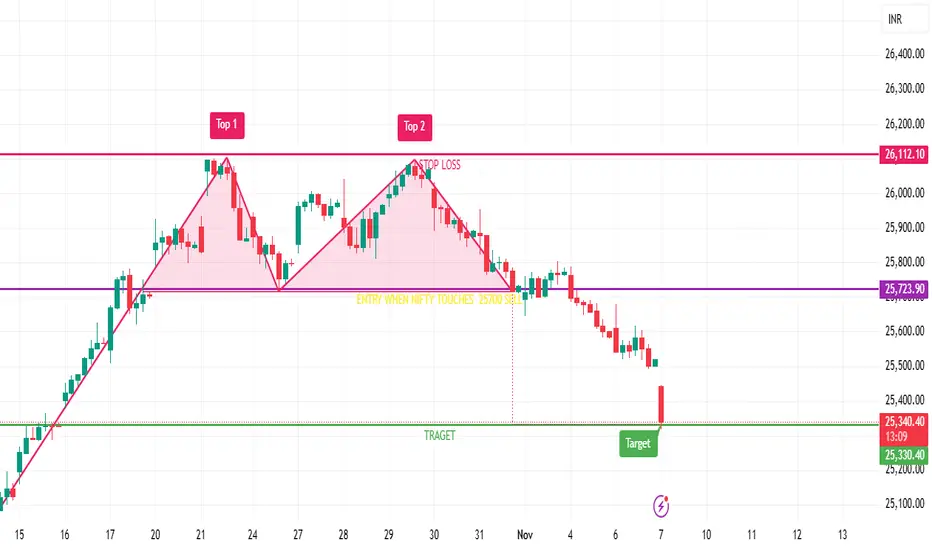
Nifty 1-Hour Chart – Double Top PatternThe trade has successfully reached the target levels.
🔹 Trade Recap
*Entry:** Sell near 25,700
Stop Loss:** 26,100
Target: 25,320 ✅ *Achieved*
🔹 Update
The double top breakdown played out as expected, and Nifty slipped toward the 25,300 zone after breaching the neckline near 25,700.
Traders are advised to **book profits** at current levels and **close short positions** as the target has been met.
Further direction will depend on whether Nifty sustains below 25,300 or shows signs of consolidation and reversal.
NIFTY Weekly OutlookNIFTY Weekly Outlook
NIFTY has closed almost flat but with bearish sentiment last week, ending at lows. 2 Consecutive rejection candles at 26100 has been formed in weekly TF. Hourly major swings are placed 26115 and 25690. Neutrally we should wait for breakout of any to plan the directional trade.
After a small pullback if index breaks 25690 then index will test 25100 zone as per Half Bat pattern.
By any chance if low of the current week does not break and breaks 26115 in the higher side, index will show double force move above 26115 to a new All Time High.
I am Not SEBI Registered
This is my personal analysis for my personal trading. Kindly consult your financial advisor before taking any actions based on this.

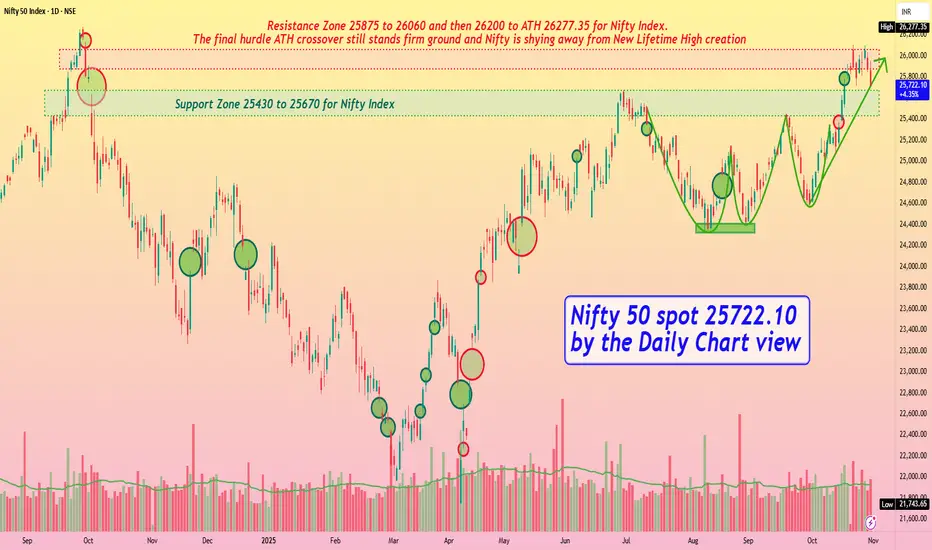
Nifty 50 spot 25722.10 by the Daily Chart view - Weekly UpdateNifty 50 spot 25722.10 by the Daily Chart view - Weekly Update
- Support Zone 25430 to 25670 for Nifty Index
- Rising Support Trendline seems in active mode but may be broken
- Nifty below Resistance Zone but taking rest tad above the Support Zone
- Resistance Zone 25875 to 26060 and then 26200 to ATH 26277.35 for Nifty Index
- Bullish Rounding Bottoms seems active but continued skepticism keeping the Nifty index weak
- The final hurdle ATH crossover still stands ground and Nifty shying away from New Lifetime High creation
Nifty 50 Analysis If Nifty breaks below the 25,673 zone, a downside move is likely. This could be a good opportunity to buy PE positions and capture potential profits.
• Support 1: 25,673
• Support 2: 25,454
• Resistance: 25,800
In my view, the market may continue to move lower as it recently made an all-time high (ATH) and faces multiple resistance levels.

NIFTY Intraday Trade Setup For 30 Oct 2025NIFTY Intraday Trade Setup For 30 Oct 2025
Bullish-Above 26110
Invalid-Below 26060
T- 26350
Bearish-Below 25920
Invalid-Above 25970
T- 25690
NIFTY has closed on a bullish note with 0.45% gain today. Index has been consolidating below 26100 since few days. Above 26110 index is all set for a fresh ATH. On a 15 Min candle close above 26110, plan a long for the target of 26345. 25900 zone can be a confluence zone. Plan a short below 25920 on 15 Min candle close, 25690 will be target.
In case of a big gap up/down, wait till 10 o'clock and mark the high and low of the trading range (5MIN). Trade on this range breakout.
==========
I am Not SEBI Registered
This is my personal analysis for my personal trading. Kindly consult your financial advisor before taking any actions based on this.

Daily analysis Nifty: 29/10/25Nifty is with a slight gap up, and the levels to be traded are shared in the video. Main bias is bullish, and for the bearish side, there is are cluster of supports to be more careful today.

NIFTY - Triple Demand Zone Rebound with Strong Volume📈 NIFTY 50 – Powerful Reversal from Triple Intraday Demand Zones 💪
Date: 28th Oct 2025
Spot Price: ₹25,936.20
🔹 Resistances: 26,048 / 26,160 / 26,280
🔹 Supports: 25,816 / 25,697 / 25,585
🔹 Intraday Demand Zones:
1️⃣ 25,868 – 25,814
2️⃣ 25,809 – 25,790
3️⃣ 25,763 – 25,737
🔑 Key Highlights
Nifty witnessed a strong reversal from a cluster of three intraday demand zones.
The 25,800 region attracted heavy buying interest with a sharp volume spike.
Volume expansion at the base confirms fresh long accumulation by strong hands.
Structure suggests short-term bottoming within a broader sideways band.
Resistance around 26,048–26,160 will be the next key test for bulls.
🎯 STWP Trade View
Nifty’s recovery from these demand zones indicates buyers regaining control near lower levels.
Keep a close watch on any dips back into the demand zones — such retracements often provide high-probability opportunities for short-term traders.
As long as price sustains above 25,800, the bias stays bullish toward 26,160–26,280.
💡 Learning Note
When multiple intraday demand zones align together, they create a layered liquidity base — an area where institutions quietly accumulate positions.
Volume confirmation near such zones gives early signs of strength beneath the surface.
Final Outlook:
Momentum: Bullish recovery in progress | Trend: Range-bound but firm bias upward | Risk: | Neutral above 25,800 | Volume: Expanding — confirming active participation
________________________________________
________________________________________
⚠️ Disclosure & Disclaimer – Please Read Carefully
The information shared here is meant purely for learning and awareness. It is not a buy or sell recommendation and should not be taken as investment advice. I am not a SEBI-registered investment adviser, and all views expressed are based on personal study, chart patterns, and publicly available market data.
Trading—whether in stocks or options—carries risk. Markets can move unexpectedly, and losses can sometimes exceed the money you have invested. Past performance or past setups do not guarantee future results.
If you are a beginner, treat this as a guide to understand how the market works and practice on paper trades before risking real money. If you are experienced, always assess your own risk, position sizing, and strategy suitability before entering trades.
Consult a SEBI-registered financial adviser before making any real trading decision. By engaging with this content, you acknowledge full responsibility for your trades and investments.
Position Status: No active position in NIFTY at the time of analysis.
Data Source: TradingView & NSE India (Past Chart Reference) (Historical levels)
💬 Found this useful?
🔼 Give this post a Boost to help more traders discover clean, structured learning.
✍️ Drop your thoughts, questions, or setups in the comments — let’s grow together!
🔁 Share with fellow traders and beginners to spread awareness.
👉 “If you liked this breakdown, follow for more clean, structured setups with discipline at the core.”
🚀 Stay Calm. Stay Clean. Trade With Patience.
Trade Smart | Learn Zones | Be Self-Reliant 📊

Daily Analysis Nifty: 27/10/25A quick daily analysis on Nifty50.
Gift Nifty is trading above the last close of the Nifty50 session, so we are expecting a good opening today.
25860-25850 will be intraday support; if breached, the gap will be filled, if any.

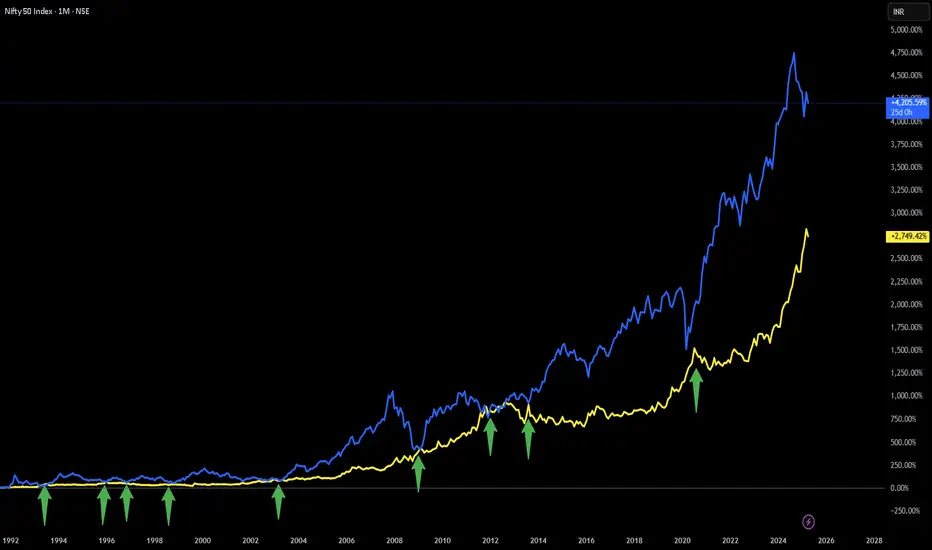
Strange Observation between NIFTY and GOLD...Since August 1, 1991: When ever NIFTY and GOLD return are same NIFTY gives handsome return in coming months.
Good examples of above statement are years 2003, 2009, 2013 and 2020.
Since August 1, 1991: NIFTY has given approx 4200% return and GOLD has given approx 2750% return. Difference in return is approx 1450%.
Going by the above observation either NIFTY has to come down or GOLD has to go up (or both) for NIFTY to give handsome return.
NOTE: This is just a strange observation/correlation.
Disclaimer: This is for demonstration and educational purpose only. This is not buying or selling recommendations. I am not SEBI registered. Please consult your financial advisor before taking any trade.