Bank Nifty ( Neowave Update)Namaskaram Everyone
we have came back with more powerfull and steady way of analysing the market. Starting our comeback with bank nifty.
## Everything is bullish except for weekly cycles.
## market will resume its trend once its go above resistance level.
Have Fun.
NIFTY

Nifty AnalysisThis is Nifty Analysis for Thursday 28th Aug 2025.
Nifty formed a red green candle previous session and almost filled the Monday Gap up. Though sentiment is bearish, a contra view trade may be attempted with tight stoploss today.
Trade Strategy 1:
Enter Long position (Call Option) after retracement confirmation around swing low 24,610.
Stoploss just below 24,541.
Target 1 just below previous day close 24,696. This gives 1 is to 1.5 risk reward ratio.
Target 2 around high 25,816. This gives 1 is to 3.3 risk reward ratio.
Safe traders may consider Trailing Stoploss after 1 is to 1 risk reward ratio is achieved. Note - This is for educational purposes only and not a trade recommendation. I am not SEBI registered. Kindly do your own research before doing any financial transaction.

Fibonacci Retracement Trailing : Lock Profits & Ride Trends🔹 Intro / Overview
Managing trades after entry is just as critical as spotting the entry itself.
In this idea, we apply Fibonacci retracements with a trailing stop system to capture profits while staying disciplined.
A well-structured trailing plan helps traders:
✅ Lock in gains early
🛡️ Protect capital against reversals
📊 Stay rule-based instead of emotional
---
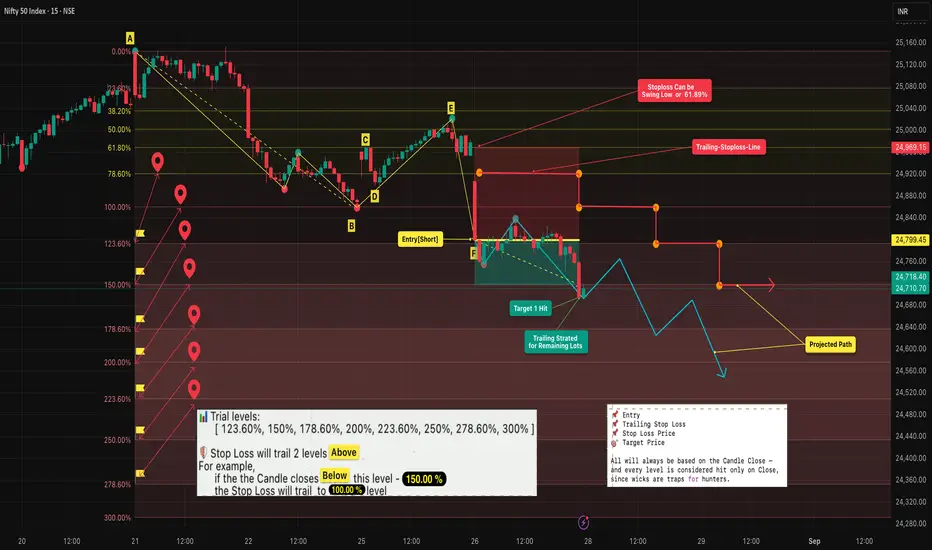
📖 Concept
- A swing High (A) to Low (B) defines our Fibonacci retracement zones.
- Retracements (C, E) test Fibonacci levels but don’t confirm entry until structure is validated.
- Entry (F) occurs only after a successive close confirms the short trade.
- Stop Loss (SL) is placed at the 61.8% retracement (closer and more protective than the far swing).
- Trailing: SL trails forward only , two Fib levels behind price. It manages the remaining position after booking partial profits.
---
📊 Chart Explanation (Step-by-Step)
1️⃣ Swing Definition
📍 A = Swing High
📍 B = Swing Low
2️⃣ Retracement Testing
- C → first retracement (no confirmation)
- D → invalid as no proper close
- E → deeper retracement, still no entry
3️⃣ Entry Point
✅ At F, successive closes confirm → short entry taken
4️⃣ Stop Loss (SL)
📉 Set at 61.8% retracement for tighter risk management
5️⃣ Targets & Trailing
🎯 Target 1 hit → exit one lot, secure partial profits
🔄 Remaining lots managed with trailing system:
• SL adjusted only forward , never backward
• SL trails as price moves down:
• 150% → SL to 100%
• 178.6% → SL to 123.6%
• 200% → SL to 150%, etc.
6️⃣ Projected Path
🔍 Blue/red paths illustrate how price could move while trailing locks in gains
---
🔍 Observations
📌 Entry validated on structure → reduces false signals
🎯 Booking partial profits builds confidence and ensures realized gains
🔄 Trailing maximizes potential while staying safe
📊 Fib-based progression keeps decisions mechanical, not emotional
---
✨ Why It Matters
✔ Turns static Fibonacci into a dynamic strategy
✔ Prevents giving back profits when trends reverse
✔ Adds confidence and discipline in trade management
✔ Teaches how to scale out smartly
---
✅ Conclusion
Fibonacci retracement alone gives levels — but combining it with a trailing stop system transforms it into a complete trade plan.
By booking partial profits and trailing the rest:
🛡️ You protect capital
🚀 You ride trends longer
🤝 You trade with discipline instead of emotion
---
⚠️ Disclaimer
For educational purposes only · Not SEBI registered · Not a buy/sell recommendation · No investment advice — purely a learning resource
Bearish Engulfing Pattern: Spotting Reversals with Discipline🔎 Intro / Overview
Managing a trade after entry is just as important as finding the right setup. The Bearish Engulfing is one of the most reliable candlestick patterns to spot potential reversals. When traded with discipline, it helps you recognize momentum shifts early and manage risk objectively.
📔 Concept
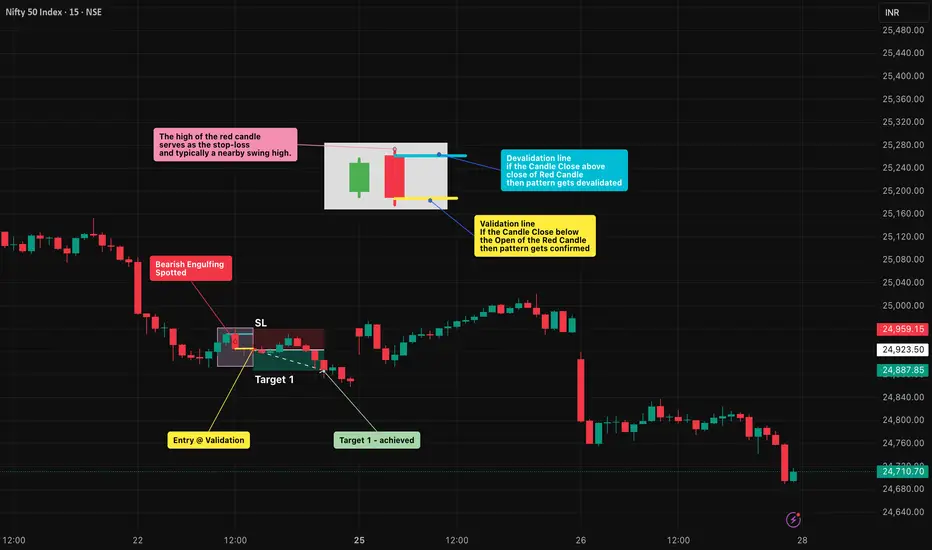
A Bearish Engulfing occurs when:
The first candle is a small green candle that continues the uptrend.
The next candle is a large red candle whose body completely engulfs the green candle’s body .
👉 This shows a clear psychological shift — buyers push higher (green candle), but sellers step in aggressively (red candle) and erase those gains.
📌 How to Use
✅ Validation → The candle must close below the open of the red candle.
❌ Invalidation → If price closes above the close of the red candle before confirmation.
Trading Plan:
Entry → After confirmation of the red candle’s close.
Stop-Loss (SL) → Above the high of the red candle which is also a swing high.
Take-Profit (TP) :
Conservative → 1R (Entry → SL distance)
Moderate → 2R
Aggressive → Book partial at 1R and trail the rest using tools like ATR, Fibonacci levels, or structure-based stops to ride any extended downside move.
📊 Chart Explanation
On the chart, the first small green candle represents buyers continuing the uptrend. The next large red candle completely engulfs the green candle’s body and closes lower, signaling that sellers have taken control.
The pattern was validated at the close of the red candle , where the short entry was taken. The high of the red candle is used as the stop-loss level, while the targets are mirrored in reverse using the same distance.
In this example, Target 1 was quickly achieved . From there, traders can apply trailing stop methods to lock in profits and manage further downside targets.
👀 Observation
Works best when the pattern forms at major resistance levels or after a sustained uptrend .
A high-volume red candle strengthens the reliability of the signal.
In sideways or choppy conditions , false signals are common — always confirm with structure and indicators before acting.
❗ Why It Matters?
The green candle shows buyer optimism .
The red candle shows seller dominance .
This clear flip in control creates a rule-based setup with defined entry, SL, and TP.
🎯 Conclusion
The Bearish Engulfing is a strong sign of reversal — but it’s powerful only when combined with structure, confirmation, and disciplined risk management.
🔥 Patterns don’t predict. Rules protect.
⚠️ Disclaimer
For educational purposes only · Not SEBI registered · Not a buy/sell recommendation · No investment advice — purely a learning resource
NIFTY BUY Market Context & Structure
Primary trend: Up since the April swing low, traveling inside a rising channel. The channel top projects near 28,800–29,300 later; the lower rail rises toward 23,200–23,700 in the near term.
Current phase: An 8–10 week sideways box (roughly 24,600–25,600) after a strong advance—classic digestion at highs.
Key diagonal levels:
The post-April base trendline now runs just under price; losing it invites a shakeout.
A deeper, slower primary trendline sits lower, clustering with prior structure around 23,200–23,700.
Horizontal landmarks on your chart: 25,600/25,400 (supply cap), 25,000 (pivot), 24,400–24,700 (nearby demand/breaker), 23,200–23,700 (rising demand), 21,415 (major higher-timeframe shelf), and 19,600 (last resort structural floor).
Volume: Contracting through the range—typical for consolidation. Look for a volume expansion to validate the next leg.
Core Thesis
The market is in a bullish primary trend but short-term range-bound. The most probable path is either a base-and-break above the range or a stop-run dip into rising demand (23.2–23.7k) before resuming higher. A decisive, high-energy rejection of that demand would be the first meaningful threat to the uptrend.
Scenarios & What Confirms Them
1) Base → Breakout → Trend Continuation (bullish)
Evidence to watch:
Daily closes back above 25,400, then a weekly close above 25,600 with expanding range/volume.
Pullbacks that hold 25,000–25,200 (prior ceiling acting as floor).
Upside roadmap: 26,000–26,300 (mid-channel pause) → 27,300–27,800 → 28,800–29,300 (channel top).
Invalidation for this scenario: A sustained move back inside the box that closes below 24,700.
2) Shakeout → Tag Rising Demand → Relaunch (bullish after dip)
Trigger: Loss of 24,700/24,400 that accelerates into 23,700–23,200 (confluence of rising rails and old structure).
What to see at the lows: Long-lower-wick candles, momentum divergence, or a V-reversal with strong follow-through.
Upside roadmap after reclaim: Reclaim 24,700–25,000, then the same path as Scenario 1.
3) Range Failure → Trend Damage (bear-risk)
Trigger: Strong daily + weekly closes below ~23,200 (and especially if follow-through pushes under 22,800).
Targets if broken: 21,415 major shelf first; if that fails on a weekly basis, the structure opens toward ~19,600.
What would confirm a regime change: Lower highs beneath broken support, rising volume on down legs, failed retests from below.
Practical Playbook (system-agnostic)
Inside the box: Fade edges with tight risk—buy dips near 24,700–24,900, sell bounces near 25,400–25,600—only while the box holds and ranges stay compressed.
Breakout method: Wait for a weekly close above 25,600 or a clean break → retest → go on the daily; avoid chasing without confirmation or expansion in volume/ATR.
Shakeout method: Prepare for a flush into 23.7–23.2k—that’s where risk/reward improves. Let price prove demand (reclaim prior breakdown level; strong reversal candle) before committing.
Invalidation discipline: For any long-bias plan, a weekly close below ~23,200 is a big warning; below 21,415 the bull map is postponed and exposure should be re-evaluated.
Evidence That Would Strengthen the Bull View
Sectoral rotation with banks/industrials carrying pullbacks.
Breadth improvement on up days (advancers outpacing decliners).
Breakouts in heavyweights coinciding with NIFTY clearing 25,600.
Rising 20/50-day ranges after contraction (volatility expansion in the direction of the break).
Risks to Monitor
Global risk-off (USD/UST yields spiking, crude shocks).
Domestic event risk around policy or earnings clusters.
A series of lower highs under 25,400–25,600 coupled with heavier down-volume—often a precursor to Scenario 2 or 3.
Bottom line: The bigger map stays bullish while above 23.2k. Near term, it’s a range at highs with two healthy paths for continuation: (i) clear 25.6k and trend, or (ii) shake out into 23.7–23.2k and relaunch. Only persistent trade below 23.2k starts to bend the primary uptrend toward 21.4k risk.
This is market analysis, not investment advice. Size positions prudently and let the levels, not opinions, do the decision-making.

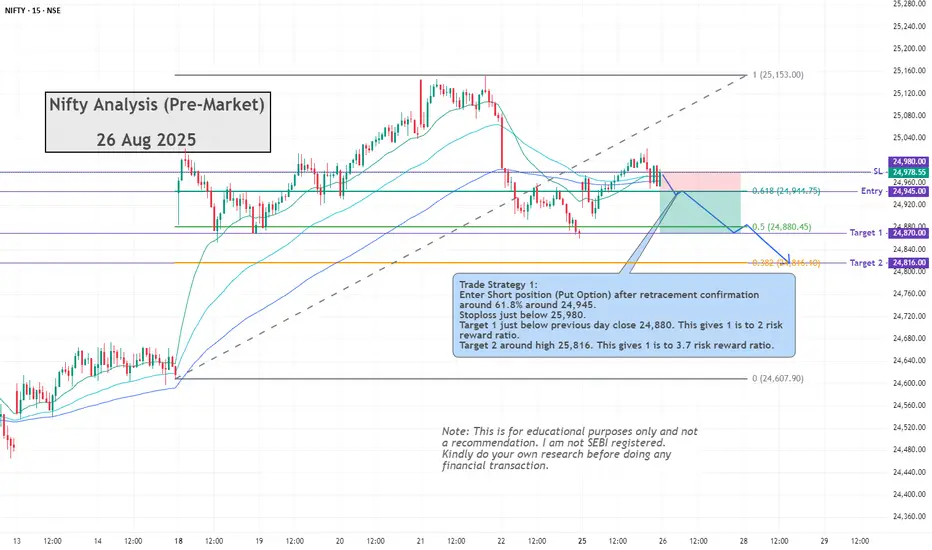
Nifty AnalysisThis is Nifty Analysis for Thursday 26th Aug 2025.
Nifty formed a small green candle previous day and is up by 0.39%. Still it may attempt to fill the Monday Gap up before moving upwards.
Trade Strategy 1: Enter Short position (Put Option) after retracement confirmation around 61.8% around 24,945. Stoploss just below 25,980. Target 1 just below previous day close 24,880. This gives 1 is to 2 risk reward ratio. Target 2 around high 25,816. This gives 1 is to 3.7 risk reward ratio.
Safe traders may consider Trailing Stoploss after 1 is to 1 risk reward ratio is achieved. Note - This is for educational purposes only and not a trade recommendation. I am not SEBI registered. Kindly do your own research before doing any financial transaction.
BIG GAP needs to be filled!! MORE downside??As we can see NIFTY showed unidirectional downfall exactly from our trendline RESISTANCE exactly as analysed and we analysed it through the previous day closing of the candle. Now we can see a big gap that needs to be filled below 24860, hence we might see a trap before finally filling in the GAP below which is almost 200 point. SO, one can plan their trades if following criteria is met

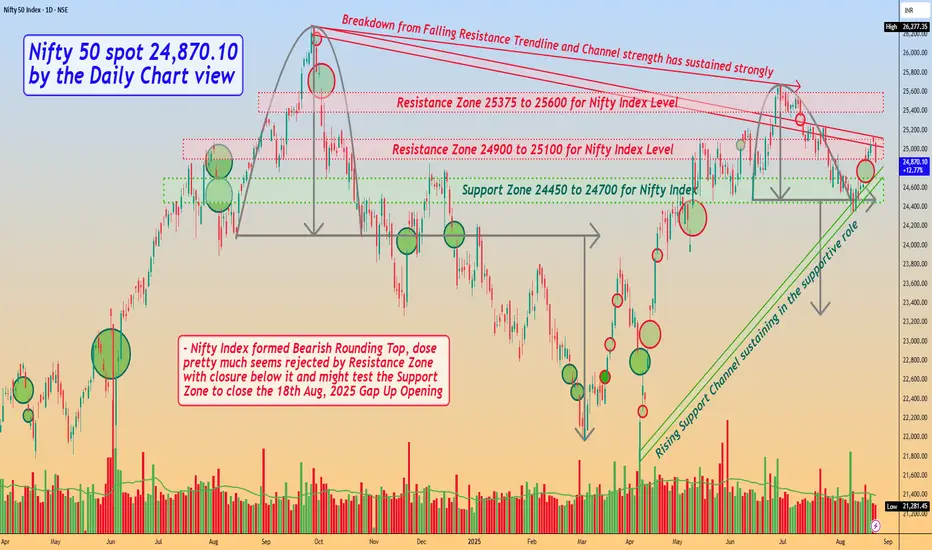
Nifty 50 spot 24,870.10 by the Daily Chart view - Weekly updateNifty 50 spot 24,870.10 by the Daily Chart view - Weekly update
- Support Zone 24450 to 24700 for Nifty Index
- Rising Support Channel sustaining in the supportive role
- Resistance Zone seen at 24900 to 25100 for Nifty Index Level
- Next Resistance Zone seen at 25375 to 25600 for Nifty Index Level
- Nifty Index formed Bearish Rounding Top, dose pretty much seems rejected by Resistance Zone with closure below it
- Basis Gap Up Opening done on 18th August, 2025, Nifty Index might just test Support Zone for closing Gap Up vacuum area
- Rest, let us HOPE FOR THE BEST TO HAPPEN, for the known fact that MARKETS ACT SUPREME ALL THE TIME, no matter what we propagate
Nifty AnalysisThis is Nifty Analysis for Thursday 22nd Aug 2025.
Nifty formed a red candle but formed higher high and higher low formation on Weekly Expiry on Thursday. Nifty is up by 0.13%.
Trade Strategy 1:
Enter Long position (Call Option) after retracement confirmation around 61.8% and Wednesday close - around 25,050. Stoploss just below 25,000.
Target 1 just below previous day high 25,150. This gives 1 is to 1.7 risk reward ratio.
Target 2 around 25,200. This gives 1 is to 2.7 risk reward ratio.
Safe traders may consider Trailing Stoploss after 1 is to 1 risk reward ratio is achieved.
Note - This is for educational purposes only and not a trade recommendation. I am not SEBI registered. Kindly do your own research before doing any financial transaction.

Nifty AnalysisThis is Nifty Analysis for Thursday 21st Aug 2025. Its Weekly Expiry day and may be volatile. Option buyers need to be cautious and safe traders may avoid this day.
Nifty formed a bullish candle and moved up by 0.28% on Wednesday. Nifty is above short term EMAs in Daily timeframe, but is around resistance and psychological level 25,000. This strategy is a risky one.
Trade Strategy 1: Enter Long position (Call Option) after retracement confirmation around previous day low - around 24,930. Stoploss just below 24,850. Target 1 just below previous day close 25,038. This gives 1 is to 1.5 risk reward ratio. Target 2 around previous day high 25,088. This gives 1 is to 2 risk reward ratio.
Safe traders may consider Trailing Stoploss after 1 is to 1 risk reward ratio is achieved.
Note - This is for educational purposes only and not a trade recommendation. I am not SEBI registered. Kindly do your own research before doing any financial transaction.

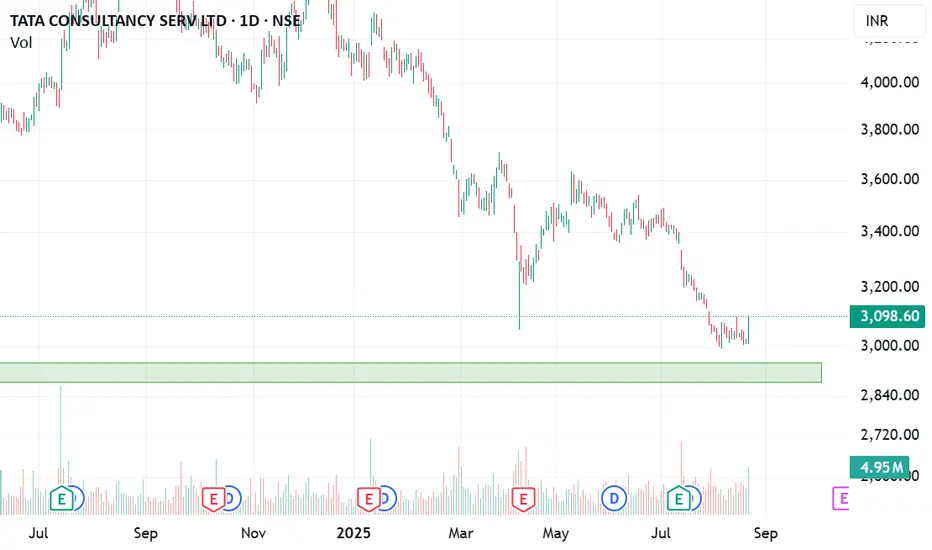
Chart Analysis - TCS1) Weekly support (context)
Price is sitting near a multi-week demand zone (prior swing lows / consolidation base). Weekly supports matter because bigger timeframes filter noise and attract institutional flows.
When price returns to a weekly support and stabilizes, it often transitions from distribution to accumulation.
2) Daily double bottom (pattern)
A double bottom forms when price tests a low, bounces, then retests roughly the same low and rejects it again. That shows buyers defending the level twice.
The neckline is drawn across the swing high between the two lows. A daily close above the neckline confirms the pattern.
3) Volume confirmation
Healthy: rising volume on up-days, especially on the rally from the second bottom and on the neckline breakout. That says demand is active, not just a technical bounce.
4) Risk line (“invalidates below today’s low”)
Your statement “bullish till it holds today’s low” defines a clear invalidity level. If price closes below today’s low, it suggests the second bottom failed—cut risk there.
5) Trade planning (illustrative, not advice)
Entry ideas:
(a) Aggressive: near current price with stop just below today’s low.
(b) Conservative: on a confirmed close above the neckline, or on a pullback/retest to the neckline that holds.
Stops: A few ticks below today’s low (aggressive) or below retest low (conservative).
Management: Scale partial at interim resistance; trail stop under higher lows / 20-EMA on the daily.
6) What would weaken the setup
Weak or declining volume on rallies, repeated rejections at the neckline, or a decisive daily close below today’s low/weekly support.
In short: Weekly support + daily double bottom + volume = constructive. Confirmation comes with a neckline break; invalidation is a close below today’s low.
Trailing Stops: Protect Profits & Ride the Trend with Discipline🔹 Intro / Overview
Managing a position after entry is just as important as identifying the entry itself.
Here, we are specifically discussing trailing stops using Fibonacci retracements .
A well-structured trailing stop helps traders:
✅ Lock in profits
🛡️ Reduce risk
📊 Stay objective in the face of market noise
This idea shows how trailing stops can be applied in a structured way to complement Fibonacci retracements and trend management.
📖 Concept
📍 A trailing stop is a dynamic stop-loss that adjusts as price moves in your favor.
🔄 Instead of staying fixed, it “trails” price at a chosen distance — capturing more upside while capping downside.
🧩 Traders often trail stops using swing lows/highs, moving averages, or volatility measures like ATR .
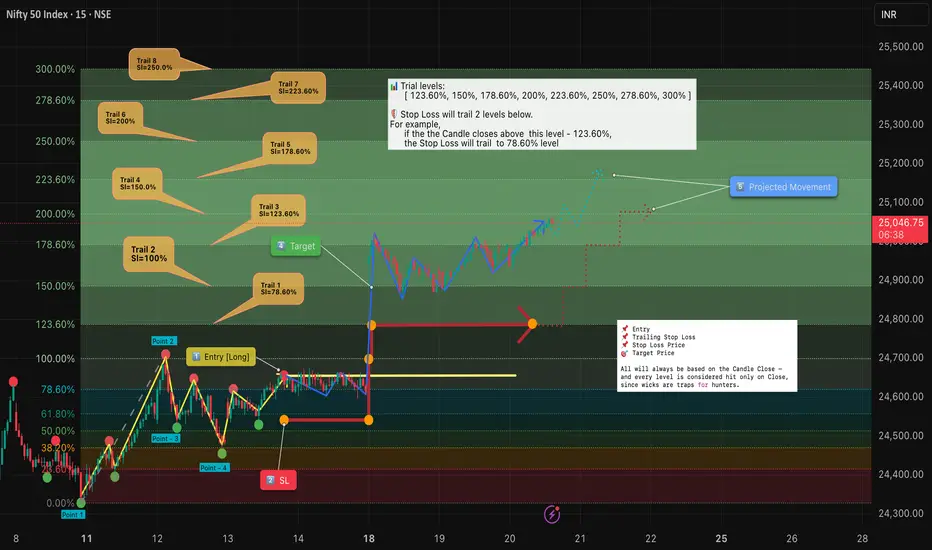
📊 Chart Explanation (Step-by-Step)
1️⃣ Entry Criteria
✅ Successive closes above 78.6% confirm the long entry.
2️⃣ Stop Loss (SL)
📉 Placed at the previous swing low for structure-based protection.
⏩ SL adjustments move forward only with trailing rules — never backward.
3️⃣ Trailing Levels
👉 SL always trails two levels below the current trail level if the candle closes above it.
📈 Trail 1: 123.60% → SL moves to 78.60%
📈 Trail 2: 150.00% → SL moves to 100.00%
📈 Trail 3: 178.60% → SL moves to 123.60%
📈 Trail 4: 200.00% → SL moves to 150.00%
📈 Trail 5: 223.60% → SL moves to 178.60%
📈 Trail 6: 250.00% → SL moves to 200.00%
📈 Trail 7: 278.60% → SL moves to 223.60%
📈 Trail 8: 300.00% → SL moves to 250.00%
4️⃣ Target Points
🎯 At Target 1 , book one lot to secure profits.
📊 Remaining positions can be trailed further with the next levels.
5️⃣ Projected Path
🔍 Dotted blue/red projections illustrate potential movement under this trailing system.
🔍 Observations
📌 Objective Entry : Requires successive closes above 78.6%, reducing false signals.
🎯 Partial Profit Booking : Taking one lot off at Target 1 ensures realized gains.
🔄 Two-Level Trailing : Locks in profits while leaving room for trend continuation.
📊 Rule-Based Framework : Clear Fibonacci-based progression keeps decisions mechanical and consistent.
✨ Why It Matters
✔ Prevents turning winning trades into losers.
✔ Builds confidence by removing emotions from exit decisions.
✔ Lets profits run while maintaining protection.
✅ Conclusion
Trailing stops are not about perfection — they’re about discipline .
By systematically adjusting stops as the market moves, traders:
🛡️ Protect capital
🚀 Let profits run
🤝 Remove emotions from decision-making
When combined with Fibonacci retracements , trailing stops provide a structured framework to manage trades effectively after entry.
⚠️ Disclaimer : For educational purposes only · Not SEBI registered · Not a buy/sell recommendation · No investment advice — purely a learning resource
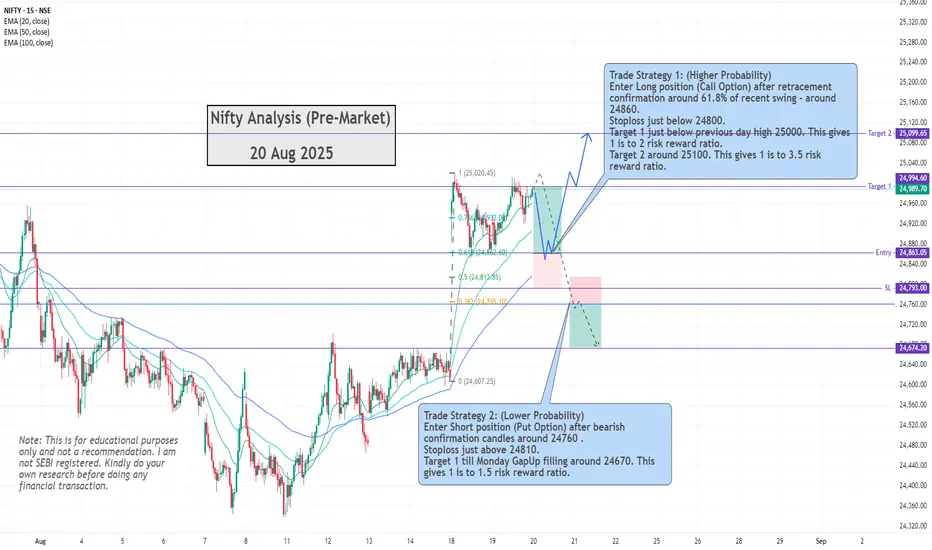
Nifty AnalysisThis is Nifty Analysis for Wednesday 20th Aug 2025.
Nifty formed a bullish candle and moved up by 0.4% on Tuesday. Nifty is above short term EMAs in Daily timeframe, but is near immediate resistance and psychological level 25,000. Though short term Technicals indicate bullishness, wait for a pullback and enter trade. These 2 strategies may work best for Tuesday.
Trade Strategy 1: (Higher Probability)
Enter Long position (Call Option) after retracement confirmation around 61.8% of recent swing - around 24,860. Stoploss just below 24,800. Target 1 just below previous day high 25,000. This gives 1 is to 2 risk reward ratio. Target 2 is around 25100. This gives 1 is to 3.5 risk reward ratio.
Trade Strategy 2: (Lower Probability)
Enter Short position (Put Option) after bearish confirmation candles around 24,760 . Stoploss just above 24,810. Target 1 till Monday Gap Up filling around 24,670. This gives 1 is to 1.5 risk reward ratio.
Safe traders may consider Trailing Stoploss after 1 is to 1 risk reward ratio is achieved.
Note: This is for educational purposes only and not a trade recommendation. I am not SEBI registered. Kindly do your own research before doing any financial transaction.
#nifty50 levels for tomorrow • Analysis For Tomorrow !
• Important Levels
• Support: 24900 - 24770 - 24570.
• Resistance : 24915 - 25125 - 25350.
✓ .

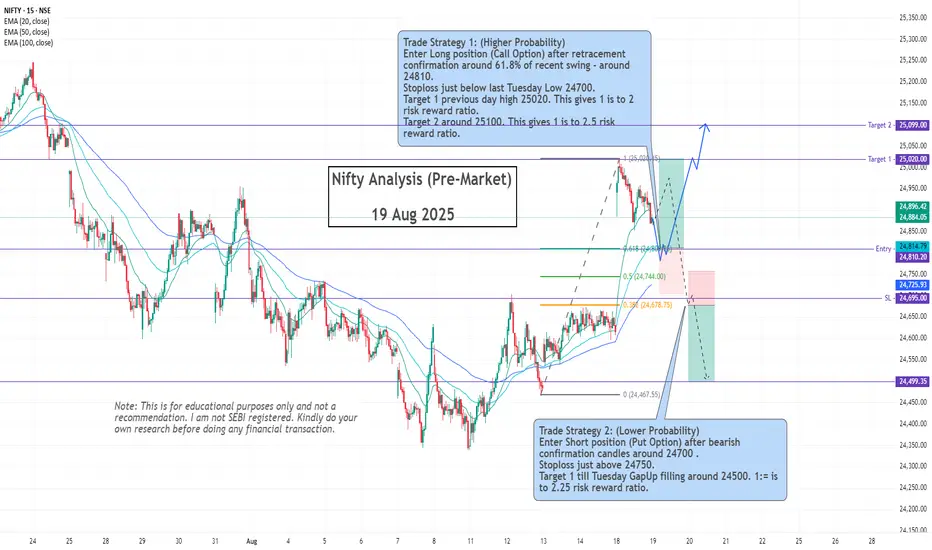
Nifty AnalysisThis is Nifty Analysis for Tuesday 19th Aug 2025.
Nifty opened Gap Up and moved up by 1% on Monday due to the new events (GST, Rating Upgrade). Nifty formed a red candle but has higher high and higher Low formation. It is above short term EMAs in Daily timeframe.
These 2 strategies may work best for Tuesday.
Trade Strategy 1: (Higher Probability)
Enter Long position (Call Option) after retracement confirmation around 61.8% of recent swing - around 24,810. Stoploss just below last Tuesday Low 24,700.
Target 1 previous day high 25,020. This gives 1 is to 2 risk reward ratio. Target 2 around 25,100. This gives 1 is to 2.5 risk reward ratio.
Trade Strategy 2: (Lower Probability)
Enter Short position (Put Option) after bearish confirmation candles around 24,700 . Stoploss just above 24,750. Target 1 till Tuesday Gap Up filling around 24,500. This gives 1 is to 2.25 risk reward ratio.
Safe traders may consider Trailing Stoploss after 1 is to 1 risk reward ratio is achieved.
Note: This is for educational purposes only and not a trade recommendation. I am not SEBI registered. Kindly do your own research before doing any financial transaction.
nifty analysis 19.08.2025Nifty analysis tomorrow
This video is only for educational puporse and not a trading confirmation.
pls trade as per your view and analysis. we are not responsible for any loss or damage caused.

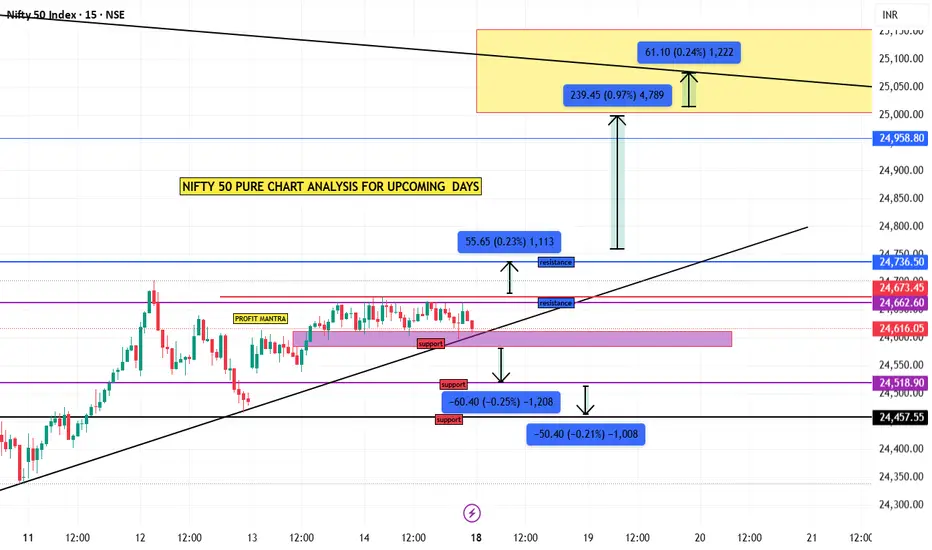
nifty 50 simple analysispure price action chart analysis. here nifty 50 behave sideways
in 15 minute time frame, see chart you can understand.
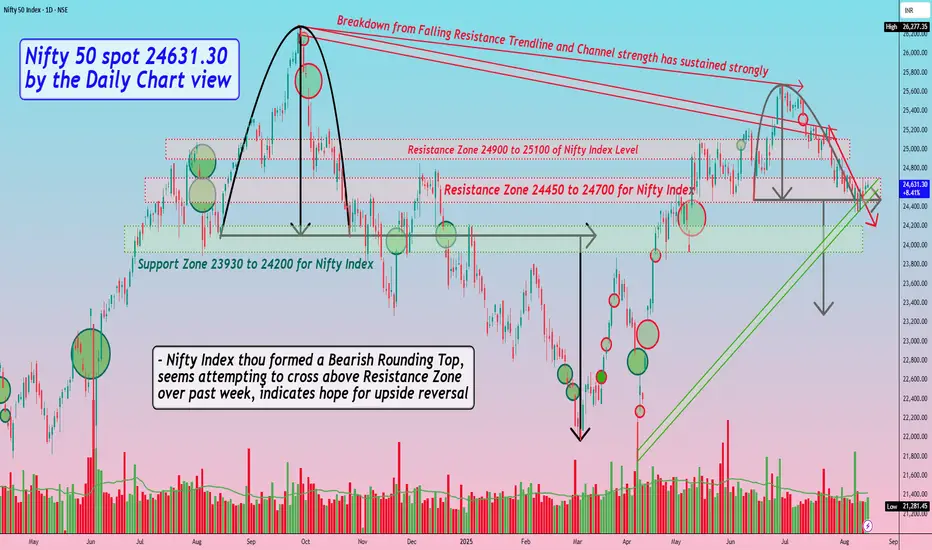
Nifty 50 spot 24631.30 by Daily Chart view - Weekly updateNifty 50 spot 24631.30 by Daily Chart view - Weekly update
- Support Zone 23930 to 24200 for Nifty Index
- Resistance Zone 24450 to 24700 for Nifty Index
- Breakout from above one of the Tiny Falling Resistance Trendline seems well sustained
- Rising Support Channel seems back in supportive role and maintained by current status of Nifty Chart setup
- Nifty Index thou formed a Bearish Rounding Top, seems attempting to cross above Resistance Zone over past week, indicates hope for upside reversal
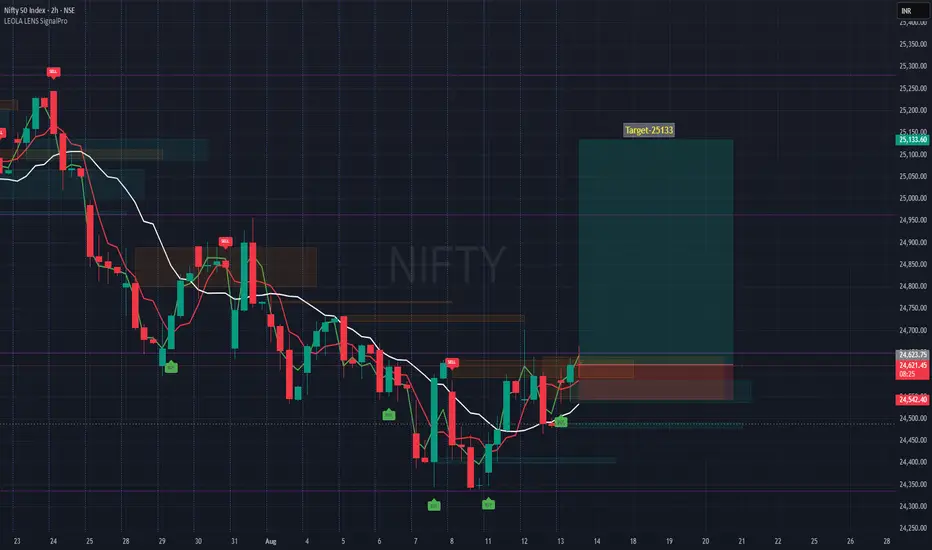
NIFTY Eyes Long on 25133- Bullish Breakout WatchTimeframe: 2-hour (H2)
Entry Zone: Around current breakout level of 24,619
Target: 25,133 – aligns with a prior reaction high and measured move projection from recent swing range.
Stop-Loss: 24,542 – just below the most recent higher low, protecting the setup if momentum fails.
Reasoning:
Price has been forming higher lows since August 7, indicating gradual strength building.
Moving averages have turned upward, confirming short-term trend change.
Previous sell-side liquidity zones have been cleared, reducing overhead resistance until the 25,133 area.
Volume profile shows a gap zone between 24,650 and 25,100, often filled quickly in trending conditions.
Risk Management:
This is a swing-style setup within an ongoing uptrend on the lower timeframe but still needs confirmation from follow-through buying.
Disclaimer:
This chart is for educational discussion only and does not constitute financial advice or a recommendation to trade. Markets carry risk, and decisions should be based on your own analysis and risk tolerance.
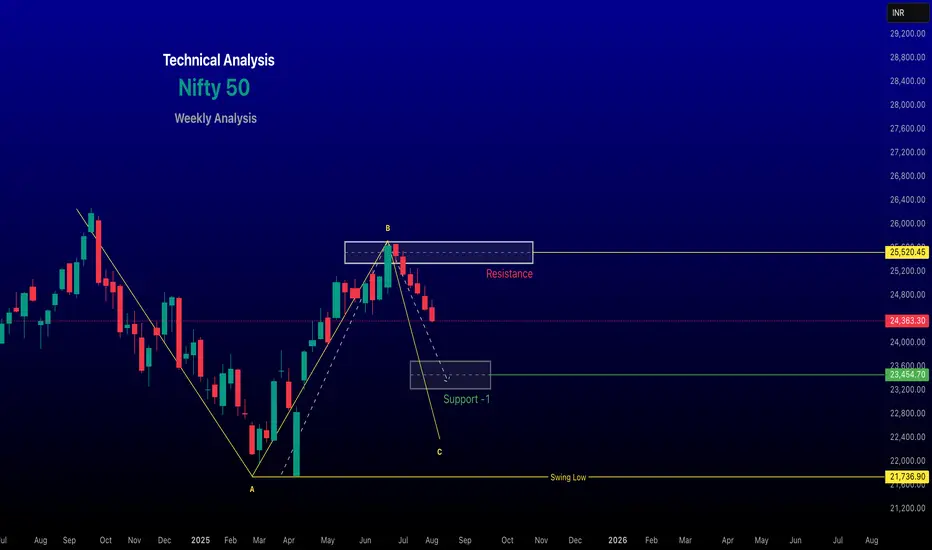
renderwithme | NIFTY-50 for the week of August 11–15, 2025The Nifty 50 index, a benchmark for the Indian stock market, is expected to exhibit cautious and potentially bearish behaviour for the week of August 11–15, 2025, based on recent market trends, technical analysis, and macroeconomic factors. Below is a detailed analysis for the upcoming week
# Current Market Context
Recent Performance: As of August 8, 2025, the Nifty 50 closed at 24,363.30, down 232.85 points (-0.95%), reflecting a bearish sentiment driven by foreign fund outflows and US-India tariff tensions. The index has been trading within a descending channel, characterised by lower highs and lower lows, indicating short-term weakness.
Technical Indicators:
Weekly Chart: A candle formed on the weekly chart, signalling market Bearish. Confirmation of this pattern could indicate further consolidation or a directional move.
Moving Averages: The Nifty is below its 21-day EMA, suggesting bearish momentum. The 5-day SMA and EMA are around 24,843.75 and 24,865.11, respectively, acting as resistance.
RSI and MACD: RSI is in the 35–40 range, indicating oversold conditions, which could signal a potential short-term bounce. MACD remains bearish, reflecting sustained selling pressure.
Pivot Levels: Key resistance is at 25,600–25,925, with immediate support at 23,250–23,400. A break below 23,200 could push the index toward its 200-day DMA (~23,900).
Market Sentiment: Sentiment is cautious due to:FII Outflows: Foreign Institutional Investors (FIIs) sold equities worth ₹4,997.19 crore on August 7, 2025, exerting downward pressure. Domestic Institutional Investors (DIIs) countered with ₹10,864.04 crore in buys, providing some support.
Global Cues: Mixed global market performance (e.g., NASDAQ down 2.24%, Dow Jones up 0.29% on August 4) and US tariff hikes on Indian imports are weighing on sentiment.
RBI Policy: The upcoming RBI policy decision could influence market direction, particularly if it addresses interest rates or liquidity measures.
Nifty 50 Forecast for Next Week (August 11–15, 2025)Based on available data, here’s the forecast for the week:Key Levels to WatchSupport Levels: 23,200, 23,500, (200-DMA). If A weekly candle break and close below 22,000 could accelerate selling toward 22,500.
Resistance Levels: 25,545–25,955. A sustained move above 25,900 could signal a potential reversal, with 26,000 as a critical psychological level.
Trend: Bearish with support at 24,200 critical. A positive global cue (e.g., GIFT Nifty up 0.36% on August 4) could support a modest recovery.
#Technical Outlook
- Bearish Scenario: If the Nifty fails to hold 23,200, it could slide toward 22,900 or lower, aligning with the 200-DMA. The inverse head-and-shoulders pattern on the weekly chart suggests a potential base at 22,900, but confirmation is pending.
- Bullish Scenario: A break above 24,600 could trigger a short-term rally toward 24,925–25,045. Sustaining above 25,000 may push the index toward 25,250, potentially signaling a trend reversal.
Indicators: Oversold RSI (35–40) suggests a possible bounce, but bearish MACD and selling volume indicate caution. Traders should monitor for a bullish crossover in MACD or RSI moving above 50 for confirmation of upward momentum.
Key Factors to WatchGlobal Markets: Movements in major indices like NASDAQ, Dow Jones, and FTSE will influence Nifty’s direction. Positive cues from GIFT Nifty (24,685 on August 4) could support a recovery.
FII/DII Activity: Continued FII selling could pressure the index, while DII buying may limit downside.
RBI Policy: Any dovish signals or liquidity measures could boost sentiment.
Sector Performance: Banking, IT, and energy sectors are critical. Stocks like SBI, Bharti Airtel, and Tata Motors may drive index movements.
Geopolitical and Tariff Issues: US-India trade tensions could cap upside potential.
Monitor volume and global cues for intraday trades.
Long-Term Investors:Current valuations near 23,200–23,400 are attractive for quality stocks. Accumulate fundamentally strong Nifty constituents (e.g., HDFC Bank, Reliance) on dips.
Use oversold conditions as an entry point for long-term portfolios, but diversify to mitigate volatility risks.
Critical PerspectiveWhile the sources provide detailed technical levels and predictions, they rely heavily on historical patterns and short-term indicators, which may not account for sudden macroeconomic shifts or black-swan events. The bearish bias is driven by FII outflows and tariff concerns, but DII support and potential RBI interventions could stabilize the market. Predictions like those from (e.g., Min: 22,200, Max: 26,240) show wide ranges, reflecting uncertainty and volatility. Investors should question overly precise forecasts and focus on broader trends, such as the index’s proximity to the 200-DMA and global market correlations.
ConclusionThe Nifty 50 is likely to remain range-bound between 23,900 and 24,925 next week, with a bearish bias unless it breaks above 24,600. Key supports at 24,200–24,000 and resistance at 24,600–25,045 will dictate short-term movements. Traders should stay cautious, monitor global cues, and prioritise risk management, while long-term investors may find opportunities in oversold conditions. Always verify critical information and consult a financial advisor before making decisions.
Chart for your Reference Only
~~ Disclaimer ~~
This analysis is based on recent technical data and market sentiment from web sources. It is for informational \ educational purposes only and not financial advice. Trading involves high risks, and past performance does not guarantee future results. Always conduct your own research or consult a SEBI-registered advisor before trading.
# Boost and comment will be highly appreciated.
Nifty 50 spot 24,363.30 by the Daily Chart view - Weekly updateNifty 50 spot 24,363.30 by the Daily Chart view - Weekly update
- Support Zone 23850 to 24100 for Nifty Index
- Resistance Zone 24450 to 24700 for Nifty Index earlier Support Zone
- Bearish Rounding pattern top for Nifty 50 Index from ATH 26277.35 to 24073.90 diff 2,203 points
- Nifty 50 Index took reversal from 21964.60 just tad above from expected low of 21870 by 2203 points
- Bearish Rounding Top has repeated from the recent high of 25669.35 to 24473 having a difference of 1196 points
- *Will the same downfall behavior happen and see history repeated for Nifty 50 Index going down till 23276 and then reverse upside*
- *Stock Markets Domestically and Globally, are bearing the brunt of adversely affecting and negatively playing Tariff Tantrum Trumpet*

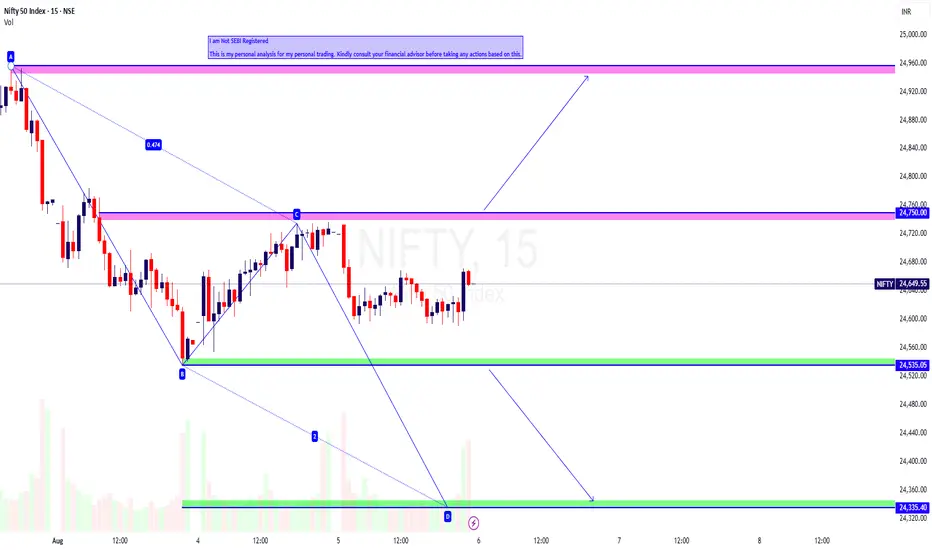
NIFTY Intraday Trade Setup 06 Aug 2025NIFTY Intraday Trade Setup 06 Aug 2025
Buy-Above 24750
Invalid-Below 24700
T- 24950
Bearish- Below 24530
Invalid-Above 24580
T- 24335
NIFTY has closed on a bearish note with 0.3% cut today. It has made 2 consecutive inside candles in daily TF. 24500 zone will be a confluence zone, due to multiple supports taken earlier. Below 24400 index can escalate, and index may start an impulsive move. On flat opening above 24750 index may give a reversal move towards 25k. Below 24530 index will be simple short towards 24335 zone as per ABCD pattern. Plan on 15 Min candle closing.
In case of a big gap up/down, wait till 10 o'clock and mark the high and low of the trading range (5MIN). Trade on this range breakout.
==========
I am Not SEBI Registered
This is my personal analysis for my personal trading. Kindly consult your financial advisor before taking any actions based on this.
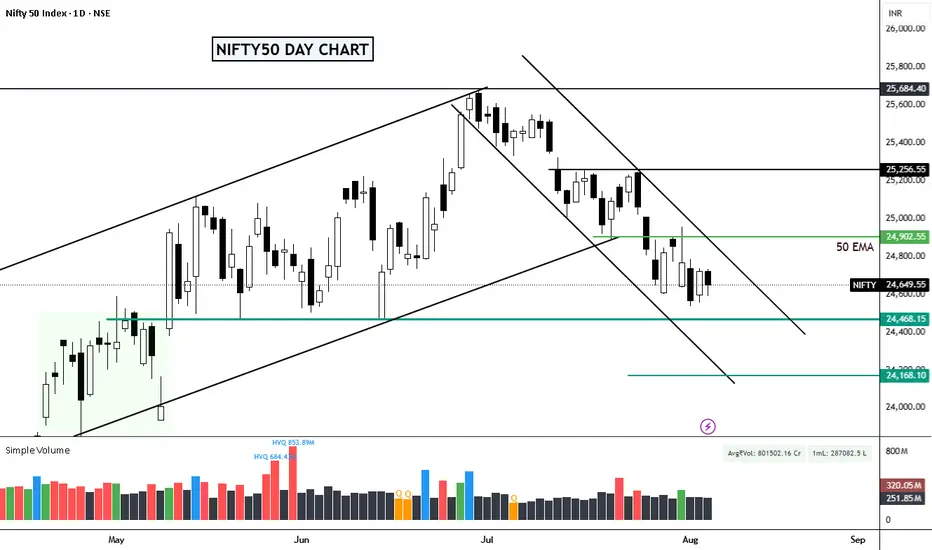
Nifty Navigator - Trading Switch is off NSE:NIFTY (06 - August )
👉Stuck below 50EMA & above previous demand zone.
Too much silence out there for long traders,
Now Next Resistance is - 50 EMA zone as of now, uncertainty building up
Seems like the current pause is just a pullback in the correction leg, and it should hit the support zone and build a linear base before moving up.
👉PCR - 0.72
👉INDIAVIX - 11.71
Support: 24470,24170
Resistance:-24900,25250
⭐️Verdict: The views remain the same as last time, we need more action and hold our horses, otherwise, we may cripple it.
The Trading Switch is Off - As the MARKET SCORE is Now 3.