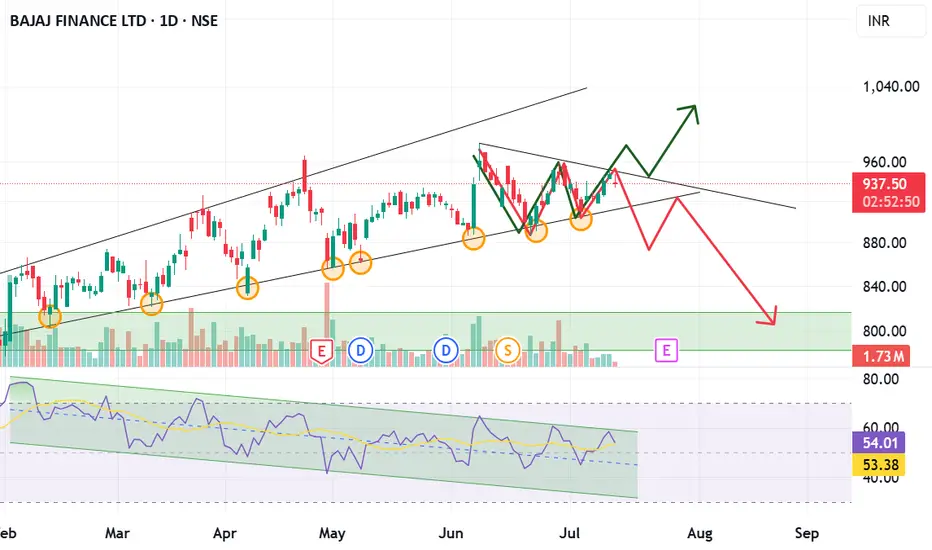
Bajaj Finance – Trendline BreakdownBajaj Finance has broken a key ascending trendline on the daily chart, with a minor retest underway. The price now trades below the 21 EMA (926.59), indicating short-term weakness. RSI stands at 38.31, showing bearish momentum with room for further downside. A significant volume spike confirms strong selling pressure. If the retest fails, the stock could drop toward the 790–830 support zone. This bearish setup remains valid unless the price reclaims the trendline and closes above the EMA. Traders should watch for rejection at the trendline to confirm further downside.
NIFTY

Sensex Scalping Plan For Tomorrow (29/07) Just My ViewThis Trade is Valid Only If Gap-Down Open (80,600 or lower)
Logic: breakdown continuation, FII dump, aggressive call OI active contracts, Weak put writers.
5m Negative Candle + EMA rejection
Entry Around 80,850 – 80,950 Retest
Stop Loss Around Above 81050-81,100
Target 1 80,600 (Day Low)
Target 2 80,200
Disclaimer:
I am not a SEBI-registered advisor. This analysis is for educational and informational purposes only. It should not be considered as investment advice or a recommendation to buy/sell any securities. Please consult your financial advisor before making any investment decisions. Trading and investing involve risk.

NIFTY Analysis – 29 july 2025 ,Morning update at 9 amMarket View
Likely to open flat negative near 24650
May dip initially towards 24608
If Bearish Bottleneck forms on the 5-min chart, then it may further slip towards 24531
if Bearish Trend Continues
Possible downside extension: 24531 → 24449
If Market Holds or Reverses
If Nifty consolidates or holds above 24650, then short covering may occur
Possible upside targets: 24765, then 24841, and finally 24900
ifty is already in an oversold zone, hence:
First dip may happen early
Monitor for reversal signs around 24608–24531
Don’t short aggressively after the first move

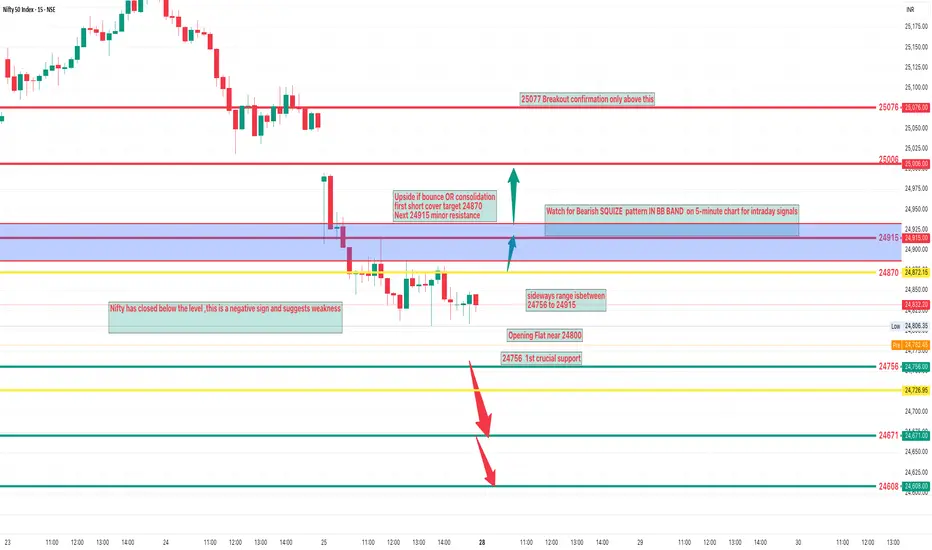
NIFTY Analysis – 28 july 2025 ,Morning update at 9 amExpected Opening & Movement Zones
Likely Opening Flat near 24800.
Immediate Downside Target (if weak)
First: 24756 important support.
Then: 246721– next support.
Upside if bounce or consolidation
First short-cover target: 24870.
Next: 24915 – minor resistance.
24756,Near today's flat open 1st crucial support
24671 If bottleneck confirmed –test this zone
24608 Extended weakness zone
Resistance Levels
24915 Short covering resistance
25,006 Important psychological and swing resistance
25076 Breakout confirmation only above this
the sideways range is likely between
24756 to 24915
Nifty may consolidate in this zone before giving any big move.
NIFTY Intraday Trade Setup For 28 Jul 2025NIFTY Intraday Trade Setup For 28 Jul 2025
Sell_1- From 24990
Invalid-Above 25040
T- 24800
Bearish-Below 24800
Invalid-Above 24850
T- 24620
NIFTY has closed on a bearish note, ended near lowest point of the week. Index has closed below 50 and 21 EMA both. Its sell on rise market till it is below 50 EMA. Support lies near 24150, 24450 will be a confluence zone in between. Following the sell on rise approach, On Monday 25k zone will be a resistance area to plan a short. On flat opening, below 24800 will be a simple short planning towards 24600 zone.
In case of a big gap up/down, wait till 10 o'clock and mark the high and low of the trading range (5MIN). Trade on this range breakout.
==========
I am Not SEBI Registered
This is my personal analysis for my personal trading. Kindly consult your financial advisor before taking any actions based on this.

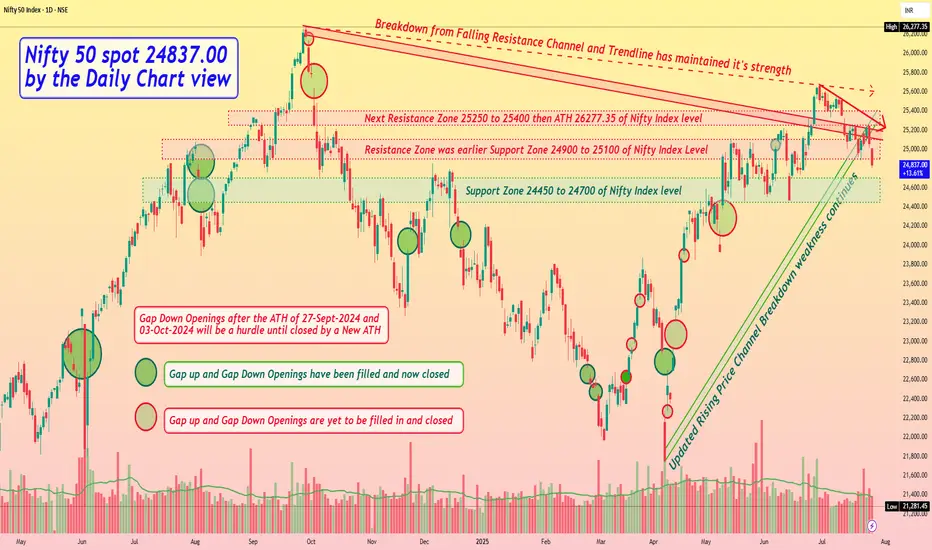
Nifty 50 spot 24837.00 by the Daily Chart view - Weekly updateNifty 50 spot 24837.00 by the Daily Chart view - Weekly update
- Support Zone 24450 to 24700 of Nifty Index level
- Updated Rising Price Channel Breakdown weakness continues
- Resistance Zone was earlier Support Zone 24900 to 25100 of Nifty Index Level
- Next Resistance Zone seen at 25250 to 25400 then ATH 26277.35 of Nifty Index level
- Breakdown from the Falling Resistance Channel and Trendline has maintained it's strength
- *Multiple reasons attribute for weakness and breakdown and that is how Markets show their Supremacy*
Nifty 50 at a Critical Juncture – Breakdown or Bounce Ahead?Technical Overview – Trendline Test in Action
After breaking out of a well-defined falling wedge pattern in April 2025, the Nifty 50 had been respecting an ascending support trendline, offering steady higher lows and consistent bullish structure.
However, in the most recent session, price closed just below this key trendline at 24,926.80, with volume slightly elevated — a signal that the bulls are losing control unless support is reclaimed quickly.
Key Technical Levels
Immediate Resistance: 25,100–25,250
Trendline Support (Broken): ~24,950
Major Demand Zone: 24,300–24,600
Critical Breakdown Level: 24,850
Options Chain Snapshot – What Smart Money Is Signaling
Expiry: 31st July 2025
Spot: 24,935.50
Futures: 24,956.50
🔸 Call Writers in Control
Significant OI at 25,000 CE (140.7K) and 24,950 CE (38K)
Call unwinding seen from 24,700 to 25,200, suggesting profit booking or reduced bullish conviction
IVs remain compressed across ATM and OTM calls → calm surface, but pressure building
🔹 Put Writers Still Active
24,900 PE (101K OI, +59.5K) and 25,000 PE (143K OI, +40.9K) are heavily defended
PCR remains above 1 for 24,950–25,000 zone → put writers betting on expiry support
Rising OI at 24,800 PE (84K) also shows growing downside hedges
Data vs. Price – A Divergence Worth Watching
While options data suggests bulls are trying to defend 24,900–25,000 with heavy put writing, price action tells a different story. A clean break of the trendline and a lower daily close below 24,850 would shift momentum in favor of the bears.
📉 Breakdown Confirmation:
Sustained move below 24,850
Rising call OI at 25,000+
Unwinding of 24,900 PE and 24,800 PE
Pickup in IV and red candle with volume
Strategy Ideas (Educational Purpose Only)
🟩 Bullish Scenario
Bias: Long above trendline reclaim
Entry: On breakout above 25,050
Stop Loss: Below 24,850
Target: 25,300 and then 25,500
🟥 Bearish Scenario
Bias: Short below confirmed breakdown
Entry: Below 24,850
Stop Loss: Above 25,050
Target: 24,600, possibly extending to 24,300
🟨 Neutral / Non-Directional View
Bias: Range-bound / IV crush play
Strategy: Short Straddle using 24,950 CE + 24,950 PE
Hedge Zone: Manage risk beyond ±150 points
Goal: Capture premium decay as expiry nears
🧭 Conclusion – Prepare, Don’t Predict
The Nifty 50 is sitting at a crucial inflection point — where structure meets sentiment. While option writers continue to show faith in the 24,900–25,000 zone, a clean break below the recent support could trigger swift downside toward the 24,400 zone.
In times like these, reacting to confirmation is smarter than pre-empting moves. Watch price, volume, and open interest shifts closely in the coming sessions.

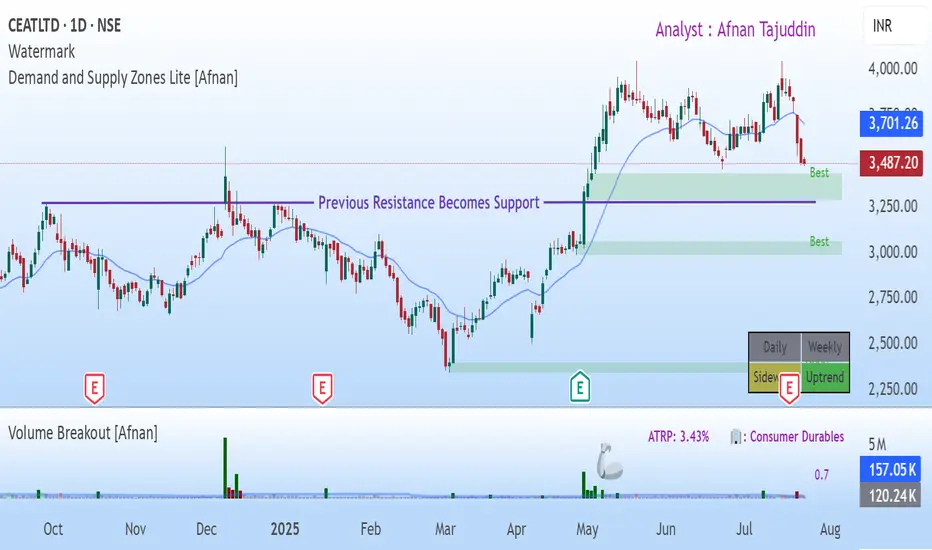
CEAT Ltd: Is a Rebound on the Horizon? A Confluence of TechnicalTraders — let’s dig into CEAT Ltd NSE:CEATLTD . where both demand-supply dynamics and classic technical signals are flashing something worth watching. What’s setting up here isn’t just noise — there’s real structure underneath the surface.
Demand Zone & Institutional Footprints
Let’s start with the core of this setup: the Demand Zone. CEAT’s price is inching toward a daily timeframe Rally-Base-Rally zone — and not just any zone, but one that stands out in terms of quality.
Why does this matter? Because these aren’t retail-driven bounces. These are often the hidden footprints of institutions quietly building positions.
On June 23rd, price came close to this very demand zone — and without even touching it, we saw a sharp bounce. That’s a strong tell. There’s clear demand waiting just below.
Institutions don’t throw their entire order book at the market in one go. They scale in. So when price comes back to this area, it’s likely to trigger those leftover buy orders — potentially leading to another move higher.
Zooming out to the broader view : Both weekly and monthly charts are still in an uptrend. There are no obvious supply zones on the higher timeframes That clears the runway for bullish continuation.
💡 Traditional Technical Analysis Perspective 💡
Now let’s switch gears for a moment and take a look through the lens of classic technical analysis. What’s the chart telling us in plain sight?
CEAT spent months coiling within a consolidation range — nothing impulsive, just sideways chop.
But that changed on April 30th with a decisive breakout. And this wasn’t on light volume — it came with strong participation, a real sign of conviction.
Post-breakout, we’ve seen consistent volume buildup alongside price progression. This isn’t a one-day wonder — it’s been developing.
Act of Polarity at Work: The breakout level had previously acted as firm resistance multiple times. Now that price is retesting it from above, it’s doing exactly what we expect — flipping that resistance into potential support.
Interestingly, this retracement is happening on declining volume. That’s key. It often suggests a healthy retest rather than a breakdown — a potential “buy the dip” scenario, if you will.
🤝 The Confluence: Where Two Worlds Meet 🤝
Here’s where things get really compelling — that demand zone we highlighted? It aligns perfectly with the same level that’s being retested post-breakout. That overlap — this confluence — is no coincidence.
It dramatically increases the odds of a strong bounce, because we’re getting validation from two independent analytical frameworks. When price, psychology, and institutional footprints all point to the same zone — you pay attention.
We could consider a tactical Stop Loss just below the demand zone. And in terms of upside? The previous swing high near ₹4000 stands out as a logical first target.
"Success in trading is a marathon, not a sprint. Consistency, discipline, and effective risk management are your true North Stars."
Stay sharp. Even the cleanest setup can fail — and that’s why managing risk isn’t optional. If price violates the zone and closes below your SL, step out without hesitation.
Thanks for reading — your support, feedback, and questions always help drive this community forward. Let’s keep sharpening our edge together.
🚀 Trade smart, stay disciplined, and let your journey be one of continuous learning! 🚀
Disclaimer: This analysis is intended purely for educational purposes. It does not constitute investment advice or a trading recommendation. I am not a SEBI-registered advisor.
25400 coming soon!!As we can see despite the weak opening, NIFTY showed strong REVERSAL which not only shows good accuracy but also shows sticking to our plan with patience does pay off most of the times. Hence, following the view we should remain long on the position as in smaller TF, it can also be seen that it is forming more like a W pattern which can show good upmove till 25400 so plan your trades accordingly and keep watching everyone.

Demand & Supply Price Action Play – CMSINFO Price Structure & Market Context
CMSINFO’s recent price action has followed a textbook path, respecting clean structural levels driven by institutional order flow. It's one of those charts where the zones aren’t just technical—they're telling a story. And right now, that story is setting up a potentially meaningful long opportunity.
💡 Daily Timeframe – Big Picture Bias
The daily chart remains resolutely bullish . We're still seeing that healthy rhythm of higher highs and higher lows , signaling that the uptrend is very much intact.
📍 Daily Supply Zone: ₹540 – ₹546
That said, price did face some resistance recently—right where we’d expect it to. A fresh supply zone Rally Base Drop around ₹540–₹546 served up a rejection and sparked the current pullback. Nothing unusual there. In fact, in strong trends, these kinds of pullbacks often offer the best risk-adjusted entries —as long as we’re positioned at the right zones.
⏱️ 125-Minute Timeframe – Precision Entry Layer
Zooming into the 125-minute chart gives us a much clearer map for potential execution.
🟢 Demand Zone: Rally Base Rally ₹500 – ₹498
Here’s where things get interesting. This demand zone hasn’t been touched since it formed—making it a fresh zone , and by definition, high-probability for a first bounce. Price has just tapped into it, which could attract short-term buyers looking to ride the next leg up.
🔴 Supply Zone: Rally Base Drop ₹532 – ₹537
This zone sits just overhead and marks the first potential resistance . If price moves up from the current demand area, this is where traders may begin trimming positions or tightening stops.
🎯 Trade Blueprint 🎯
Entry: Between ₹500 – ₹498 (inside 125-minute demand zone)
Stop Loss: Below ₹498 (conservative buffer: ₹495)
Target 1: ₹532 – ₹537 (nearest 125min supply)
🧩 Why This Setup Deserves Attention 🧩
Daily Trend Structure Remains Bullish – higher timeframe bias supports a continuation upward.
Fresh LTF Demand Zone – first touch makes this zone statistically favorable.
Defined Risk-Reward Parameters – tight stop with layered targets for flexible management.
Pure Price Action Logic – just clean, institutional footprints.
🚀 “Opportunities don’t come from chasing— they come from waiting in the right places.” 💡 Stay patient, respect your zones, and let the market come to you.
This analysis is purely for educational purposes and does not constitute a trading or investment recommendation. I am not a SEBI registered analyst.
Lastly, thank you for your support, your likes & comments. Feel free to ask if you have questions.

NIFTY KEY LEVELS FOR 21.07.2025NIFTY KEY LEVELS FOR 21.07.2025
If the candle stays above the pivot point, it is considered a bullish bias; if it remains below, it indicates a bearish bias. Price may reverse near Resistance 1 or Support 1. If it moves further, the next potential reversal zone is near Resistance 2 or Support 2. If these levels are also broken, we can expect the trend.
If the range is narrow, the market may become volatile or trend strongly. If the range is wide, the market is more likely to remain sideways
📢 Disclaimer
I am not a SEBI-registered financial adviser.
The information, views, and ideas shared here are purely for educational and informational purposes only. They are not intended as investment advice or a recommendation to buy, sell, or hold any financial instruments.
Please consult with your SEBI-registered financial advisor before making any trading or investment decisions.
Trading and investing in the stock market involves risk, and you should do your own research and analysis. You are solely responsible for any decisions made based on this research.

NIFTY Intraday Trade Setup For 21 Jul 2025NIFTY Intraday Trade Setup For 21 Jul 2025
Bullish-Above 25015
Invalid-Below 24965
T- 25150
Bearish-Below 24910
Invalid-Above 24960
T- 24640
NIFTY has closed on a slight bearish note with 0.72% cut last week. Index has reached 50 EMA in daily TF which is placed near 24900. A bounce from EMA can be expected. However below 24900 index may dive in the next week also. On a flat opening above 25015 a bullish move towards 25150 can be expected. Intraday resistance is placed at the 25150 as per half bat pattern. On a flat opening below 24910 index will test 24640. Plan trades on 15 Min candle close.
In case of a big gap up/down, wait till 10 o'clock and mark the high and low of the trading range (5MIN). Trade on this range breakout.
==========
I am Not SEBI Registered
This is my personal analysis for my personal trading. Kindly consult your financial advisor before taking any actions based on this.

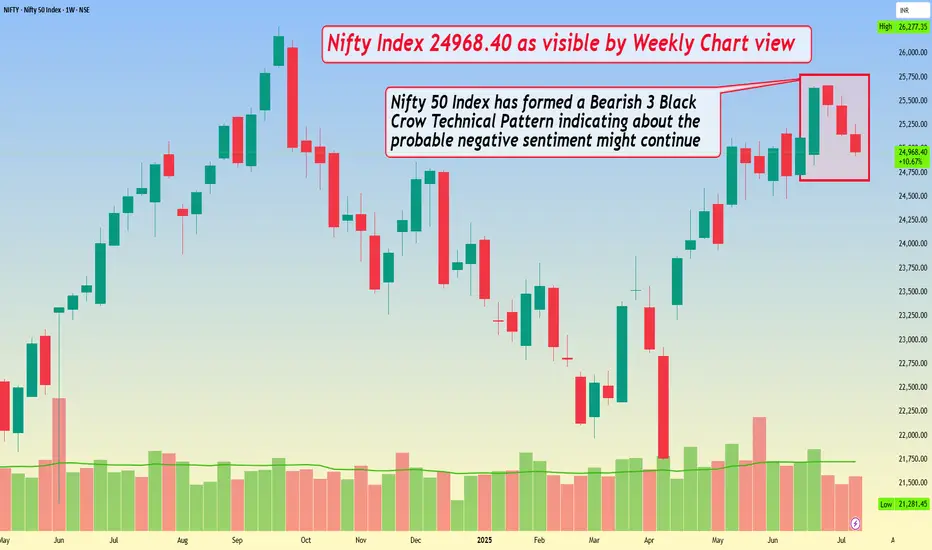
Nifty Index 24968.40 as visible by Weekly Chart viewNifty Index 24968.40 as visible by Weekly Chart view
- Nifty 50 Index has formed a Bearish 3 Black Crow Technical Pattern indicating about the probable negative sentiment might continue
- Nifty is also closely forming a sliding Bearish Double Top from ATH 26277.35 to current top 25669.35, which again syncs with the negative sentiment trend trajectory
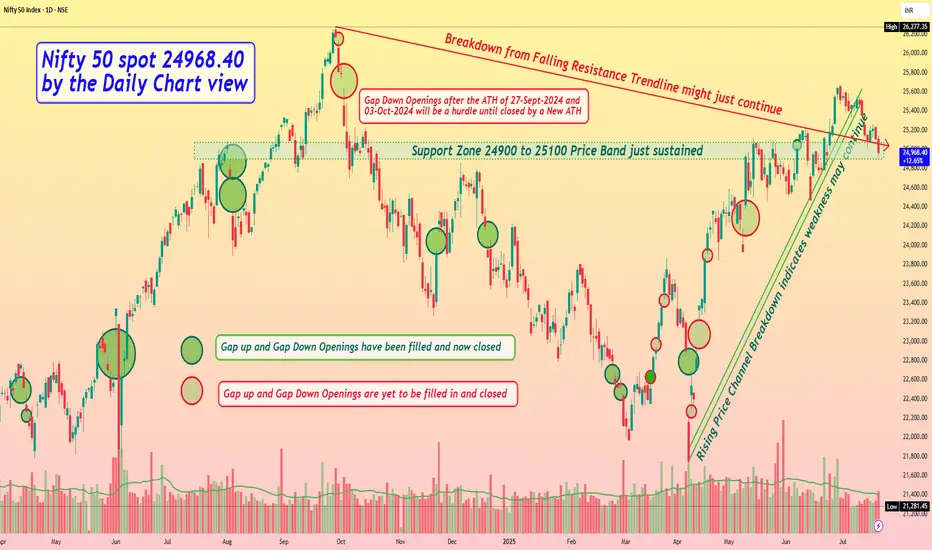
Nifty 50 spot 24968.40 by the Daily Chart view - Weekly updateNifty 50 spot 24968.40 by the Daily Chart view - Weekly update
- Support Zone 24900 to 25100 Price Band just sustained
- Next Support Zone seen at 24325 to 24500 of the Nifty Index
- Breakdown from Falling Resistance Trendline might just continue
- Rising Price Channel Breakdown indicates weakness might continue
- Resistance Zone 25250 to 25400 then ATH 26277.35 of Nifty Index levels
Nifty Key Levels for 17.07.2025Nifty Key Levels for 17.07.2025
If Nifty breaks the upper or lower range, we can expect momentum. The consolidation zone will be favorable for option sellers,while a breakout on either side will benefit option buyers.
Disclaimer:
I'm not a SEBI Registered financial advisor. These views are purely educational in nature. You are solely responsible for any decisions made based on this research.
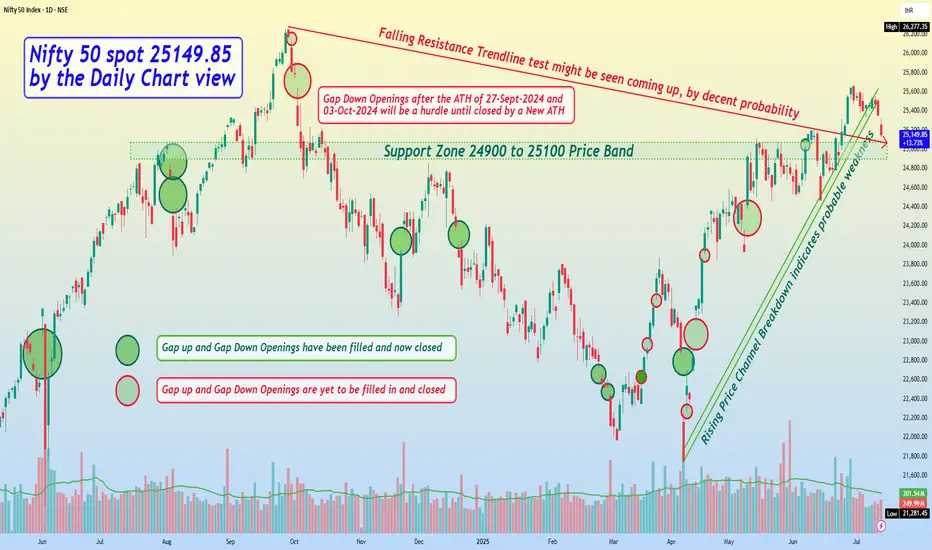
Nifty 50 spot 25149.85 by the Daily Chart view - Weekly updateNifty 50 spot 25149.85 by the Daily Chart view - Weekly update
- Support Zone 24900 to 25100 Price Band, yet sustained
- Next Support Zone seen at 24325 to 24500 of the Nifty Index
- Resistance Zone 25860 to 26035 then ATH 26277.35 of Nifty Index levels
- Rising Price Channel Breakdown indicates probable weakness to see following
- Falling Resistance Trendline test might be seen coming up, by decent probability
- Nifty Index keeping within self drawn limits and shying away at each attempt towards 26000
Green or Red Which path Bajaj Finance will take ?Bajaj Finance is currently consolidating, showing potential for a strong move in either direction. A bullish breakout could lead to an uptrend, while a bearish breakdown may signal a decline. The stock is forming a base, and whichever path it takes next may define its trend for the coming weeks.
Institutional TradingDefinition:
Institutional trading refers to the buying and selling of financial securities by large organizations such as mutual funds, pension funds, insurance companies, hedge funds, and investment banks.
Key Characteristics:
High-volume transactions
Lower transaction costs due to bulk orders
Direct access to market liquidity
Use of advanced trading algorithms and platforms
Example Institutions:
BlackRock
Vanguard
Goldman Sachs
Who are Institutional Traders?
Types of Institutional Traders:
Mutual Funds: Trade for large-scale portfolio diversification.
Pension Funds: Focused on long-term stable returns.
Hedge Funds: Seek high returns with complex strategies.
Insurance Companies: Invest premiums for steady growth.
Investment Banks: Trade for proprietary gains and clients.
How They Operate:
Work with large research teams
Utilize proprietary trading algorithms
Influence market prices significantly

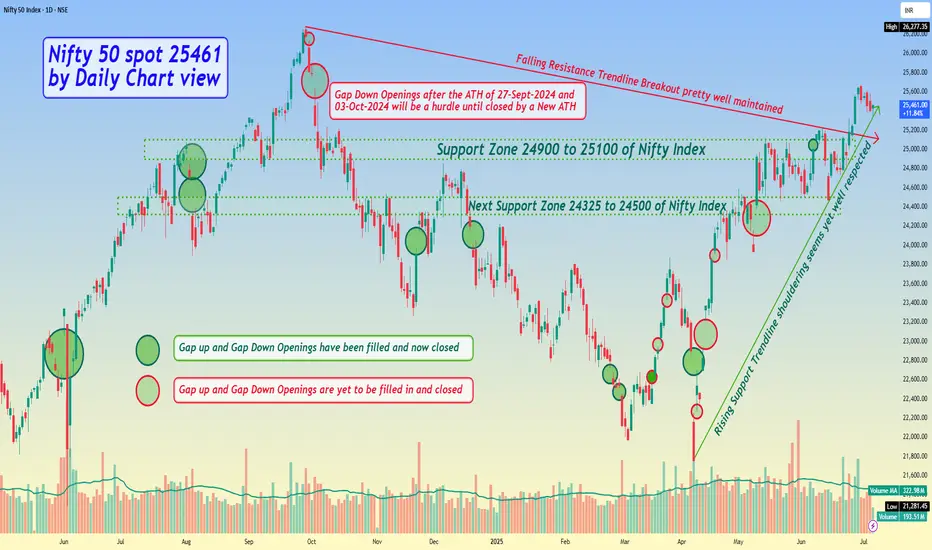
Nifty 50 spot 25461 by Daily Chart view - Weekly updateNifty 50 spot 25461 by Daily Chart view - Weekly update
- Support Zone 24900 to 25100 of Nifty Index
- Next Support Zone 24325 to 24500 of Nifty Index
- Resistance Zone 25860 to 26035 then ATH 26277.35 of Nifty Index levels
- Nifty Index retraced by unwarranted events and to a good extent by profit booking
- Nifty Index is shying away to sustain any upside towards 26000 and falling down flat face
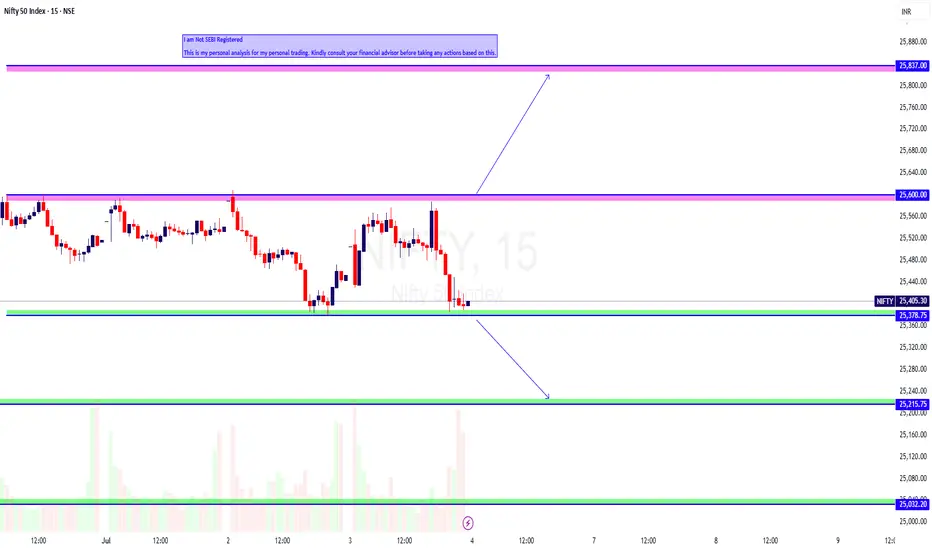
NIFTY Intraday Trade Setup For 4 Jul 2025NIFTY Intraday Trade Setup For 4 Jul 2025
Bullish-Above 25600
Invalid-Below 25550
T- 25837
Bearish-Below 25370
Invalid-Above 25420
T- 25215
NIFTY has closed on a slight bearish note with 0.19% cut today. Index has turned sell on rise since it has closed below PDL on 30 Jun. Buy on dip approach sentiment will be activated again if it closes above PDH in daily TF. Coming to Friday's trade setup, if index opens flat and a 15 Min candle closes above 25600 then will long , level has been tested multiple times in intraday. Short below 25370. A good flow below the same can be expected on flat opening.
In case of a big gap up/down, wait till 10 o'clock and mark the high and low of the trading range (5MIN). Trade on this range breakout.
==========
I am Not SEBI Registered
This is my personal analysis for my personal trading. Kindly consult your financial advisor before taking any actions based on this.
NSE:BAYERCROP - MOVING FURTHER UP.Stock Summary : Bayer CropScience is engaged in Agri Care business which primarily includes manufacture, sale and distribution of insecticides, fungicides, herbicide and various other agrochemical products and corn seeds.
Technical Setup :
Bayer Crop on daily time frame crossed and closed above a important level of 6259.70. The Stock has been moving on the upside continiously on a daily time frame which clearly shows buyers strength.
The Stock was in a consilidation zone since Feburary 2025 till May 2025 and finally on May 27 2025 the stock opened gap up with high volume confirming it which is nothing but a Runaway gap.
The Higher level of 5,302.95 level which acted as a resistance druring consolidation was retested after few days and the stock witnessed buying again ultimately crossing an important level of 6259.70 as mentined above.
Indicators :
MACD indicator already above central line and positive crossover indicates a positive monetum to continue.
ADX indicator is at 36.31 along with +DI above - DI whcih shows strength in upside direction.
ATR(Average True Range) is rising which signals volatilty increasing and is at 184.56 which means aveage movement of the stock is near 184.56.
Now, Once the stock moves above 6368.50 level and gives a close above it a upside towards R1- 6,558.00 can be seen on the charts and next level would be R2 - 6722.10. A support on the downside would be S1 -6187.35
Support and Resitance Levels :
R1 - 6368.50 S1 - 6259.70
R2 -6558.00 S2 - 6187.35
R3 - 6722.10
Estimated time to reach Resistance on the upside is expected to be 10-15 days.
Disclaimer : I am not a SEBI REGISTERED RESEARCH ANALYST AND INVESTMENT ADVISER." This analysis is intended solely for informational and educational purposes and should not be interpreted as financial advice. It is advisable to consult a qualified financial advisor or conduct thorough research before making investment decisions.
Like, Comment and Share

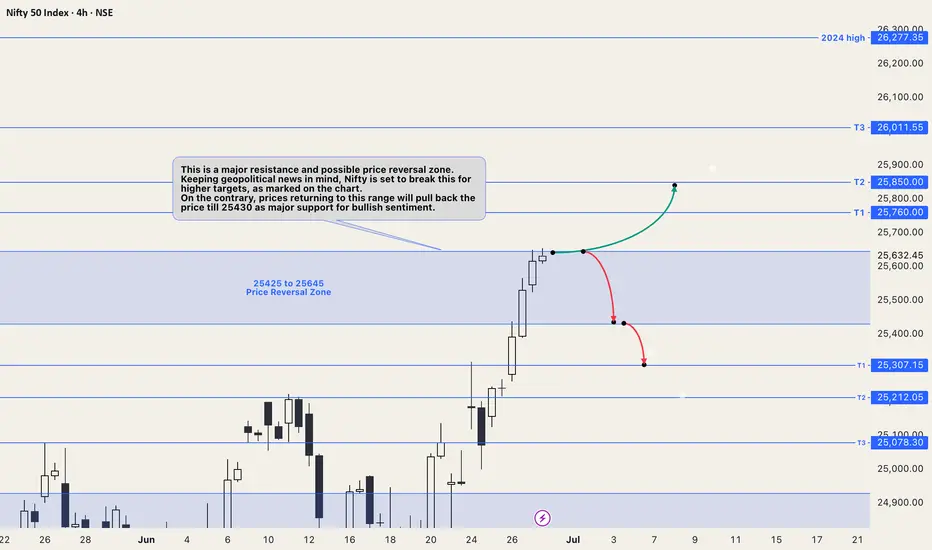
Nifty chart updates for this coming weekThis is a major resistance and possible price reversal zone. Keeping geopolitical news in mind, Nifty is set to break this for higher targets, as marked on the chart.
On the contrary, prices returning to this range will pull back the price to 25430 as major support for bullish sentiment.
All major levels for targets on both sides are mentioned on the chart. The Price trading in the blue colored range is a no-trade zone, which means it will be range-bound until it gives a breakout on either side.
NIFTY Intraday Trade Setup For 30 Jun 2025NIFTY Intraday Trade Setup For 30 Jun 2025
Bullish-Above 25685
Invalid-Below 25635
T- 25885
Bearish-Below 25520
Invalid- Above 25570
T- 25340
NIFTY has closed on a bullish note last week. It gave a range breakout which was valid for more than a month. It is at a striking distance to ATH which may be taken out in the coming weeks. 25500 is a strong intraday support zone. We have planned a sell below the same (25520), but consider only in the second attempt. In case of a pullback breakout above 25685 we will long for the target of 25685. 25685-25930 will be a resistance zone in intraday.
In case of a big gap up/down, wait till 10 o'clock and mark the high and low of the trading range (5MIN). Trade on this range breakout.
==========
I am Not SEBI Registered
This is my personal analysis for my personal trading. Kindly consult your financial advisor before taking any actions based on this.
