Niftyparallel channel formation in progress
however thr is a supply on high arnd 2400-24350 levels.
mostly breadth is oversold, and stocks near support. good chance to bounce
NIFTY

My nifty intraday trend analisys 27/06/2025Pattern: Nifty is forming a Bottleneck Pattern, which generally supports bullish continuation after a tight consolidation.
Today’s View:
Market may open near 25600
Can test 25625 (1st Resistance)
Then may jump to 25700 if consolidation sustains
Due to Bottleneck, major correction unlikely
📊 Sideways Area – Where is the Range?
✅ Sideways Range (Today)
👉 When Nifty is between resistance and support zones without breakout:
🔸 From 🔸 To 🔄 Status
25460 25625 📉 Sideways Zone
25460 = Immediate support
25625 = First major resistance
Between these levels, Nifty may consolidate to build momentum before breakout.
🔐 Key Levels (Support & Resistance)
Support Resistance
25460 (strong) 25625 (primary)
25389 (backup) 25700 (target)
25300 (fail-safe) 25789 (extreme)
🎯 Strategy Suggestion
Market Condition Action Strategy
In Sideways (25460–25625) Wait / Scalping Low risk trades
Breaks 25625 & sustains Buy (BOD) Target: 25700–25789
Breaks below 25460 Use SOR cautiously SL tight
📌 Trading Tips:
Use 1-hour candle body-to-body
Observe Volume + Price Action + 15min candle close for breakout confirmation.

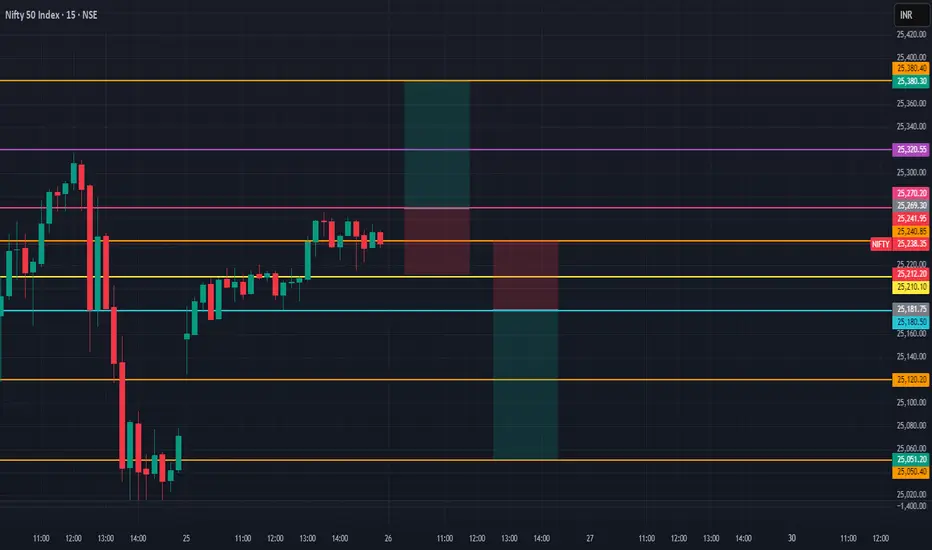
NIFTY Levels For Intraday (Educational Purpose) 29/06/2025📊 Nifty Intraday Plan (for 1-Min Chart Traders) – 26th June
🟢 Gap-Up Opening Strategy
✅ Buy above: 25,270
🎯 Targets: 25,320 / 25,380
🛑 SL: 25,210
⚠️ Avoid entry if no strong volume or if price gets rejected near 25,300.
🔴 Gap-Down Opening Strategy
✅ Sell below: 25,180
🎯 Targets: 25,120 / 25,050
🛑 SL: 25,240
⚠️ Avoid selling if Nifty holds above 25,200 after 15 mins.
📍 Use 1-min chart with candle + volume confirmation.
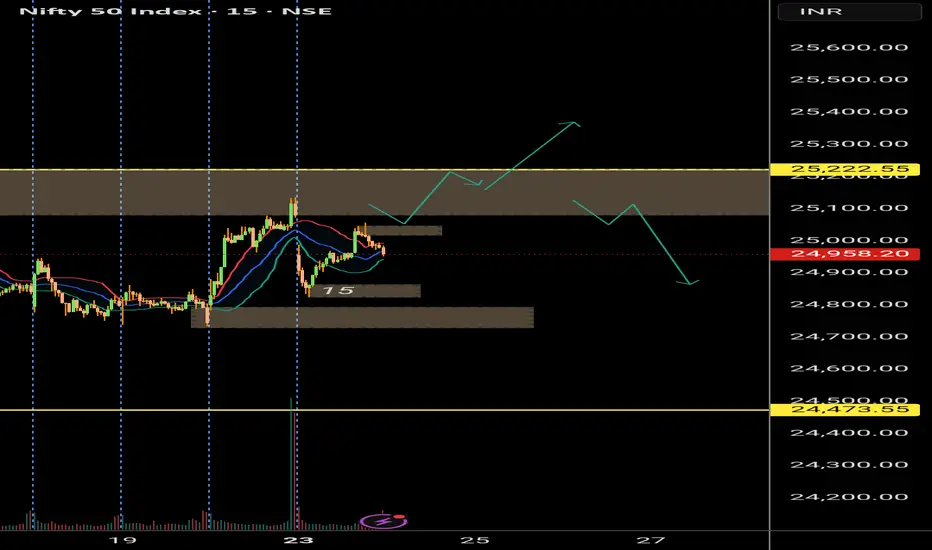
NIFTY - range breakout possible nowThis breakout is possible because of ceasefire possibility & crude price fall.
25,230 if breaks we enter bullish territory.
As per 15 mins chart 25070 could have acted as resistance. Next is 25,222.
After 25070 crosses, as gapup (high probability) 25,222 is possible.
We need to see how candles are forming.
If each candle making only making only higher close than previous we need stay in trade.
Also today there is SENSEX expiry.
So.. need be aware of it.
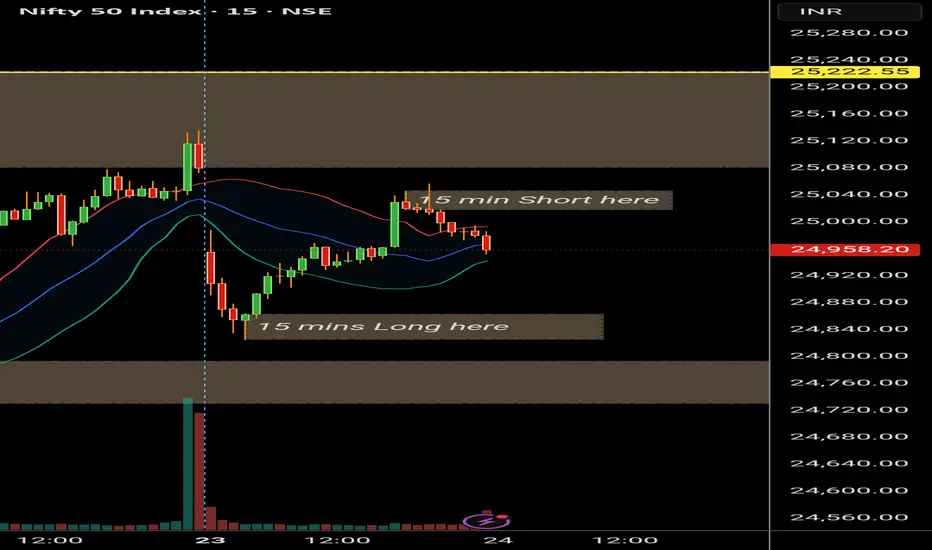
NIFTY: Don't fiddle in the middleAs shown in the chart, Long and short zones are identified. Outside box are SL.
Box to box movement is what we really want, but 1:2, 1:3 profits can be collected
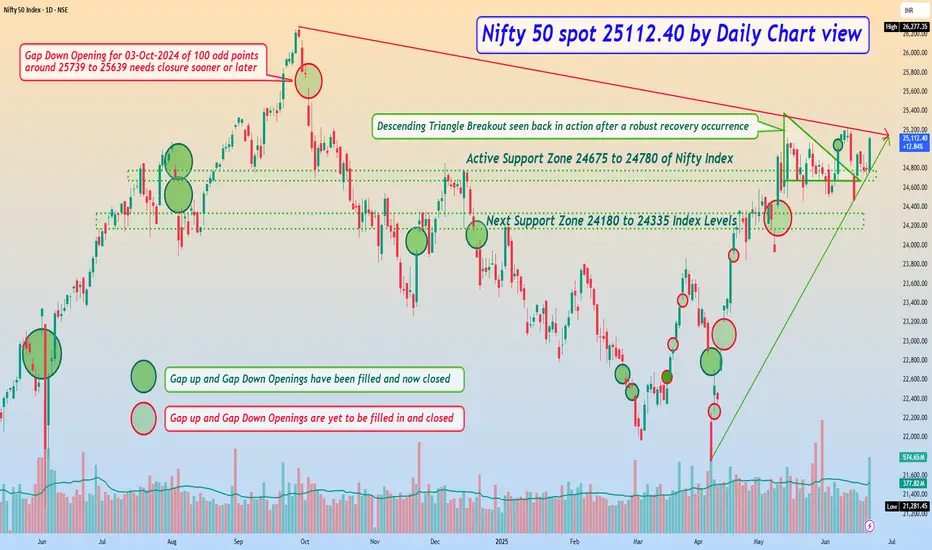
Nifty 50 spot 25112.40 by Daily Chart view - Weekly update*Nifty 50 spot 25112.40 by Daily Chart view - Weekly update*
- Active Support Zone 24675 to 24780 of Nifty Index
- Next Support Zone 24180 to 24335 of Nifty Index Levels
- Resistance Zone seen at 25200 to 25335 of Nifty 50 Index Levels
- Descending Triangle Breakout seen back in action after a robust recovery occurrence
- *Rising Support Trendline seems to have come into active mode but yet needs a stronghold*
Nifty 50 spot 24112.40 by Daily Chart view - Weekly update**Nifty 50 spot 24112.40 by Daily Chart view - Weekly update*
- Active Support Zone 24675 to 24780 of Nifty Index
- Next Support Zone 24180 to 24335 of Nifty Index Levels
- Resistance Zone seen at 25200 to 25335 of Nifty 50 Index Levels
- Descending Triangle Breakout seen back in action after a robust recovery occurrence
- *Rising Support Trendline seems to have come into active mode but yet needs a stronghold*

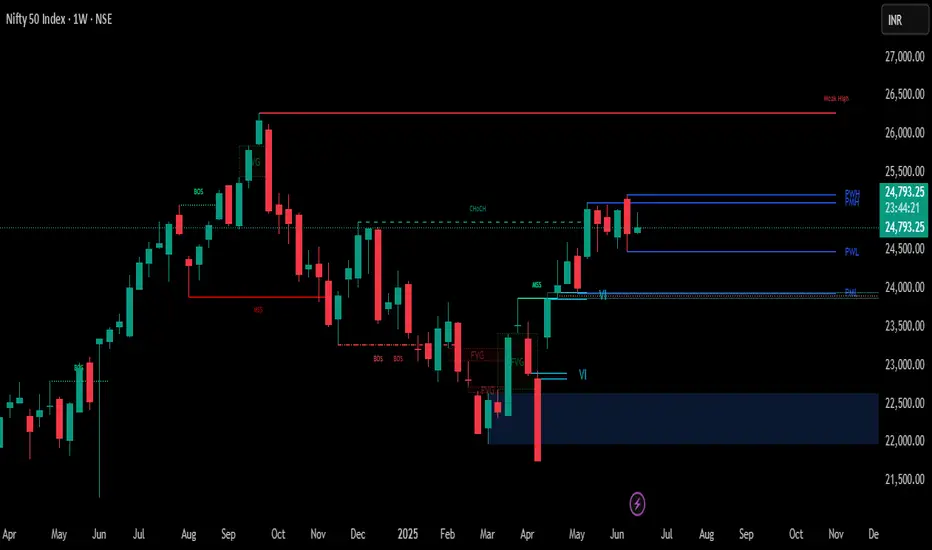
Nifty Thought Process and Analysis (Multi-Timeframe Breakdown)🔹 4H Timeframe (Intraday to Short-Term Swing)
Current Price: ~24,807
Price is consolidating inside a liquidity pocket just below a Fair Value Gap (FVG) zone.
Sell-side liquidity has already been swept; signs of accumulation are visible.
Three internal FVGs identified—market is respecting these inefficiencies.
Volume imbalance + EQ (Equal Lows) and previous OB (Order Block) show that price may be building a base.
Market Structure: Minor BOS (Break of Structure) observed, but no new HH yet — compression inside a range.
✅ Bullish Bias IF price breaks above the FVG range and mitigates the supply.
📌 Long Setup Idea:
Entry: Above 24,900
Stop Loss: Below EQ/FVG (~24,650)
Target: 25,200–25,400 (Buy-side liquidity/weak high zone)
📛 Invalidation: Clean break below EQ zone + OB → indicates bearish continuation.
🔹 Daily Timeframe (Swing View)
Price respected the sell-side liquidity grab and is now consolidating within a bearish FVG range.
Minor BOS confirms short-term bullish correction, but macro context is mixed.
PWL (Previous Week Low) has been swept, giving confluence to bullish short-term reversal.
Upper FVG near 25,100–25,200 remains unmitigated.
🧠 Key Observation: Smart money often reverses price after sweeping liquidity → the VI (Volume Imbalance) zone may act as a launchpad.
🔹 Weekly Timeframe (Macro Structure)
Structure remains bullish with strong upside momentum since the March-April reversal.
Change of Character (ChoCH) in April is confirmed with multiple BOS candles.
Current price is holding above the weekly FVG + VI.
A large bullish OB sits between 22,400–22,800, indicating massive institutional accumulation.
📈 Weekly Bias: As long as price stays above 24,400, bullish targets of 25,600 are possible in coming weeks.
🧩 Conclusion & Trade Idea Summary (ICT-based)
Bias: Bullish (Short-term accumulation, preparing for expansion)
Entry: Break and close above 24,900 on 4H or Daily
Stop Loss: 24,640 (Below EQ zone/FVG boundary)
TP1: 25,200 (Buy-side liquidity)
TP2: 25,400–25,600 (Weekly premium zone/weak high)
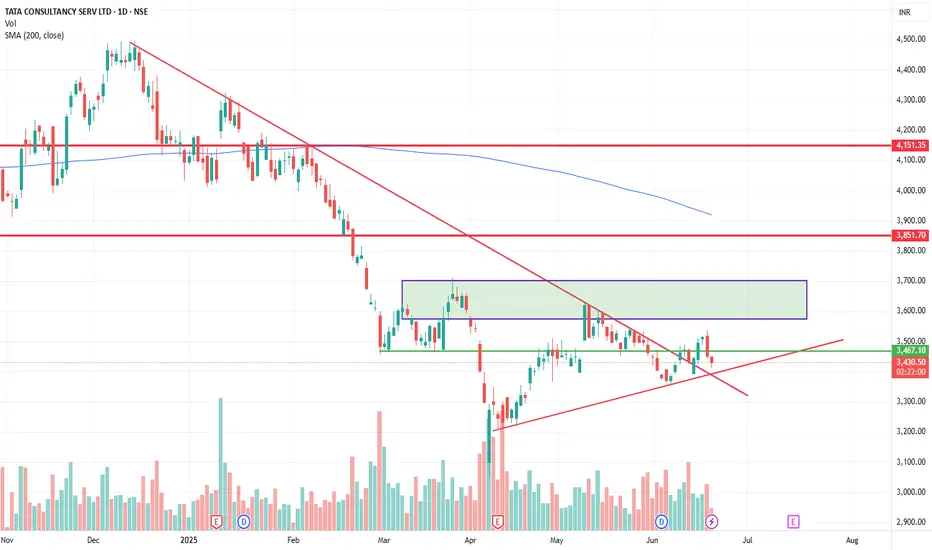
TCS Strong Support at ₹3360 | Breakout Above ₹3700ata Consultancy Services (TCS) is showing strong support near ₹3360 levels. A potential breakout will be confirmed if the price sustains above ₹3700.
Currently, the stock is facing key resistance zones between ₹3512 and ₹3525. A successful close above these levels may lead to strong bullish momentum.
📌 Key Levels:
Support: ₹3360
Resistance Zones: ₹3512 – ₹3525
Breakout Confirmation: Above ₹3700
Traders should watch these levels closely for directional cues. Volume confirmation and price action around resistance will be crucial.
#TCS #TCSshare #NSEStocks #StockAnalysis #BreakoutStocks #TradingViewIndia #TCSBreakout #IndianStocks #TechnicalAnalysis #SwingTrade
🔔 Disclaimer:
This analysis is for educational and informational purposes only. It is not a buy or sell recommendation. Please do your own research or consult a financial advisor before making any trading decisions. Trading and investing involve risk.
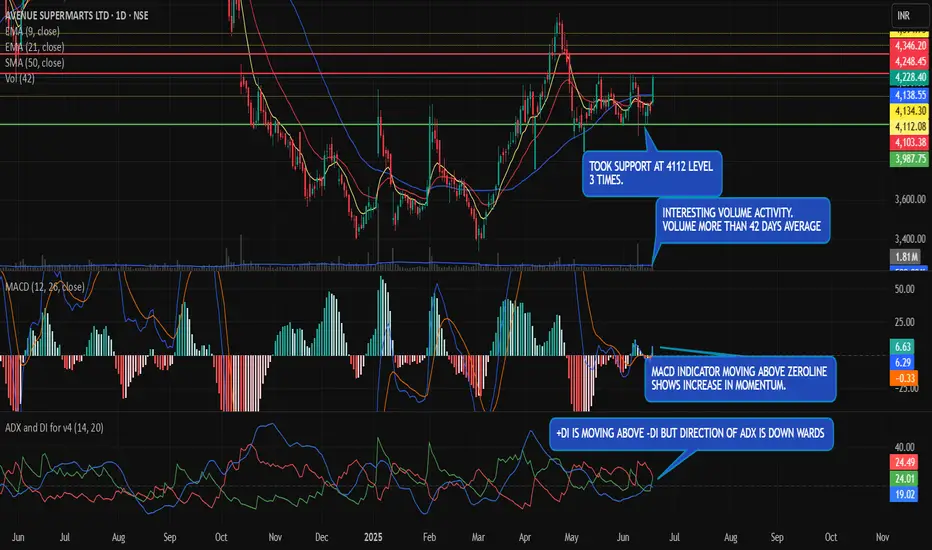
AVENUE SUPERMART AN INTERESTING MOVEMENT.DMART Stock came into notice after a strong bullish candle with above average volume.
The stock is taking support at 4112 multiple times which makes the level even more strong support.
A close above 4248-4250 level will give a confirmation on upside momentum on daily time frame which can push the stock towards 4346 which is next resistnce level.
The 50 day SMA is also evelving and the driection of the moving average is moving upwards. A more confidence can be seen in momentum when 21 day EMA (blue colour) and 9 day EMA (red colour) crosses above 50 day SMA.
Resistance :
1) 4248-4250
2) 4346
Support :
1) 4134
2) 3987
Discaimer & Disclosure : I am not a SEBI regitered reserch Analyst. This is purely for Educational purpose only.
Nifty June Iron Condor Strategy–Range is Back Premiums are JuicyHello Traders!
Here’s a plan for calm minds who want to generate passive monthly income by leveraging the power of non-directional option selling. Based on the current Nifty structure and OI data, I’ve spotted a new range-bound opportunity — perfect for executing a safe, hedged Iron Condor setup.
Why This Strategy Now? (Based on Chart Analysis)
Resistance Zone: 25400-25500 (Heavy supply, multiple rejection visible)
Support Zone: 23400-23500 (Major bounce levels, strong OI support)
Nifty is currently trading near 24500, well inside this range — perfect for deploying a neutral premium-selling setup.
Strategy Setup (Iron Condor – 26 June 2025 Monthly Expiry)
Sell 25400 CE @ ₹123
(to protect upside move rejection)
Buy 25800 CE @ ₹56
(risk protection on breakout)
Sell 23650 PE @ ₹99
(to protect downside move rejection)
Buy 23200 PE @ ₹51.4
(risk protection on breakdown)
Strategy Highlights
(Screenshot – )
Why This Works? (OI Logic + Technical View)
Strong resistance visible at 25400–25500 zone with rising CE OI
Solid put writing zone at 23400–23500 — confirms downside support
Volatility is stable, time decay is in our favor — perfect for Iron Condor writers
Risk Management & Exit Plans
Exit early if either side breaks with volume
Don’t hold till expiry — aim to exit around 70–80% max profit
Always keep SL alert at breakdown range breaches
Rahul’s Tip
"Option writing is not for thrill, it’s for discipline. Iron Condor is a weapon when range is visible — use it like a sniper, not like a gambler."
Conclusion
If your view is Nifty likely to stay between 23400–25400 for the next few weeks, this Iron Condor setup offers high-quality time-based potential. Use proper lot sizing and risk control — let the theta do the work for you!
Have you ever deployed an Iron Condor on Nifty? What was your experience? Drop your thoughts in the comments!
If you liked this post, don’t forget to LIKE and FOLLOW!
I regularly share high-quality trading setups based on real analysis, OI data, and smart risk-managed strategies.
Disclaimer: This analysis is for educational purposes only. Please consult a financial advisor before making investment decisions.

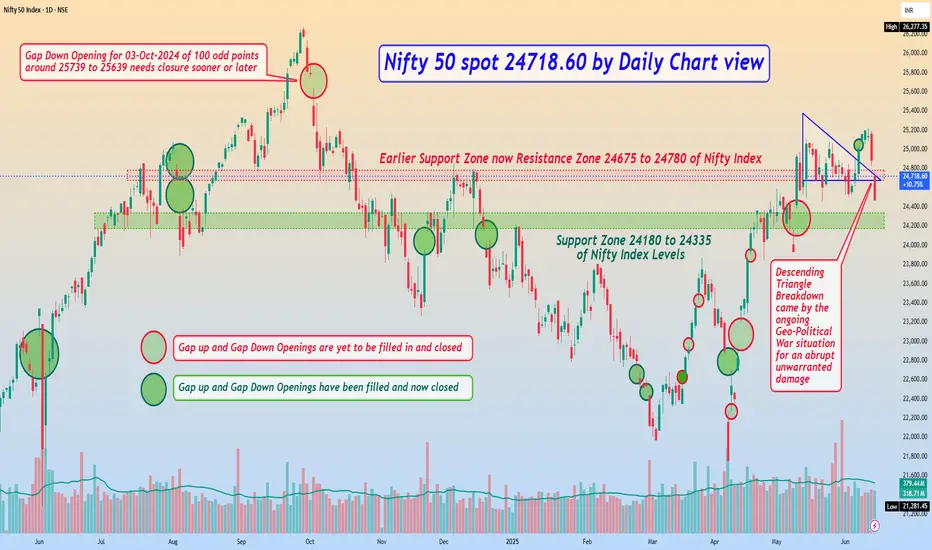
Nifty 50 spot 24718.60 by Daily Chart view - Weekly UpdateNifty 50 spot 24718.60 by Daily Chart view - Weekly Update
- Support Zone 24180 to 24335 of Nifty Index Levels
- Earlier Support Zone now Resistance Zone 24675 to 24780 of Nifty Index
- Descending Triangle Breakdown came by the ongoing Geo-Political War situation for an abrupt unwarranted damage
Dividend Investing & High-Yield StocksTopic: Dividend Investing & High-Yield Stocks
Slide 1: Introduction to Dividend Investing
What is Dividend Investing?
Dividend investing involves buying shares of companies that regularly pay out a portion of their earnings to shareholders. These payments, called dividends, are usually distributed quarterly and serve as a steady income source.
Why It Matters:
Generates passive income
Offers compounding returns when reinvested
Often signals strong, stable companies
Ideal For:
Long-term investors
Income-focused portfolios
Retirees looking for stable cash flow
Slide 2: Understanding High-Yield Stocks
Definition:
High-yield stocks offer a dividend yield significantly higher than the market average. Yield = Dividend per Share ÷ Share Price.
Pros:
Higher income returns
Potential price appreciation
Strong incentive for holding
Risks:
Yield traps (unsustainable payouts)
Sector-specific concentration (REITs, utilities)
Sensitivity to interest rate changes
Slide 3: Key Metrics to Analyze
1. Dividend Yield – High isn't always better; compare with industry peers.
2. Payout Ratio – % of earnings paid as dividends (ideal: <60%).
3. Dividend History – Consistent and increasing dividends show reliability.
4. Free Cash Flow – Enough cash to support future dividends.
5. Debt Levels – Too much debt may affect dividend sustainability.
Slide 4: Popular High-Yield Sectors
REITs (Real Estate Investment Trusts)
Utilities
Telecom
Energy/Oil & Gas
MLPs (Master Limited Partnerships)
These sectors often have regulated income or asset-backed cash flow streams, making them stable dividend payers.
Slide 5: Example High-Yield Stocks (India & Global)
India:
Coal India
Power Grid Corp
REC Ltd
ITC Ltd
Global:
AT&T
Verizon
Realty Income Corp (O)
Altria Group (MO)
Ensure to check for recent financial updates before investing.
Slide 6: Dividend Growth vs High Yield
Dividend Growth Stocks: Lower yield, but consistent increases (e.g., Infosys, HDFC Bank)
High-Yield Stocks: High immediate income, but riskier if growth lags
Balanced Approach: Combine both types for income and capital growth.

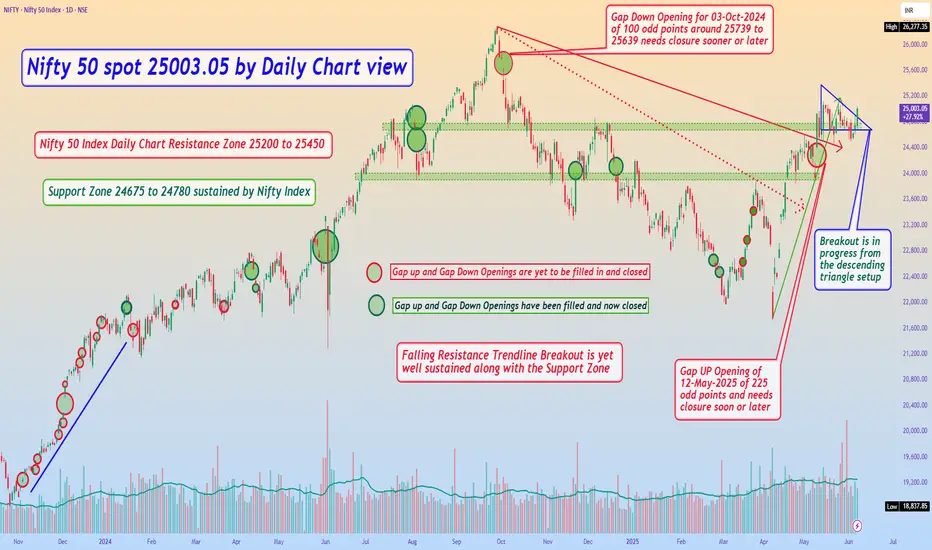
Nifty 50 spot 25003.05 by Daily Chart view - Weekly UpdateNifty 50 spot 25003.05 by Daily Chart view - Weekly Update
- Support Zone 24675 to 24780 sustained by Nifty Index
- Nifty 50 Index Daily Chart Resistance Zone 25200 to 25450
- Breakout seems in progress from the descending triangle setup
- Gap UP Opening of 12-May-2025 of 225 odd points, needs closure sooner or later
- *Nifty 50 Index yet lagging well behind to create a New ATH unlike the Bank Nifty Index*
Option Chain AnalysisTo read an options chart effectively, consider the following steps:
Identify the strike price associated with each line on the chart.
Observe the direction and steepness of the lines to gauge the options' delta values. ...
Assess the options' positions concerning the current market price of the underlying asset.

Basic to Advance in Trading Understand market trends and patterns.
Use risk management strategies, like setting stop-loss orders.
Focus on liquid assets with high volume.
Keep emotions in check and stick to a trading plan.
Limit the number of trades to manage risk.
Constantly educate yourself on market dynamics and trading strategies.

Class for Advanced Trader part 2To understand how to become a trader, follow these seven steps:
Complete your education. ...
Learning the basics of trading. ...
Determine the product in which you want to trade. ...
Develop trading techniques. ...
Gain trading experience. ...
Understand risk management. ...
Review your trades.

Class for Advanced Trader Advanced trading strategies usually involve multiple technical indicators and more complicated instruments, such as options and futures.

Put Call Ratio (PCR) Trading The Put Call Ratio (PCR) is a tool in the stock market to understand how investors feel about a stock or the market's future. It compares the number of put options to call options traded. More puts traded mean investors expect prices to fall (bearish). More calls traded mean investors expect prices to rise (bullish).

Divergence Test Divergence is when the asset price moves in the direction opposite to what a technical indicator indicates. When a stock is diverging, it signals weaker price trends and the beginning of a reversal.

Price Action Trading Price action trading is based on analyzing the raw movement of price over time without relying heavily on indicators. It involves picking out key levels, reviewing candlestick patterns, and recognizing reversal and continuation setups to capitalize on market opportunities.

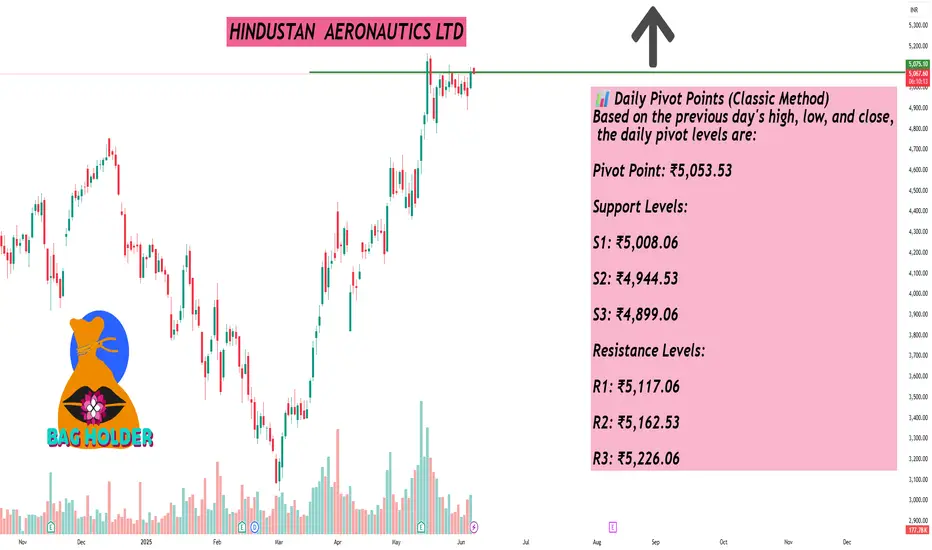
HINDUSTAN AERONAUTICS LTDAs of June 6, 2025, Hindustan Aeronautics Ltd. (NSE: HAL) is trading at approximately ₹5,071.60, reflecting a 2.25% increase over the previous day. Here's a detailed technical analysis focusing on daily support and resistance levels:
📊 Daily Pivot Points (Classic Method)
Based on the previous day's high, low, and close, the daily pivot levels are:
Pivot Point: ₹5,053.53
Support Levels:
S1: ₹5,008.06
S2: ₹4,944.53
S3: ₹4,899.06
Resistance Levels:
R1: ₹5,117.06
R2: ₹5,162.53
R3: ₹5,226.06
📈 Fibonacci Pivot Points
Using Fibonacci calculations, the levels are:
Pivot Point: ₹5,053.53
Support Levels:
S1: ₹5,011.90
S2: ₹4,986.17
S3: ₹4,944.53
Resistance Levels:
R1: ₹5,095.17
R2: ₹5,120.90
R3: ₹5,162.53
🔍 Camarilla Pivot Points
Derived using the Camarilla method:
Pivot Point: ₹5,053.53
Support Levels:
S1: ₹5,061.61
S2: ₹5,051.62
S3: ₹5,041.63
Resistance Levels:
R1: ₹5,081.59
R2: ₹5,091.58
R3: ₹5,101.58
📌 Trading Insights
Immediate Support: ₹5,008.06 (Classic S1)
Immediate Resistance: ₹5,117.06 (Classic R1)
Given the current price of ₹5,071.60, the stock is trading near its pivot point, suggesting potential for upward movement if it breaks above the immediate resistance. However, traders should monitor for any signs of reversal or consolidation around these levels.
L&T FINANCE LTDAs of June 6, 2025, L&T Finance Ltd. (NSE: LTF) is trading at approximately ₹180.82. Here's a detailed technical analysis focusing on daily support and resistance levels:
📊 Daily Pivot Points (Classic Method)
Calculated based on the previous day's high, low, and close prices:
Pivot Point: ₹180.82
Support Levels:
S1: ₹177.34
S2: ₹171.32
S3: ₹167.84
Resistance Levels:
R1: ₹186.84
R2: ₹190.32
R3: ₹196.34
📈 Fibonacci Pivot Points
Based on Fibonacci calculations:\
Pivot Point: ₹180.82
Support Levels:
S1: ₹177.19
S2: ₹174.95
S3: ₹171.32
Resistance Levels:
R1: ₹184.45
R2: ₹186.69
R3: ₹190.32
🔍 Camarilla Pivot Points
These levels are derived using the Camarilla method:
Pivot Point: ₹180.82
Support Levels:
S1: ₹182.49
S2: ₹181.62
S3: ₹180.75
Resistance Levels:
R1: ₹184.23
R2: ₹185.10
R3: ₹185.97
📌 Trading Insights
Immediate Support: ₹177.34 (Classic S1)
Immediate Resistance: ₹186.84 (Classic R1)
Traders may consider these levels for setting stop-loss and take-profit orders. A break above ₹186.84 could signal bullish momentum, while a drop below ₹177.34 might indicate bearish pressure.
