NIFTY Intraday Trade Setup For 21 Jul 2025NIFTY Intraday Trade Setup For 21 Jul 2025
Bullish-Above 25015
Invalid-Below 24965
T- 25150
Bearish-Below 24910
Invalid-Above 24960
T- 24640
NIFTY has closed on a slight bearish note with 0.72% cut last week. Index has reached 50 EMA in daily TF which is placed near 24900. A bounce from EMA can be expected. However below 24900 index may dive in the next week also. On a flat opening above 25015 a bullish move towards 25150 can be expected. Intraday resistance is placed at the 25150 as per half bat pattern. On a flat opening below 24910 index will test 24640. Plan trades on 15 Min candle close.
In case of a big gap up/down, wait till 10 o'clock and mark the high and low of the trading range (5MIN). Trade on this range breakout.
==========
I am Not SEBI Registered
This is my personal analysis for my personal trading. Kindly consult your financial advisor before taking any actions based on this.
NIFTY

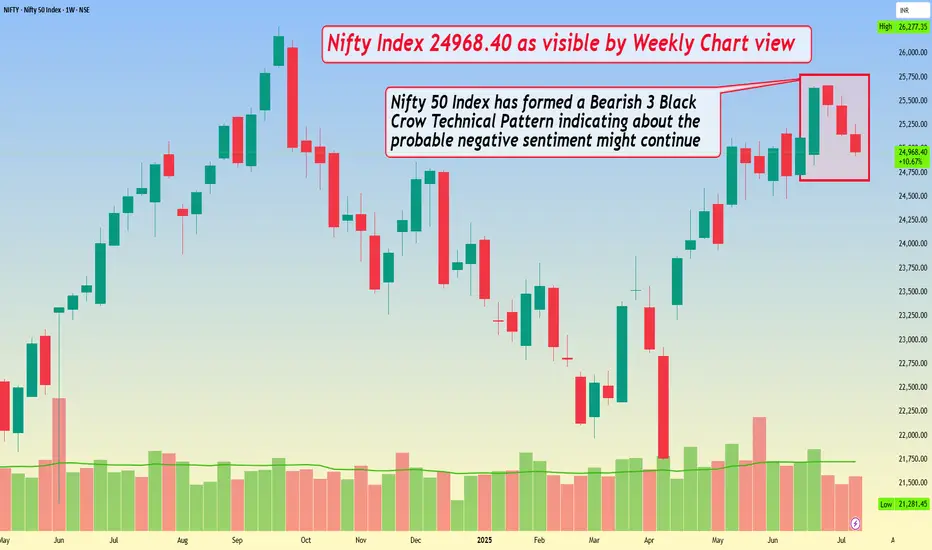
Nifty Index 24968.40 as visible by Weekly Chart viewNifty Index 24968.40 as visible by Weekly Chart view
- Nifty 50 Index has formed a Bearish 3 Black Crow Technical Pattern indicating about the probable negative sentiment might continue
- Nifty is also closely forming a sliding Bearish Double Top from ATH 26277.35 to current top 25669.35, which again syncs with the negative sentiment trend trajectory
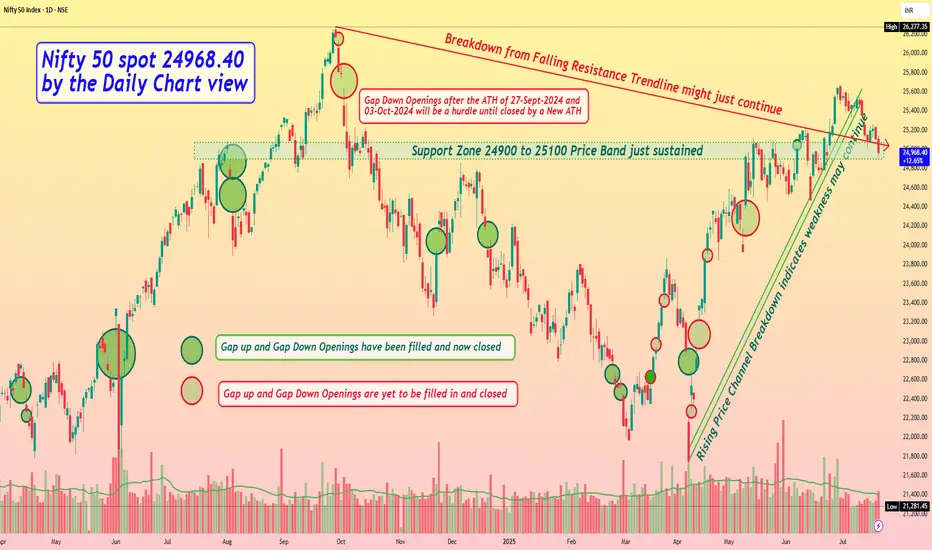
Nifty 50 spot 24968.40 by the Daily Chart view - Weekly updateNifty 50 spot 24968.40 by the Daily Chart view - Weekly update
- Support Zone 24900 to 25100 Price Band just sustained
- Next Support Zone seen at 24325 to 24500 of the Nifty Index
- Breakdown from Falling Resistance Trendline might just continue
- Rising Price Channel Breakdown indicates weakness might continue
- Resistance Zone 25250 to 25400 then ATH 26277.35 of Nifty Index levels
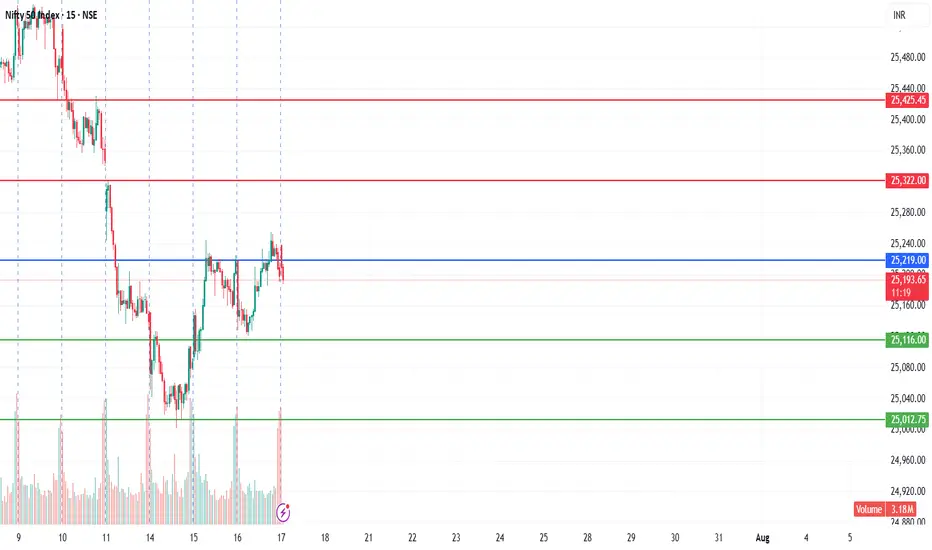
Nifty Key Levels for 17.07.2025Nifty Key Levels for 17.07.2025
If Nifty breaks the upper or lower range, we can expect momentum. The consolidation zone will be favorable for option sellers,while a breakout on either side will benefit option buyers.
Disclaimer:
I'm not a SEBI Registered financial advisor. These views are purely educational in nature. You are solely responsible for any decisions made based on this research.
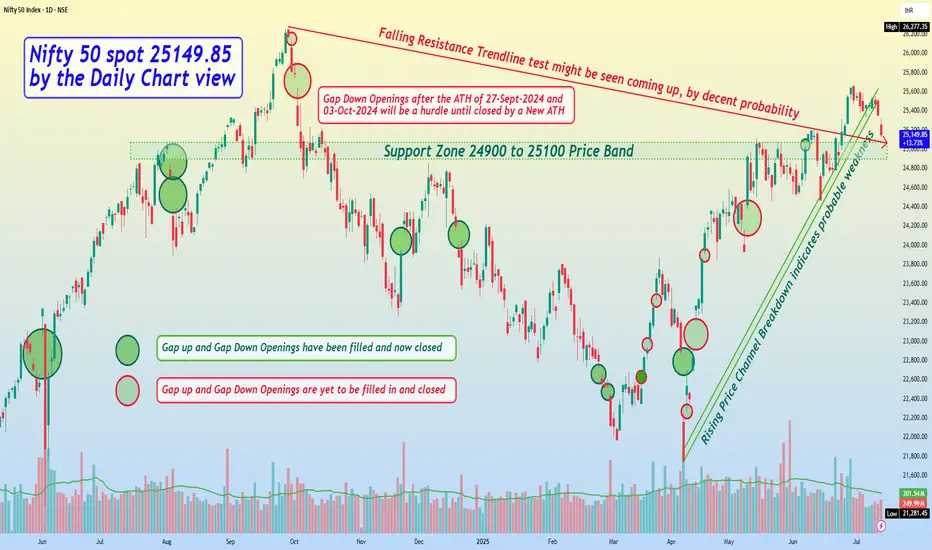
Nifty 50 spot 25149.85 by the Daily Chart view - Weekly updateNifty 50 spot 25149.85 by the Daily Chart view - Weekly update
- Support Zone 24900 to 25100 Price Band, yet sustained
- Next Support Zone seen at 24325 to 24500 of the Nifty Index
- Resistance Zone 25860 to 26035 then ATH 26277.35 of Nifty Index levels
- Rising Price Channel Breakdown indicates probable weakness to see following
- Falling Resistance Trendline test might be seen coming up, by decent probability
- Nifty Index keeping within self drawn limits and shying away at each attempt towards 26000
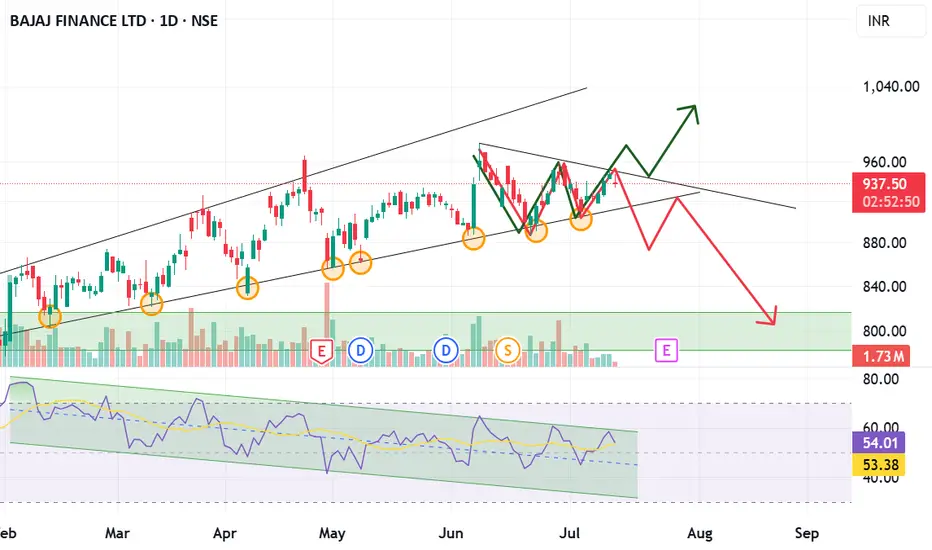
Green or Red Which path Bajaj Finance will take ?Bajaj Finance is currently consolidating, showing potential for a strong move in either direction. A bullish breakout could lead to an uptrend, while a bearish breakdown may signal a decline. The stock is forming a base, and whichever path it takes next may define its trend for the coming weeks.
Institutional TradingDefinition:
Institutional trading refers to the buying and selling of financial securities by large organizations such as mutual funds, pension funds, insurance companies, hedge funds, and investment banks.
Key Characteristics:
High-volume transactions
Lower transaction costs due to bulk orders
Direct access to market liquidity
Use of advanced trading algorithms and platforms
Example Institutions:
BlackRock
Vanguard
Goldman Sachs
Who are Institutional Traders?
Types of Institutional Traders:
Mutual Funds: Trade for large-scale portfolio diversification.
Pension Funds: Focused on long-term stable returns.
Hedge Funds: Seek high returns with complex strategies.
Insurance Companies: Invest premiums for steady growth.
Investment Banks: Trade for proprietary gains and clients.
How They Operate:
Work with large research teams
Utilize proprietary trading algorithms
Influence market prices significantly

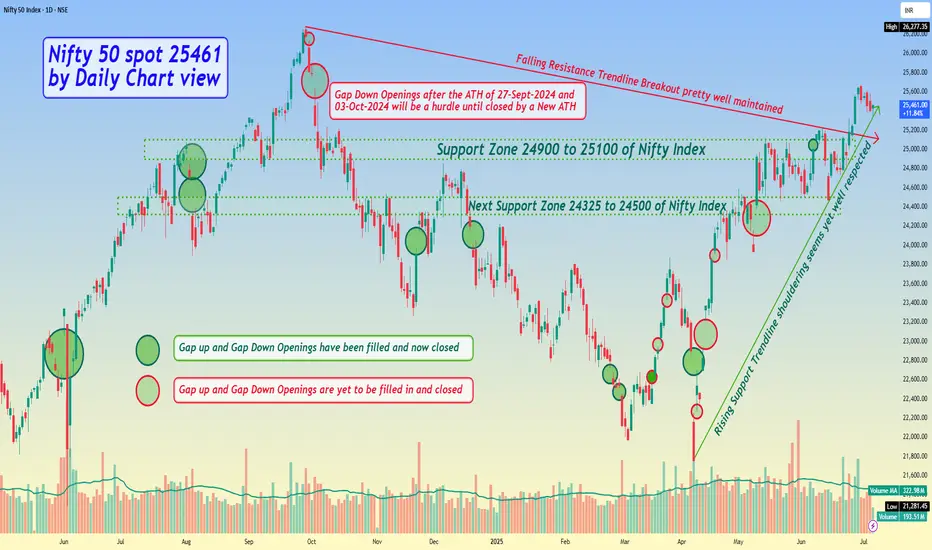
Nifty 50 spot 25461 by Daily Chart view - Weekly updateNifty 50 spot 25461 by Daily Chart view - Weekly update
- Support Zone 24900 to 25100 of Nifty Index
- Next Support Zone 24325 to 24500 of Nifty Index
- Resistance Zone 25860 to 26035 then ATH 26277.35 of Nifty Index levels
- Nifty Index retraced by unwarranted events and to a good extent by profit booking
- Nifty Index is shying away to sustain any upside towards 26000 and falling down flat face
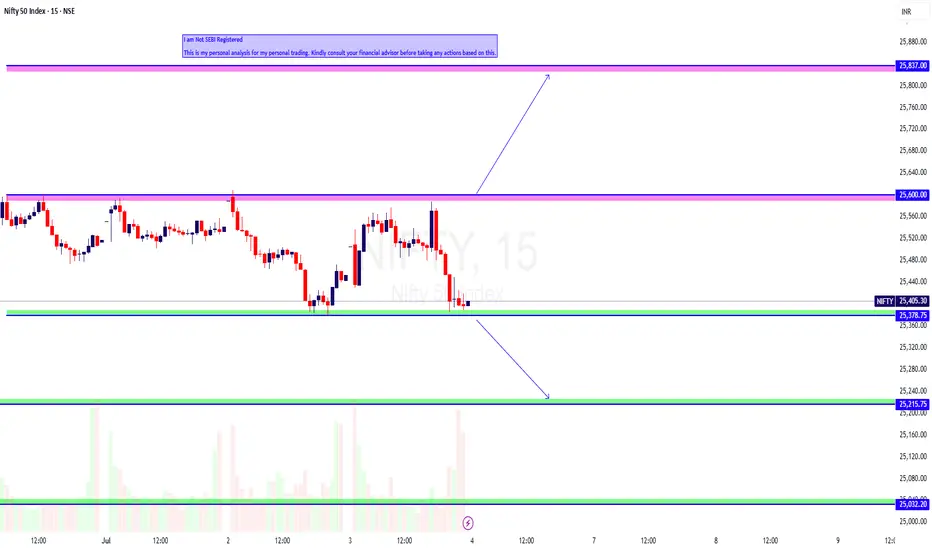
NIFTY Intraday Trade Setup For 4 Jul 2025NIFTY Intraday Trade Setup For 4 Jul 2025
Bullish-Above 25600
Invalid-Below 25550
T- 25837
Bearish-Below 25370
Invalid-Above 25420
T- 25215
NIFTY has closed on a slight bearish note with 0.19% cut today. Index has turned sell on rise since it has closed below PDL on 30 Jun. Buy on dip approach sentiment will be activated again if it closes above PDH in daily TF. Coming to Friday's trade setup, if index opens flat and a 15 Min candle closes above 25600 then will long , level has been tested multiple times in intraday. Short below 25370. A good flow below the same can be expected on flat opening.
In case of a big gap up/down, wait till 10 o'clock and mark the high and low of the trading range (5MIN). Trade on this range breakout.
==========
I am Not SEBI Registered
This is my personal analysis for my personal trading. Kindly consult your financial advisor before taking any actions based on this.
NSE:BAYERCROP - MOVING FURTHER UP.Stock Summary : Bayer CropScience is engaged in Agri Care business which primarily includes manufacture, sale and distribution of insecticides, fungicides, herbicide and various other agrochemical products and corn seeds.
Technical Setup :
Bayer Crop on daily time frame crossed and closed above a important level of 6259.70. The Stock has been moving on the upside continiously on a daily time frame which clearly shows buyers strength.
The Stock was in a consilidation zone since Feburary 2025 till May 2025 and finally on May 27 2025 the stock opened gap up with high volume confirming it which is nothing but a Runaway gap.
The Higher level of 5,302.95 level which acted as a resistance druring consolidation was retested after few days and the stock witnessed buying again ultimately crossing an important level of 6259.70 as mentined above.
Indicators :
MACD indicator already above central line and positive crossover indicates a positive monetum to continue.
ADX indicator is at 36.31 along with +DI above - DI whcih shows strength in upside direction.
ATR(Average True Range) is rising which signals volatilty increasing and is at 184.56 which means aveage movement of the stock is near 184.56.
Now, Once the stock moves above 6368.50 level and gives a close above it a upside towards R1- 6,558.00 can be seen on the charts and next level would be R2 - 6722.10. A support on the downside would be S1 -6187.35
Support and Resitance Levels :
R1 - 6368.50 S1 - 6259.70
R2 -6558.00 S2 - 6187.35
R3 - 6722.10
Estimated time to reach Resistance on the upside is expected to be 10-15 days.
Disclaimer : I am not a SEBI REGISTERED RESEARCH ANALYST AND INVESTMENT ADVISER." This analysis is intended solely for informational and educational purposes and should not be interpreted as financial advice. It is advisable to consult a qualified financial advisor or conduct thorough research before making investment decisions.
Like, Comment and Share

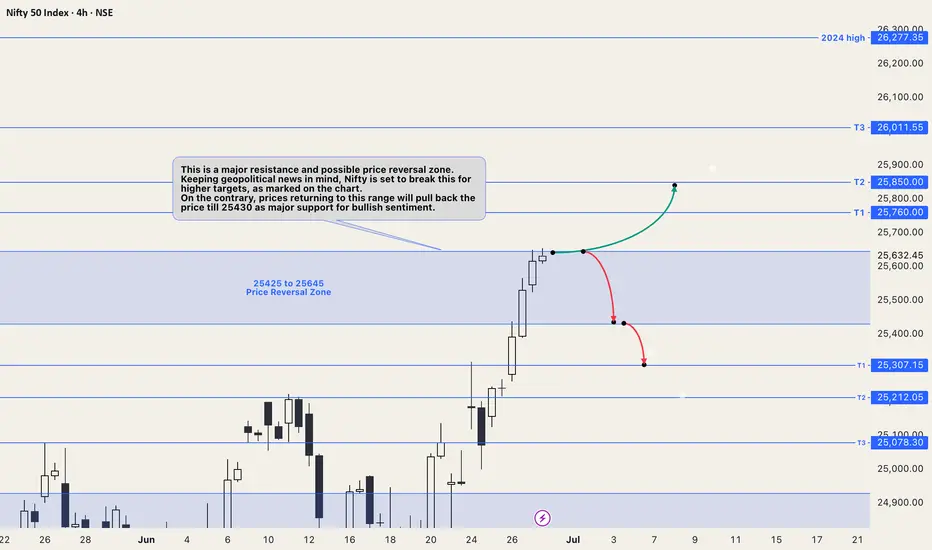
Nifty chart updates for this coming weekThis is a major resistance and possible price reversal zone. Keeping geopolitical news in mind, Nifty is set to break this for higher targets, as marked on the chart.
On the contrary, prices returning to this range will pull back the price to 25430 as major support for bullish sentiment.
All major levels for targets on both sides are mentioned on the chart. The Price trading in the blue colored range is a no-trade zone, which means it will be range-bound until it gives a breakout on either side.
NIFTY Intraday Trade Setup For 30 Jun 2025NIFTY Intraday Trade Setup For 30 Jun 2025
Bullish-Above 25685
Invalid-Below 25635
T- 25885
Bearish-Below 25520
Invalid- Above 25570
T- 25340
NIFTY has closed on a bullish note last week. It gave a range breakout which was valid for more than a month. It is at a striking distance to ATH which may be taken out in the coming weeks. 25500 is a strong intraday support zone. We have planned a sell below the same (25520), but consider only in the second attempt. In case of a pullback breakout above 25685 we will long for the target of 25685. 25685-25930 will be a resistance zone in intraday.
In case of a big gap up/down, wait till 10 o'clock and mark the high and low of the trading range (5MIN). Trade on this range breakout.
==========
I am Not SEBI Registered
This is my personal analysis for my personal trading. Kindly consult your financial advisor before taking any actions based on this.

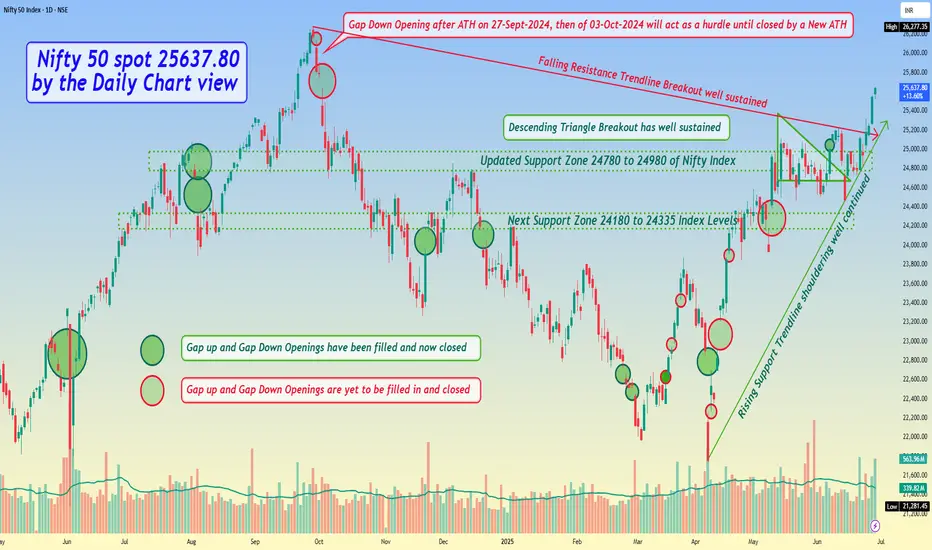
Nifty 50 spot 25637.80 by the Daily Chart view - Weekly update*Nifty 50 spot 25637.80 by the Daily Chart view - Weekly update*
- Descending Triangle Breakout has well sustained
- Immediate Support Zone 25125 to 25335 of Nifty Index
- Next updated Support Zone 24780 to 24980 of Nifty Index
- And then next Support Zone 24180 to 24335 of Nifty Index Levels
- Resistance Zone seen at 25860 to 26035 and then ATH 26277.35 of Nifty 50 Index levels
- Rising Support Trendline shouldering well continued and Falling Resistance Trendline Breakout well sustained
- *Gap Down Opening after ATH on 27-Sept-2024, then of 03-Oct-2024 will act as a hurdle until closed by a New ATH*
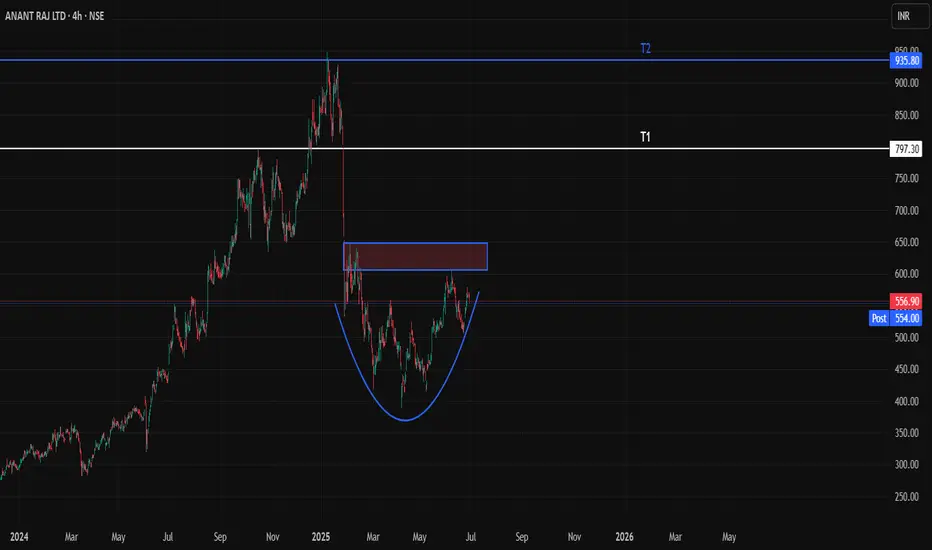
AnantRaj - About to wake up from deep slumber Hello folks! Here is the 4H time frame chart of anantraj which shows a rounding bottom consolidation pattern forming after a steep news driven downtrend. Volumes have nicely picked up in the accumulation phase.
We need to wait for dry volumes now followed by a breakout above the marked supply zone in the chart and we will see T1 and T2 succesfully post breakout!
With the data centre theme gaining back some of the lost traction in the past quarter we can expect a good upside in this counter within the next 2 months itself
Niftyparallel channel formation in progress
however thr is a supply on high arnd 2400-24350 levels.
mostly breadth is oversold, and stocks near support. good chance to bounce

My nifty intraday trend analisys 27/06/2025Pattern: Nifty is forming a Bottleneck Pattern, which generally supports bullish continuation after a tight consolidation.
Today’s View:
Market may open near 25600
Can test 25625 (1st Resistance)
Then may jump to 25700 if consolidation sustains
Due to Bottleneck, major correction unlikely
📊 Sideways Area – Where is the Range?
✅ Sideways Range (Today)
👉 When Nifty is between resistance and support zones without breakout:
🔸 From 🔸 To 🔄 Status
25460 25625 📉 Sideways Zone
25460 = Immediate support
25625 = First major resistance
Between these levels, Nifty may consolidate to build momentum before breakout.
🔐 Key Levels (Support & Resistance)
Support Resistance
25460 (strong) 25625 (primary)
25389 (backup) 25700 (target)
25300 (fail-safe) 25789 (extreme)
🎯 Strategy Suggestion
Market Condition Action Strategy
In Sideways (25460–25625) Wait / Scalping Low risk trades
Breaks 25625 & sustains Buy (BOD) Target: 25700–25789
Breaks below 25460 Use SOR cautiously SL tight
📌 Trading Tips:
Use 1-hour candle body-to-body
Observe Volume + Price Action + 15min candle close for breakout confirmation.

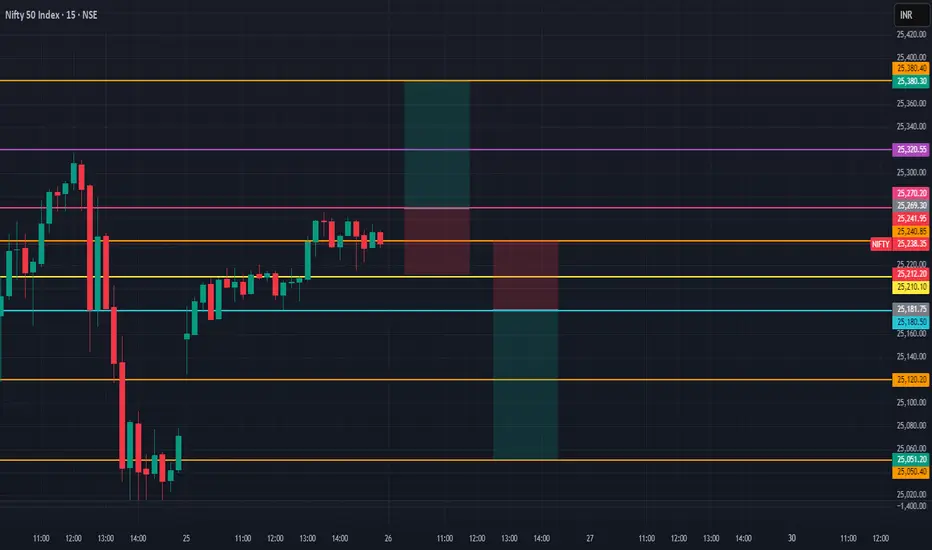
NIFTY Levels For Intraday (Educational Purpose) 29/06/2025📊 Nifty Intraday Plan (for 1-Min Chart Traders) – 26th June
🟢 Gap-Up Opening Strategy
✅ Buy above: 25,270
🎯 Targets: 25,320 / 25,380
🛑 SL: 25,210
⚠️ Avoid entry if no strong volume or if price gets rejected near 25,300.
🔴 Gap-Down Opening Strategy
✅ Sell below: 25,180
🎯 Targets: 25,120 / 25,050
🛑 SL: 25,240
⚠️ Avoid selling if Nifty holds above 25,200 after 15 mins.
📍 Use 1-min chart with candle + volume confirmation.
NIFTY - range breakout possible nowThis breakout is possible because of ceasefire possibility & crude price fall.
25,230 if breaks we enter bullish territory.
As per 15 mins chart 25070 could have acted as resistance. Next is 25,222.
After 25070 crosses, as gapup (high probability) 25,222 is possible.
We need to see how candles are forming.
If each candle making only making only higher close than previous we need stay in trade.
Also today there is SENSEX expiry.
So.. need be aware of it.
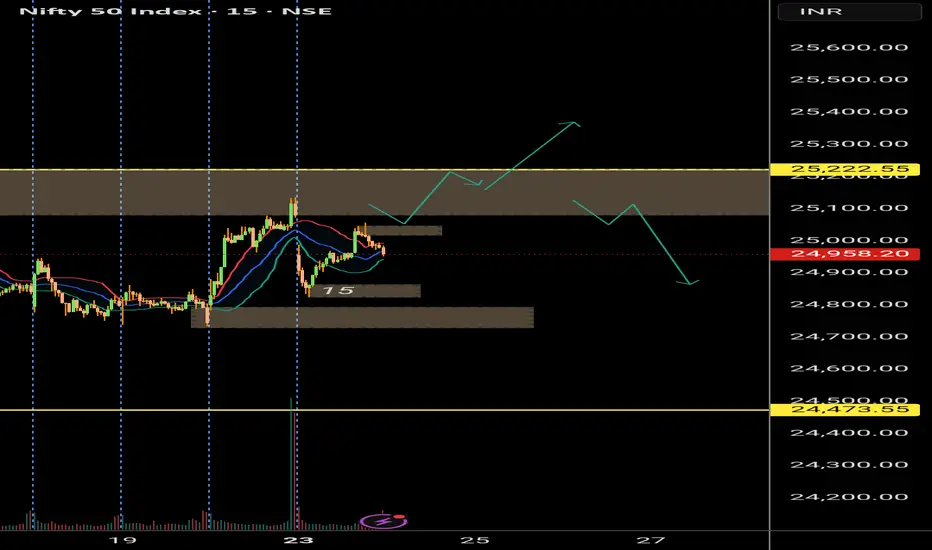
NIFTY: Don't fiddle in the middleAs shown in the chart, Long and short zones are identified. Outside box are SL.
Box to box movement is what we really want, but 1:2, 1:3 profits can be collected
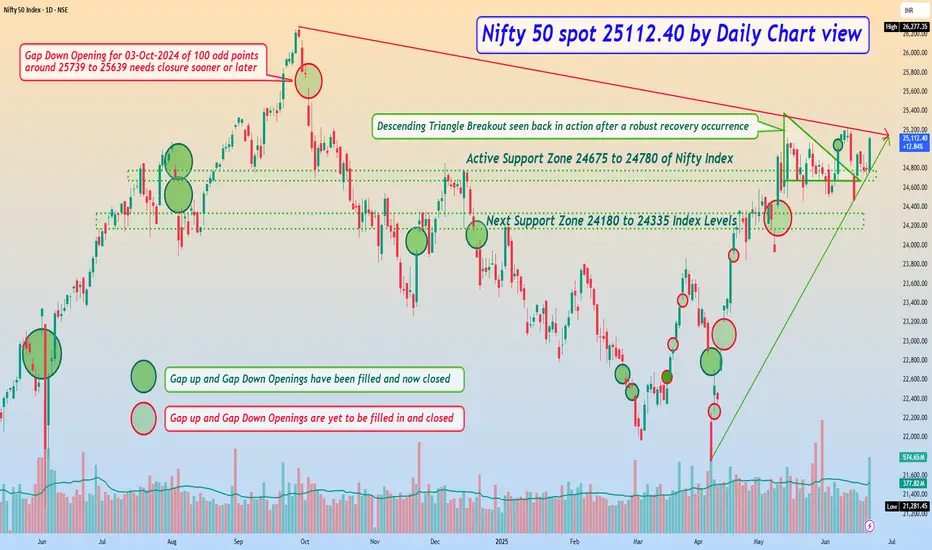
Nifty 50 spot 25112.40 by Daily Chart view - Weekly update*Nifty 50 spot 25112.40 by Daily Chart view - Weekly update*
- Active Support Zone 24675 to 24780 of Nifty Index
- Next Support Zone 24180 to 24335 of Nifty Index Levels
- Resistance Zone seen at 25200 to 25335 of Nifty 50 Index Levels
- Descending Triangle Breakout seen back in action after a robust recovery occurrence
- *Rising Support Trendline seems to have come into active mode but yet needs a stronghold*
Nifty 50 spot 24112.40 by Daily Chart view - Weekly update**Nifty 50 spot 24112.40 by Daily Chart view - Weekly update*
- Active Support Zone 24675 to 24780 of Nifty Index
- Next Support Zone 24180 to 24335 of Nifty Index Levels
- Resistance Zone seen at 25200 to 25335 of Nifty 50 Index Levels
- Descending Triangle Breakout seen back in action after a robust recovery occurrence
- *Rising Support Trendline seems to have come into active mode but yet needs a stronghold*

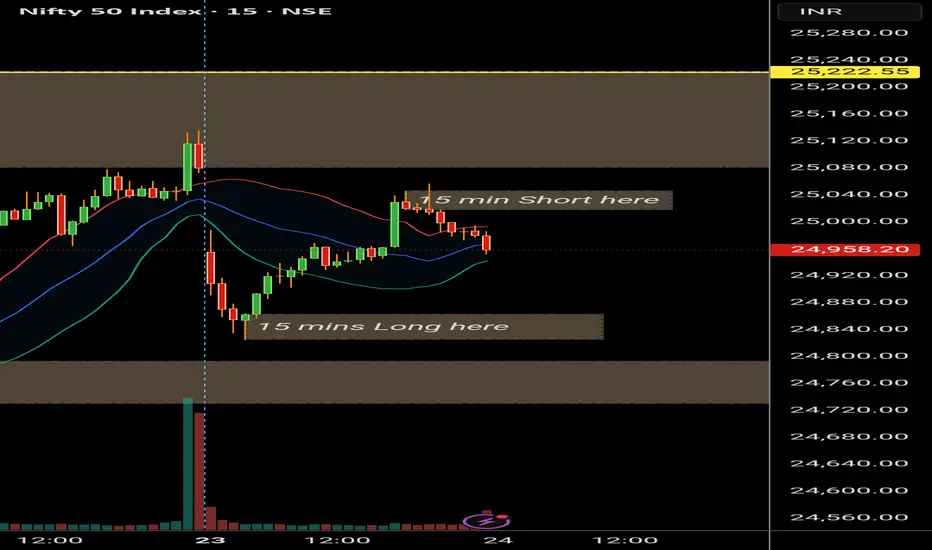
Nifty Thought Process and Analysis (Multi-Timeframe Breakdown)🔹 4H Timeframe (Intraday to Short-Term Swing)
Current Price: ~24,807
Price is consolidating inside a liquidity pocket just below a Fair Value Gap (FVG) zone.
Sell-side liquidity has already been swept; signs of accumulation are visible.
Three internal FVGs identified—market is respecting these inefficiencies.
Volume imbalance + EQ (Equal Lows) and previous OB (Order Block) show that price may be building a base.
Market Structure: Minor BOS (Break of Structure) observed, but no new HH yet — compression inside a range.
✅ Bullish Bias IF price breaks above the FVG range and mitigates the supply.
📌 Long Setup Idea:
Entry: Above 24,900
Stop Loss: Below EQ/FVG (~24,650)
Target: 25,200–25,400 (Buy-side liquidity/weak high zone)
📛 Invalidation: Clean break below EQ zone + OB → indicates bearish continuation.
🔹 Daily Timeframe (Swing View)
Price respected the sell-side liquidity grab and is now consolidating within a bearish FVG range.
Minor BOS confirms short-term bullish correction, but macro context is mixed.
PWL (Previous Week Low) has been swept, giving confluence to bullish short-term reversal.
Upper FVG near 25,100–25,200 remains unmitigated.
🧠 Key Observation: Smart money often reverses price after sweeping liquidity → the VI (Volume Imbalance) zone may act as a launchpad.
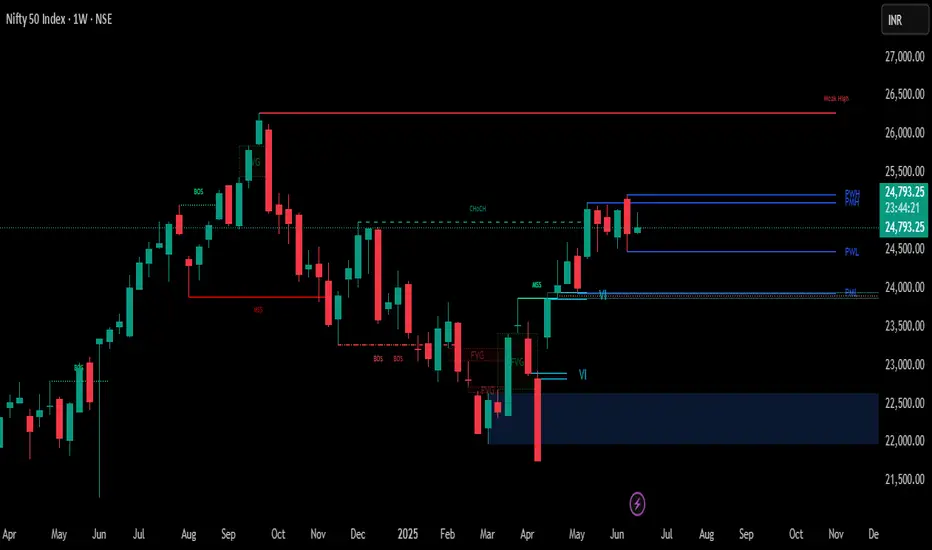
🔹 Weekly Timeframe (Macro Structure)
Structure remains bullish with strong upside momentum since the March-April reversal.
Change of Character (ChoCH) in April is confirmed with multiple BOS candles.
Current price is holding above the weekly FVG + VI.
A large bullish OB sits between 22,400–22,800, indicating massive institutional accumulation.
📈 Weekly Bias: As long as price stays above 24,400, bullish targets of 25,600 are possible in coming weeks.
🧩 Conclusion & Trade Idea Summary (ICT-based)
Bias: Bullish (Short-term accumulation, preparing for expansion)
Entry: Break and close above 24,900 on 4H or Daily
Stop Loss: 24,640 (Below EQ zone/FVG boundary)
TP1: 25,200 (Buy-side liquidity)
TP2: 25,400–25,600 (Weekly premium zone/weak high)
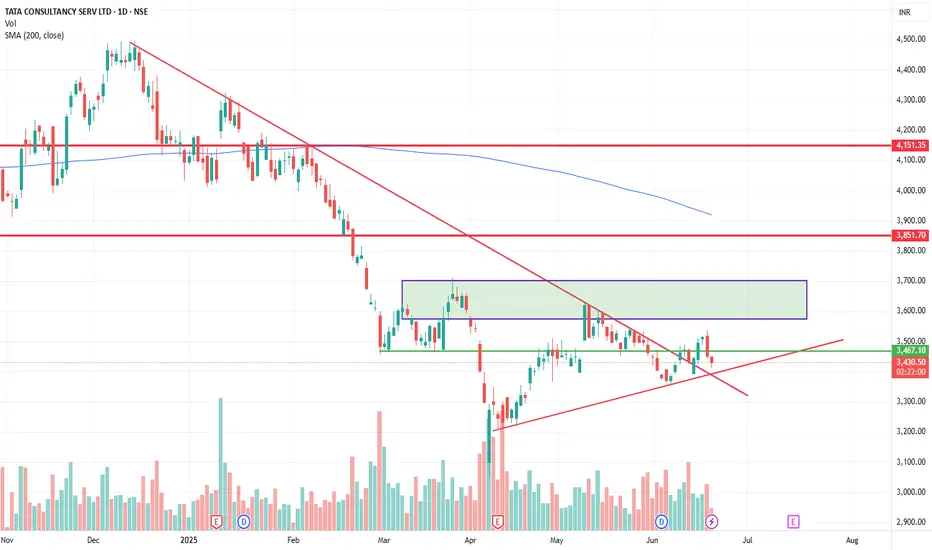
TCS Strong Support at ₹3360 | Breakout Above ₹3700ata Consultancy Services (TCS) is showing strong support near ₹3360 levels. A potential breakout will be confirmed if the price sustains above ₹3700.
Currently, the stock is facing key resistance zones between ₹3512 and ₹3525. A successful close above these levels may lead to strong bullish momentum.
📌 Key Levels:
Support: ₹3360
Resistance Zones: ₹3512 – ₹3525
Breakout Confirmation: Above ₹3700
Traders should watch these levels closely for directional cues. Volume confirmation and price action around resistance will be crucial.
#TCS #TCSshare #NSEStocks #StockAnalysis #BreakoutStocks #TradingViewIndia #TCSBreakout #IndianStocks #TechnicalAnalysis #SwingTrade
🔔 Disclaimer:
This analysis is for educational and informational purposes only. It is not a buy or sell recommendation. Please do your own research or consult a financial advisor before making any trading decisions. Trading and investing involve risk.