how to trade profitably in volitaile market ?Common strategies to trade volatility include going long puts, shorting calls, shorting straddles or strangles, ratio writing, and iron condors.
When volatility spikes, you have the opportunity to generate an above-average profit, but you also run the risk of losing a great deal of capital in a relatively short period of time. With a disciplined approach, you can learn to manage volatility for your benefit—while minimizing risks.
There are two main methods for trading:
Contracts for Difference (CFDs): This is like predicting whether the price will go up or down. You don't actually own the index, you're just speculating on its movements. ...
Options: Options let you speculate on price movements without risking more than your initial stake.
Nifty50

Best Statergies to do Database trading ?9 data-driven strategies for improved trading decisions
Volatility graphs. Volatility surface mapping is one method that helps decide the best approach in any given market. ...
Moving averages and regression analysis. ...
Machine learning. ...
Computer simulations. ...
The Bollinger Bands. ...
AI investing. ...
Unconventional data. ...
Using new data.
A trader needs to collect three types of market data for algo trading; real-time data, delayed data, and historical data. Real-time data is used while a trader executes an order, it is taken into account at the time of the trade.

Tata Consumer Products LTD - Technical - Weekly#TataConsumer includes operations both in🇮🇳 India and internationally. The Indian business focuses on branded ☕️tea, coffee, water, and various food products like salt, pulses, spices, and ready-to-eat meals. Internationally, #TCPL is known for its tea and coffee brands, with a strong presence in markets like the UK #Canada and the #USA
Hear is a 📉chart overview for your reference😍

Option chain pcr and its relevanceThe Put-Call Ratio (PCR) is a popular technical indicator used by investors to assess market sentiment. It is calculated by dividing the volume or open interest of put options by call options over a specific time period. A higher PCR suggests bearish sentiment, while a lower PCR indicates bullish sentiment.
The Put-Call Ratio (PCR) is a useful indicator to understand the market sentiment at any given time. A high PCR suggests a bearish market, while a low PCR signals bullish tendencies. It helps investors assess whether the market is leaning towards optimism or pessimism, which can shape investment strategies.

Nifty 50 spot 22985.25 by the Daily Chart viewNifty 50 spot 22985.25 by the Daily Chart view
- Sustained Support Zone for Nifty 50 Index 22775 to 22950 levels
- Will the Support Zone pass the 2nd retest after 1st test done on 27-January-2025
- Let's hope for the best to happen and look forward to see how things unfold going ahead

Nifty 50 | Head &Shoulders Pattern – A Breakdown Ahead?Hello everyone! I hope you all are doing great in life and in your trading . Today, I have brought an in-depth analysis of Nifty 50, focusing on a powerful Head & Shoulders pattern that is currently forming on the charts. This pattern is known for signaling a bearish reversal, which increases Supply in the market pushing prices downside. If this pattern plays out as expected, we could witness a strong Downside move in the coming sessions.
Currently nifty is trading at 23,340 levels Where previously buyers had shown interest pushing the market gap up following this pattern is selling pressure these buyers could Exit their position Pushing prices to 23,232 (Target 2) and 23,134 (Target 3).
Disclaimer:-This analysis is for educational purposes only. Please trade responsibly and consult a financial advisor before making any decisions.
If you found this analysis helpful, don’t forget to like, follow, and share your thoughts in the comments below! Your support keeps me motivated to share more insights. Let’s grow and learn together—happy trading!

NIFTY 50 I Falling Wedge Pattern + Bulllish Divergence Nifty 50 Index is currently trading within a very important zone in simple words called area of interest Usually consisting of demand or supply zone. This level has acted as a solid base for the index.
The NIFTY 50 index presents a promising opportunity to initiate long positions at these levels (CMP23,000), Aligning well with the risk reward ratio and making it a favourable entry point for traders looking for Taking advantage of the upcoming trend.
The index has shown a pattern of forming lower highs and lower lows, which indicates a downtrend. However, the Relative Strength Index (RSI) is showing a contrasting pattern of higher highs and higher lows. This divergence between price action and RSI suggests a potential shift in momentum and a possibility of a short covering rally.
Adding to this I see a falling wedge pattern which is a bullish signal suggesting an upward price movement which typically appears in a downtrend and often seen as a bullish Reversal pattern.
The analysis holds true when price close above 23,824 - daily timeframe.
While entering on current levels also has good opportunity of risk reward ratio, I suggest looking for a pin bar candle on today's close will Confirm Market picking support from the levels .
Conversely if nifty 50 index continues to recover, We could see a push towards 24,200 and 24,800 Which represent key Resistance areas. A good breakout above these levels likely signal Continuation of bullish trends in the indian markets.

Power Finance Corporation - Technical Chart#PFC Power Finance Corporation is a key player in India's power sector, primarily engaged in financing infrastructure projects related to power generation, transmission, and distribution.
Here's an 📉CHART overview FOR YOUR REFERENCE based on recent information

Bank of Baroda - Technical - Monthly#Bank of Baroda #BoB is one of India's leading public sector banks, established in 1908 and headquartered in #Vadodara #Gujarat It's known for its extensive network both domestically and internationally. Here's a comprehensive chart look at recent developments based on available data:

How to become a profitable trader ?8 Trading Tips to Help You Increase Your Net Profitability
Avoid Overtrading. Traders are ambitious, sometimes too much so. ...
Avoid Under-trading. ...
Take Control of Your Losses. ...
Simplify Your Approach. ...
Trade Robotically. ...
Learn Your Strengths and Weaknesses. ...
Double Down on What's Working. ...
Don't be Afraid to Go Back to Square One.

How to use Option-Chain in stock market???An option chain has two sections: calls and puts. A call option gives the right to buy a stock while a put gives the right to sell a stock. The price of an options contract is called the premium, which is the upfront fee that an investor pays for purchasing the option.An option chain has two sections: calls and puts. A call option gives the right to buy a stock while a put gives the right to sell a stock. The price of an options contract is called the premium, which is the upfront fee that an investor pays for purchasing the option.

trent ltd"#TRENT - The Countdown Begins!
• Entry - 5300
Stop-Loss - 5000
Target - 6000
✦ Momentum building, ready for ignition!
Trent is forecast to grow earnings and revenue by 24% and 25.4% per annum respectively. EPS is expected to grow by 23.9% per annum. Return on equity is forecast to be 32.5% in 3 years.

How to trade profitabily in stock markets???Use strategies like scalping or momentum trading, aiming for small, consistent gains across several trades. Set realistic profit targets and strict stop-losses to limit risk. Always start with a small capital, trade with proper risk management, and avoid over-leveraging to protect your investments.
Scalping is one of the most popular strategies. It involves selling almost immediately after a trade becomes profitable. The price target is whatever figure means that you'll make money on the trade. Fading involves shorting stocks after rapid moves upward.

CRISIL Ltd.CRISIL a good stock to buy
looking good on weekly
keep in radar....
Past 10 year's financial track record analysis by Moneyworks4me indicates that CRISIL Ltd is a good quality company.
India's premier ratings agency having rated 35,000+ large and medium-scale entities. This is the most profitable business of company and accounts for 51% of total profits while contributing only 28% of revenues

Schneider Electric Infrastructure Ltd.#schneider double bottom pattern formed
target - 800 £
entry - 630 £
stop loss - 590 £
time frame - 2 months
technicals - bullish
this is not any financial advise

How to use RSI in technical analysis ???To use the RSI indicator, check if the value is above 70 to show an asset is overbought, or below 30 to show it is oversold. Traders can use these signals to find possible trading opportunities.
Low RSI levels, typically below 30 (red line), indicate oversold conditions—generating a potential buy signal. Conversely, high RSI levels, typically above 70 (green line), indicate overbought conditions—generating a potential sell signal
Successful trades often occur when the RSI crosses above 30 (indicating a buy signal) or below 70 (indicating a sell signal). Adjusting the RSI period to 9 can make it more sensitive to price changes and be suitable for more active trading strategies

Paytm - Technical🇮🇳👉#Paytm shares have seen significant volatility. There was a notable surge of 4.53% on February 3, 2025, reaching an intraday high of ₹783, following strategic moves and renewed investor confidence. However, the stock has experienced a rollercoaster ride, with a 52-week low of ₹310 in mid-2024 due to regulatory concerns and a peak at ₹1,062.95 during the fintech boom of early 2024.🤞
➡️💘 Here a Technical 📉Chart about Paytm based on recent data for your reference

Baata India Pvt Ltd - Technical🥰😍🇮🇳#BATAINDIA was originally incorporated as Bata Shoe Company Pvt. Ltd. in 1931. It was established in Konnagar, near #Kolkata and later moved to Batanagar. The company went public in 1973 and changed its name to Bata India Limited.
👉Here a #Technical 📉Chart about the company based on available information

zensar technologies Ltd#ZENSARTECH
Stock has taken good support near 880 levels. After crossing 920 levels, more move is possible.
Time period: Swing/Positional call
Target 920/985
Stop loss 882
I am just representing my views
For educational purposes only.
Zensar Technologies is forecast to grow earnings and revenue by 13.6% and 11.6% per annum respectively. EPS is expected to grow by 13.4% per annum. Return on equity is forecast to be 17.4% in 3 years.

Tech Mahindra Ltd.#TECHM on a breakout.
Entry: 1160
SL: 1120
Target: 1315/ 1425/1570/1700/1800
Check BIO for any help.
Comment stocks below for review.
Happy Trading!!!
Tech Mahindra is forecast to grow earnings and revenue by 23.9% and 7.7% per annum respectively. EPS is expected to grow by 23.8% per annum. Return on equity is forecast to be 29.3% in 3 years

UltraTech Cement Ltd."#ULTRACEMCO - Building Up Strength!
Entry: 11600
Stop-Loss: 11300
Target: 12000
Support solid as concrete-next stop, sky!
UltraTech Cement Ltd. has an average target of 12000.The consensus estimate represents an upside of 9.46% from the last price of 11640.60. View 43 reports from 12 analysts offering long-term price targets for UltraTech Cement Ltd..

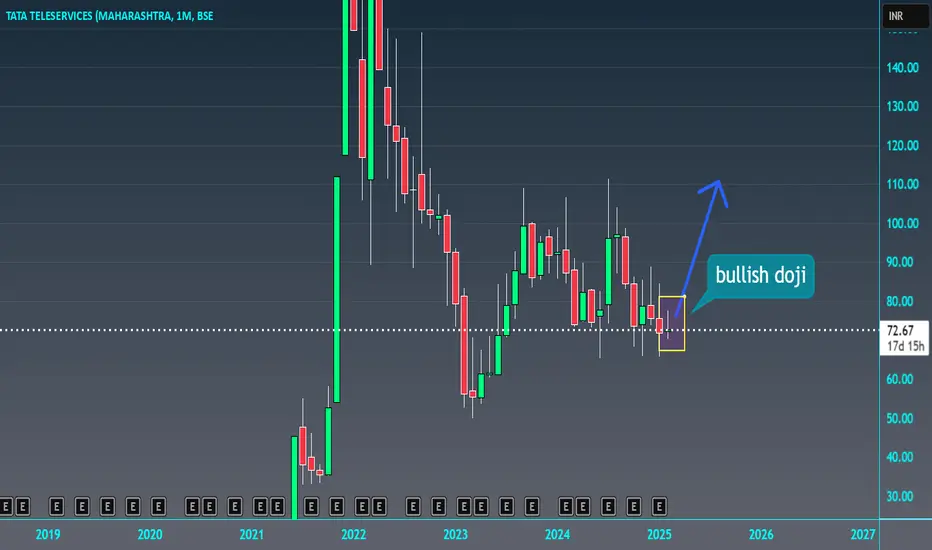
Tata Teleservices (Maharashtra) Ltd#TTML PERFECT REVERSAL CANDIDATE
TARGET - 82
ENTRY - 72
STOP LOSS - 70
TIME FRAME - MONTHLY
TECHNICALS - BULLISH DOJI CANDLE FORMED
THIS IS NOT ANY FINANCIAL ADVISE
As on 7th Feb 2025 TTML SHARE Price closed @ 72.04 and we RECOMMEND Strong Sell for LONG-TERM with Stoploss of 80.87 & Sell for SHORT-TERM with Stoploss of 76.08 we also expect STOCK to react on Following IMPORTANT LEVELS.
Mahamaya Steel Industries Ltd#MAHASTEEL
Daily chart..
Resistance at 225
Support at 180
Keep on Radar..
Shri Ramanand Agrawal
The Company has been promoted by Shri Ramanand Agrawal and his family members. Agrawal family is a well-known industrialist family from Raipur. The Company came out with a public issue in the year 1994 which was oversubscribed. MSIL is a profit making and dividend paying Company.
