LEARN INSTITUTIONAL TRADING🔍 What Is Institutional Trading?
Institutional trading is how large financial organizations operate in the markets. They don’t buy based on tips or random indicators — they use price action, volume data, liquidity zones, and market structure to accumulate and distribute positions quietly, often without the retail crowd noticing.
Learning institutional trading means learning:
How markets truly move
How smart money traps retail traders
How to follow big money footprints
🧠 Key Concepts You’ll Learn
1. Market Structure Mastery
Understand how institutions analyze market structure:
Break of Structure (BoS)
Change of Character (ChoCH)
Trends, ranges, and consolidation zones
2. Liquidity and Order Blocks
Learn how to identify:
Institutional order blocks (entry zones of banks)
Liquidity grabs (stop loss hunting zones)
Fair value gaps and imbalance areas
3. Smart Money Concepts (SMC)
SMC is the foundation of institutional trading. You’ll learn:
Wyckoff accumulation & distribution
Internal vs. external market structure
Entries based on premium-discount theory
4. Volume and Manipulation
Learn how volume, price action, and timeframes work together to show:
Hidden buying/selling
Trap zones
Institutional accumulation patterns
5. Entry & Exit Planning
How institutions plan:
Low-risk, high-reward entries
Multi-timeframe confirmation
Managing trades with scaling in/out
📊 Why Institutional Trading Is Powerful
Institutions:
Have deep capital
Move the market
Use strategies based on logic and patience
When you learn how to think like an institution, you stop chasing signals and start trading with confidence and structure.
👨🏫 Who Should Learn Institutional Trading?
Beginners looking for the right trading foundation
Intermediate traders tired of inconsistent results
Advanced traders seeking deeper strategy and psychology
Intraday, swing, and positional traders
✅ What You'll Gain:
A complete mindset shift in how you view the markets
Strategies with clear entry, stop loss, and target rules
Tools to trade any market: stocks, forex, indices, crypto
Confidence to follow smart money — not get trapped by it
🚀 Start Your Journey Now
Stop trading like the 90%. Learn how the 10% think, plan, and profit.
"Learn Institutional Trading" is your opportunity to elevate your market skills and build long-term trading success with a professional edge.
Nifty50

Commodity Supercycle 2025: Metals & Energy⚒️ Metals: The Foundation of Industrial Growth
Why are metal prices booming?
Let’s break it down in human terms:
Massive Infrastructure Projects
India, US, China, and Europe are all spending billions on roads, bridges, railways, smart cities, and housing.
All of that needs steel, cement, aluminum, copper, etc.
Clean Energy = More Copper & Aluminum
Solar panels, EVs, and wind turbines need a lot more copper, lithium, and rare metals than conventional energy.
This creates a demand explosion for base metals.
Supply Chain Bottlenecks
Mines across the world (especially in Africa, Chile, and Australia) are facing labour shortages, political instability, or environmental restrictions.
Less mining = less supply = prices go up.
China’s Comeback
China is the largest consumer of metals globally.
After a slow period in 2022–23, it’s back with a stimulus to revive housing and infrastructure — adding massive demand pressure.
🔋 Energy: Fuel for the Supercycle
What’s happening in oil, gas, and coal?
Crude Oil Above $90/Barrel
Conflicts (Russia-Ukraine, Middle East) + OPEC production cuts = tight supply
Despite the push for renewables, the world still runs on oil for transport and manufacturing
Natural Gas Shortages in Europe/Asia
War-related disruptions in Russian supply have caused natural gas prices to skyrocket
LNG imports from the US and Qatar are booming — good for companies in that ecosystem
Coal Prices Rising Again
Despite climate goals, India, China, and others are still using coal for base power
Coal India and related PSUs have seen strong earnings due to volume demand + price support
🧾 How This Affects the Indian Market
India is both a major consumer and a growing exporter of various commodities.
Winners in the Supercycle:
1. Metal Stocks (Steel, Aluminum, Copper)
Company Why It’s Benefiting
Tata Steel Global presence + rising prices = higher margins
JSW Steel Export growth + capex-driven demand
Hindalco Aluminum giant + Novelis (US-based unit)
Hindustan Copper India’s only copper miner; global demand rising
2. Energy Stocks (Oil, Gas, Coal)
Company Why It’s Benefiting
ONGC Rising crude prices = stronger profitability
Oil India Smaller PSU with strong rally potential
Coal India Massive volumes, dividend, pricing power
Reliance Petrochemicals + oil refining benefits
3. Ancillary & Export-Based Stocks
Company Role in Supercycle
NMDC Supplies iron ore – key to steelmakers
MOIL Manganese supplier for steel industry
APL Apollo Tubes Beneficiary of infra + steel boom
Welspun Corp Pipes for oil & gas pipelines
📊 Real Performance: Numbers Don’t Lie
Let’s take a quick look at recent returns (approx. from Jan 2023 to July 2025):
Stock Price in Jan 2023 Price in July 2025 Approx % Gain
Tata Steel ₹110 ₹170+ 55%+
JSW Steel ₹690 ₹930+ 35%+
Hindalco ₹430 ₹675+ 55%+
Coal India ₹220 ₹450+ 100%+
ONGC ₹150 ₹270+ 80%+
These are fundamentally driven rallies — not pump-and-dump moves. That’s the beauty of supercycles.
📈 Technical Outlook in July 2025
Nifty Metal Index:
📌 Near all-time highs (~9,000+ zone)
📈 Trend: Strong bullish
🔁 Expect periodic corrections of 5–7%, but uptrend likely to continue
Nifty Energy Index:
📌 In a broad uptrend, thanks to Coal India, ONGC, Reliance
📈 Breakouts seen in power generation and refining stocks
🎯 Next resistance at 30,000+, support at 28,500
🧠 What Traders & Investors Should Do
🧭 For Traders:
Focus on volume breakouts in metal & energy stocks
Watch for sectoral momentum using indices like Nifty Metal, Nifty Energy
Use Futures & Options (F&O) strategies like:
Call buying on breakout confirmation
Bull call spreads in ONGC, Hindalco, Tata Steel
Short straddles for sideways phases in Coal India
📆 For Swing Traders:
Identify weekly breakout patterns (flags, cup & handle, triangle)
Use trailing SL and partial booking (these stocks move fast)
Best timeframe: 2–4 week swings, especially in trending names
💼 For Long-Term Investors:
Allocate 10–15% of your portfolio to core metal/energy stocks
Focus on low-debt, dividend-paying companies (e.g., Coal India, ONGC)
SIP or staggered entries work well in a volatile commodity cycle
Expect volatility — supercycles are not linear
❗ Risks & Cautions
Every rally has its risks. Here’s what to keep in mind:
Risk Impact
Global Recession Could reduce commodity demand globally
China Slowdown Big impact on copper/steel demand
Currency Volatility Affects import/export profitability
Policy Changes Carbon tax, ESG push may hurt coal/oil stocks
Overheating Stocks may correct 15–20% if valuations get stretched
Always use risk management — especially in leveraged trades.
🗺️ Global Supercycle Factors to Watch in 2025–26
🛢️ Crude oil production quotas (OPEC+ decisions)
🏗️ China’s stimulus on construction and EVs
🌱 ESG push: Will governments ban/restrict dirty fuels faster?
💹 US Fed rate cuts/inflation outlook (affects commodity pricing)
🧾 Mining policies in resource-rich countries (Africa, Latin America)
These global forces shape how long the current commodity upcycle will last.
✍️ Final Thoughts
The commodity supercycle in 2025 is real and being driven by multi-year global trends in infrastructure, energy transformation, and supply limitations. This is not just a short-term rally — it’s part of a structural shift.
If you’re a trader — this sector is offering sharp, trend-friendly price action.
If you’re an investor — this is your chance to ride secular growth in India’s industrial backbone.
💡 “When the world builds, commodities boom. And when that boom is real, wealth is created.”

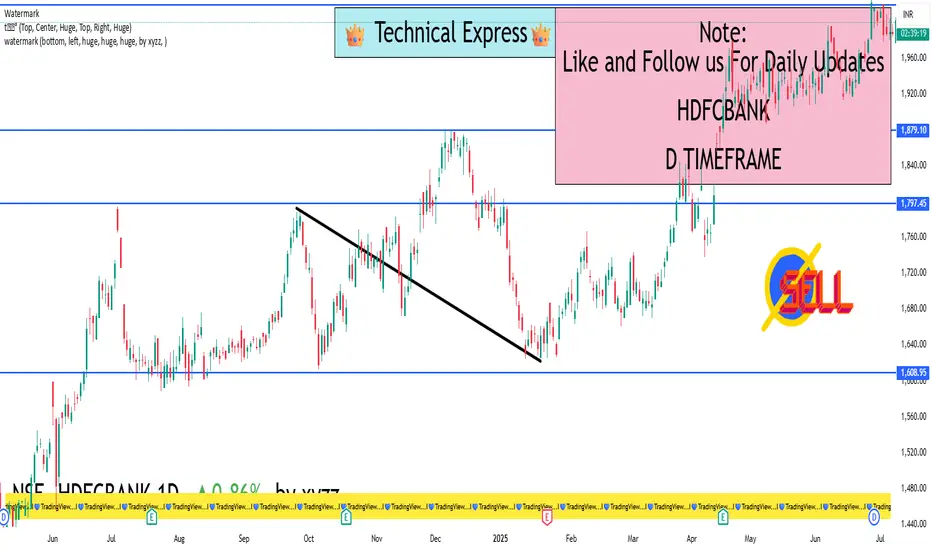
HDFCBANK 1D Timeframe📊 Current Snapshot
Price: Around ₹1,995 (~₹1,990–₹2,000 range)
52-week range: ₹1,588 – ₹2,027 — just below the recent high
✅ Technical Momentum
Overview: Daily technical summary is a "Strong Buy", with moving averages and indicators like RSI (55.3), Stoch, ADX, and CCI all in buy territory
Pivot Level Support: Standard pivots are around ₹1,995
RS Rating (ADR): Strong (83) — above the 80 mark, but extended — suggesting good trend; watch pullbacks
🛡️ Key Price Zones
Support / Buy-on-Dip Areas
₹1,995–₹1,998 – Daily pivot zone
₹1,982–₹1,990 – Standard S1 support
₹1,960–₹1,970 – Deeper Fibonacci/S2 pivot zone
₹1,932–₹1,940 – Strong long-term support (S3–S4 levels)
Resistance / Profit Exit Zones
₹2,007–₹2,015 – Immediate upside pivot resistance (R1–R2)
₹2,024–₹2,025 – R2 zone
₹2,030+ – R3/R4 zone — breakout territory
🧭 Action Plan
1. Currently Holding?
Stay invested — indicators are still bullish.
Think about taking partial profits in the ₹2,015–₹2,025 range, especially if the market overall gets choppy.
2. Planning to Buy?
Best entry: around ₹1,982–₹1,990 (safe zone).
If broader markets dip more, ideal accumulation range is ₹1,960–₹1,970.
Aggressive buying can start near ₹1,995 but keep stop-loss close.
3. Breakout Strategy
A clean, daily close above ₹2,025–₹2,030 on good volume opens up fresh upside toward all-time highs (~₹2,027+).
Can add more after breakout with confidence.
4. Risk Management
Entry around ₹1,982–₹1,990 → set stop-loss below ₹1,960.
If buying near ₹1,960–₹1,970 → stop-loss could be ₹1,930.
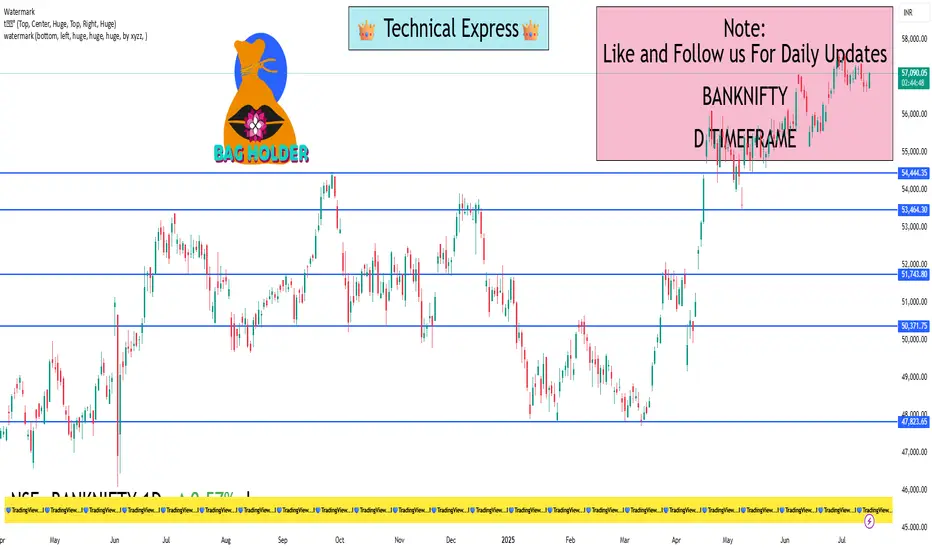
BankNifty 1D Timeframe📊 Current Market Price:
Around ₹56,750 – ₹56,800
Bank Nifty has recently cooled off a bit after touching its all-time high of ~₹57,628. It’s still in a strong uptrend, but showing short-term consolidation—which is healthy for long-term moves.
🛡️ Important Support Zones (Buy on Dips)
These are levels where Bank Nifty is likely to bounce if it falls:
✅ ₹56,200 – ₹56,300
Recent swing low and key 1-day candle support
Ideal first level to enter or add
Can act as a good buying zone if the index dips slightly
✅ ₹55,500 – ₹55,700
Strong demand zone
Acts as a cushion in case of deeper correction
Great zone for long-term accumulation
✅ ₹54,800 – ₹55,000
Previous breakout level
Excellent entry point for long-term investors if panic selling happens
🚧 Resistance Levels (Upside Barriers)
These are levels where profit booking may happen:
🔼 ₹57,000 – ₹57,200
Near current highs; if crossed, momentum may return quickly
🔼 ₹57,600 – ₹57,800 (All-Time High Zone)
Heavy resistance; needs volume to break
🔼 ₹58,500+
Potential future target on strong breakout above ₹57,800
📌 What to Do Now (Investment Plan)
🔹 Already Holding?
Stay invested. Trend is still bullish unless price breaks below ₹55,000.
Consider booking partial profits near ₹57,600 if you're short-term focused.
🔹 Want to Invest Now?
Wait for dip to ₹56,200 – ₹56,300 for safer entry
Start buying in small parts. Don’t go all in at once.
🔹 Aggressive Entry?
You can also consider entering now and adding more on dips
Just place a stop loss near ₹55,000 (daily close basis)
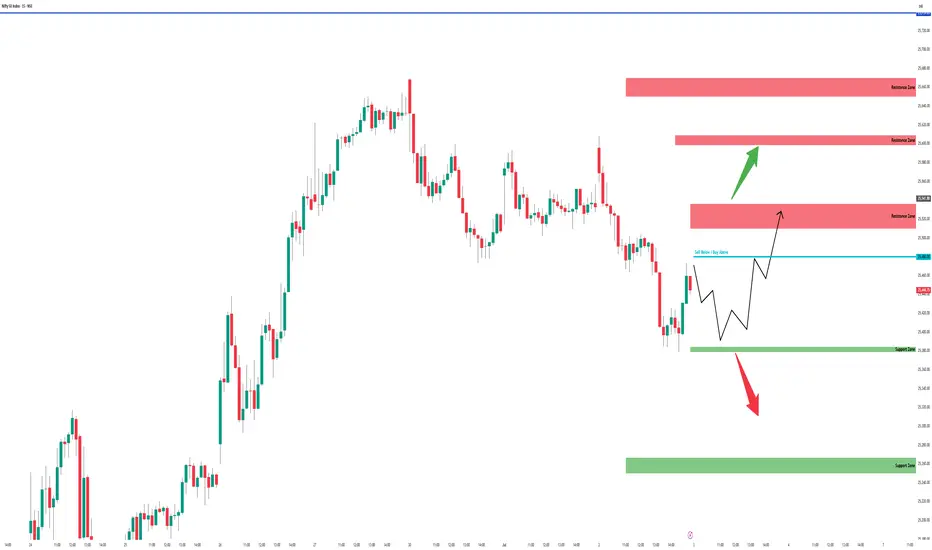
BAJAJ FINSERV Swing Trade ( 1:3 RR )If Nifty holds current levels ie. 25000, then Bajaj Finserv will continue its sideways-uptrend.
Sellers have recently got trapped by the buyers in the buying zone which can fuel next up-move.
With 1:3 RR, trade setup is simple and looks good if overall market is not bearish.
Thanks and let me know in comments if you have any questions.
Follow for more such simple swing trade setups.

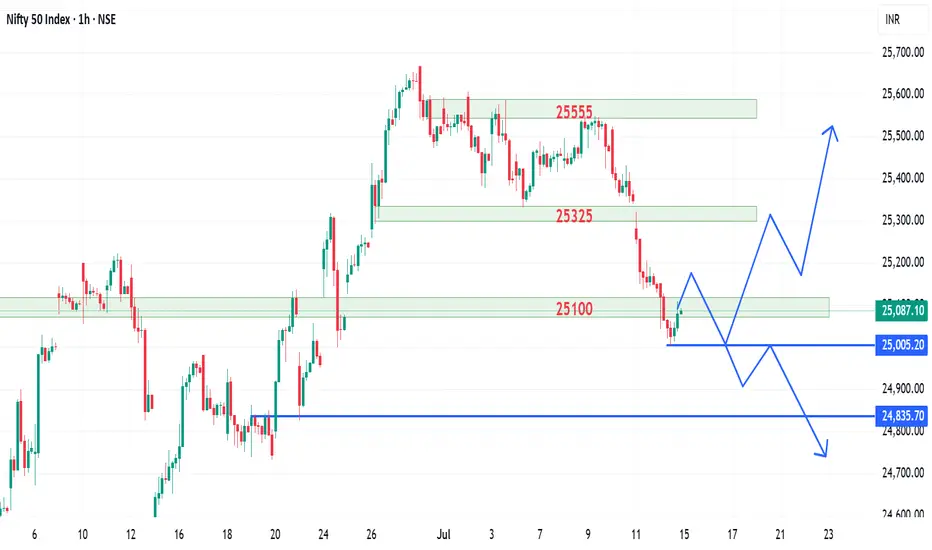
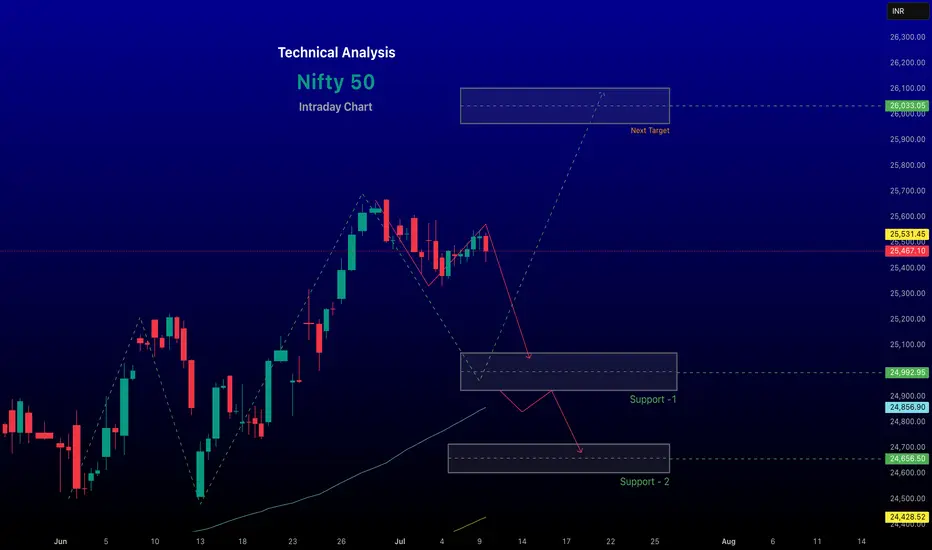
Nifty possible movement for the upcoming trading session.Nifty closed around the support zone forming a long lower tail showing some bullishness today.
Though the market has moved after a long time and can move on the either side.
Levels are marked and possible movements are also plotted.
Wait for the price action and trade accordingly.
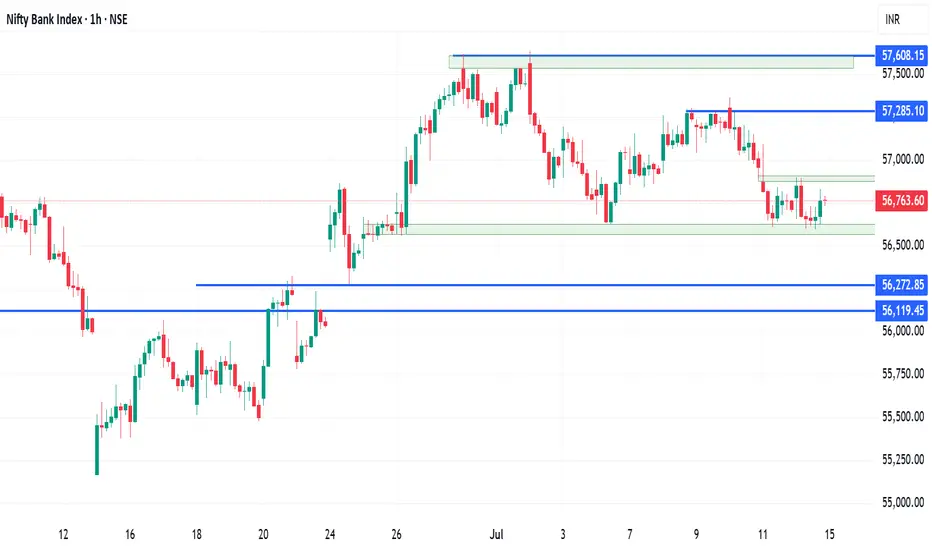
Banknifty analysis for the upcoming movement in the index.Banknifty has been trading in a range for a long time and is now trading around the support levels of 56600.
The RSI indicator on the daily charts is showing some bearish divergence and today the market has taken a halt after 2 days of fall.
If the market starts travelling on the lower side there are chances of testing the lower support level of 56120.
The market has been trading in a range of 56600 to 57600. And the support is tested many a times.
Bullish trades can be initiated for intraday play only once the market starts sustaining above today's high of 56900.
Moving averages are also forming a resistance gate around the resistance level. Watch for the breakout and enter only on the retest of the levels.
Major support levels :- 56600, 56270, 56120
Resistance levels :- 56900, 57285
Wait for the price action and trade according to the price action.
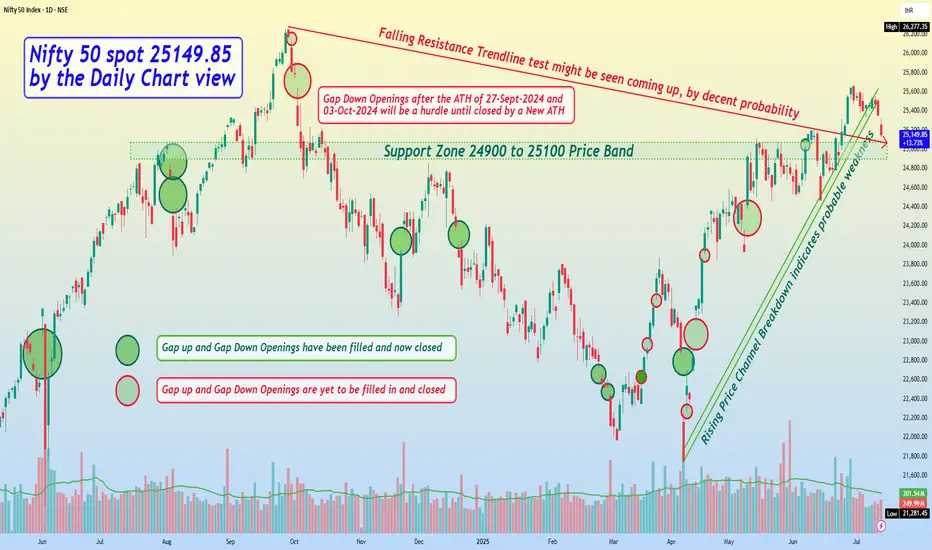
Nifty 50 spot 25149.85 by the Daily Chart view - Weekly updateNifty 50 spot 25149.85 by the Daily Chart view - Weekly update
- Support Zone 24900 to 25100 Price Band, yet sustained
- Next Support Zone seen at 24325 to 24500 of the Nifty Index
- Resistance Zone 25860 to 26035 then ATH 26277.35 of Nifty Index levels
- Rising Price Channel Breakdown indicates probable weakness to see following
- Falling Resistance Trendline test might be seen coming up, by decent probability
- Nifty Index keeping within self drawn limits and shying away at each attempt towards 26000
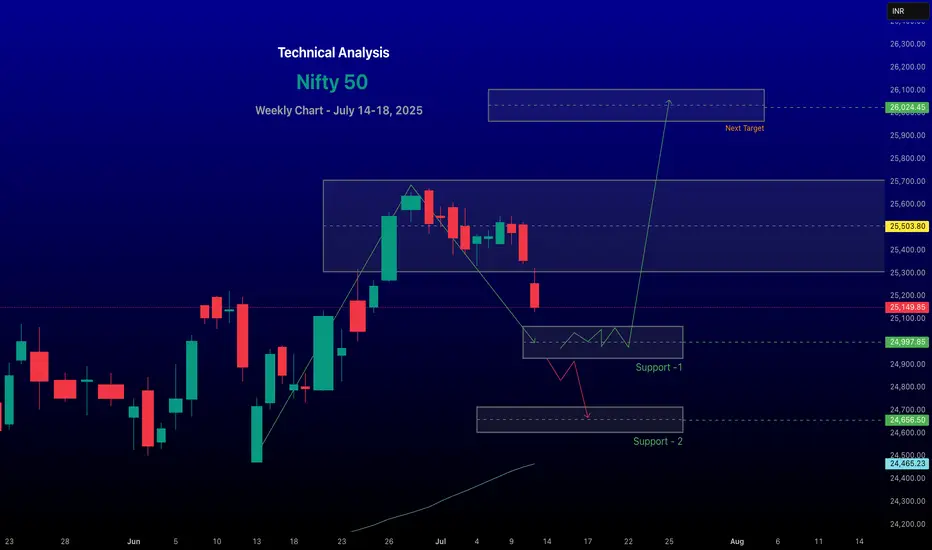
renderwithme | Nifty 50's movement for the week of July 14–18, Predicting the Nifty 50's movement for the week of July 14–18, 2025,
Involves analyzing recent market trends, technical indicators, and macroeconomic factors based on available data. Here’s a concise analysis:Market ContextRecent Performance: The Nifty 50 closed at 25,149.85 on July 11, 2025, down 0.78% from the previous day, reflecting a bearish session driven by losses in IT, auto, and oil & gas stocks. The index has been volatile, with a weekly decline of 0.59% but a monthly gain of 0.63%.
# Global Cues:
Mixed global market trends are influencing sentiment. U.S. markets are at record highs, but Wall Street futures are down, and Asian markets are mixed (e.g., Nikkei 225 up, Hang Seng down). The looming U.S. tariff deadline and potential U.S.–India trade agreement talks are key events to watch.
#FII/DII Activity:
Foreign Institutional Investors (FIIs) have been selling, which may weigh on short-term sentiment, while Domestic Institutional Investors (DIIs) could provide support.
~~ Technical Analysis ~~
Trend: The Nifty 50 is in a broader uptrend but showing signs of a short-term correction. It closed below the key level of 25,400, indicating potential weakness. Technical indicators suggest a sideways to bearish bias for the near term.
#Support and Resistance:
Support: Key support lies at 24,900–25,133. A break below 24,900 could lead to further declines toward 24,700 or 24,500.
Resistance: Immediate resistance is at 25,500–25,650. A sustained move above 25,650 could signal bullish momentum toward 25,770–26,000.
# Indicators:
Moving Averages: The index is above its 20-day, 50-day, and 200-day EMAs, supporting a bullish long-term trend, but recent selling pressure at higher levels indicates consolidation.
# Sectoral Outlook
Bullish Sectors: Banking, pharma, realty, oil & gas, and media showed resilience last week, with stocks like HDFC Bank, Bajaj Finance, and Coal India gaining.
Bearish Sectors: IT, metals, telecom, and auto underperformed. IT stocks like TCS, HCL Tech, and Infosys dragged the index due to weak Q1 results (e.g., TCS reported a 6% profit increase but faced margin pressure).
Key Events to WatchU.S.–India Trade Talks: Clarity on a potential interim trade agreement could boost sentiment, especially for export-oriented sectors.
FOMC Minutes: The release of FOMC minutes may influence global rate expectations, impacting FII flows.
Forecast for July 14–18, 2025Expected Range: The Nifty 50 is likely to trade between 25,000–25,750. A break below 24,900 could test 24,500, while a move above 25,650 may target 26,000.
~~ Disclaimer --
This analysis is based on recent technical data and market sentiment from web sources. It is for informational purposes only and not financial advice. Trading involves high risks, and past performance does not guarantee future results. Always conduct your own research or consult a SEBI-registered advisor before trading.
#Boost and comment will be highly appreciated
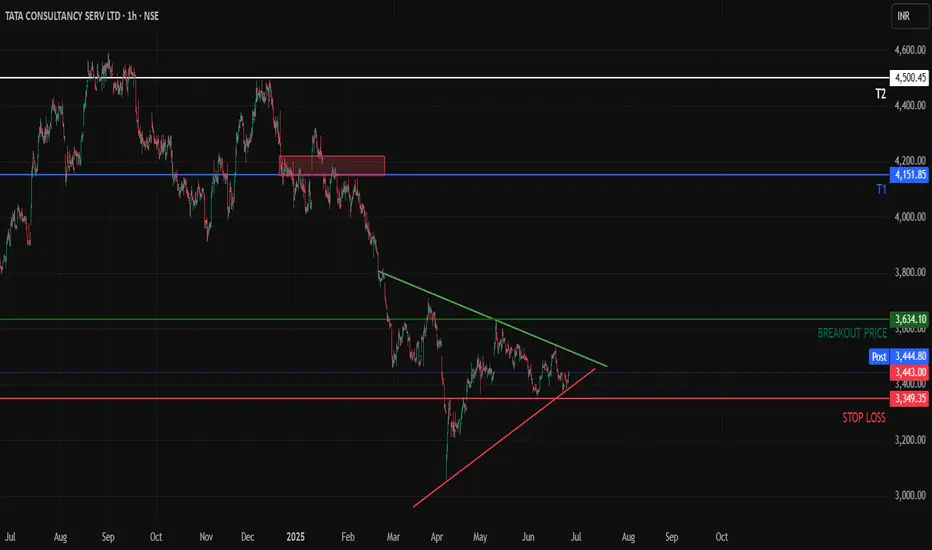
TCS - About to Break out of a consolidation Hello All,
Here is the 1H time frame of TCS which is making a triangle pattern with converging prices at the bottom its recent downtrend.
We can expect T1 once Breakout Price is reached and we get at least a 1H candle closing above the marked breakout price
Once the supply zone near T1 is cleared we can expect prices to hit T2 as well
Above T2, Sky is the Limit for TCS
renderWithMe | Nifty 50 - Intraday analysis Technical Outlook for July 11, 2025:
Support Levels: Immediate support is at 25,490, with a stronger base at 25,440-25,400. A break below 25,400 could lead to further downside, potentially testing 25,100 or 24,900.
Resistance Levels: Resistance is around 25,600, with a breakout above this level potentially pushing the index toward 25,800 or higher. A sustained move above 25,670 in the NIFTY 50 July Futures could target 25,780.
Forecast: One source predicts the NIFTY 50 at 25,285 on July 11, with a trading range of 23,262 (minimum) to 27,308 (maximum). However, the index is likely to remain range-bound unless a clear breakout occurs above 25,600 or below 25,400.
Disclaimer --
This analysis is based on recent technical data and market sentiment from web sources. It is for informational purposes only and not financial advice. Trading involves high risks, and past performance does not guarantee future results. Always conduct your own research or consult a SEBI-registered advisor before trading.
#Boost and comment will be highly appreciated
Nifty - Intraday levels & Prediction for - 08 Jul 2025Nifty Prediction for Tomorrow:
Trend : BEARISH reversal
Sentiment : Positive
Expectation : Nifty looks weaker and has high possibility of going down upto 25200/25100 levels. BULLISH only above 25540 if Nifty sustains above the resistance zone.
Look for Buy/Sell at Demand and Supply zone for profitable trades.
Demand and Supply Zones - When price breaks the zone, Demand zone will become Resistance and Supply zone will become Support.
Refer the chart for detailed Intraday Support and Resistance levels.
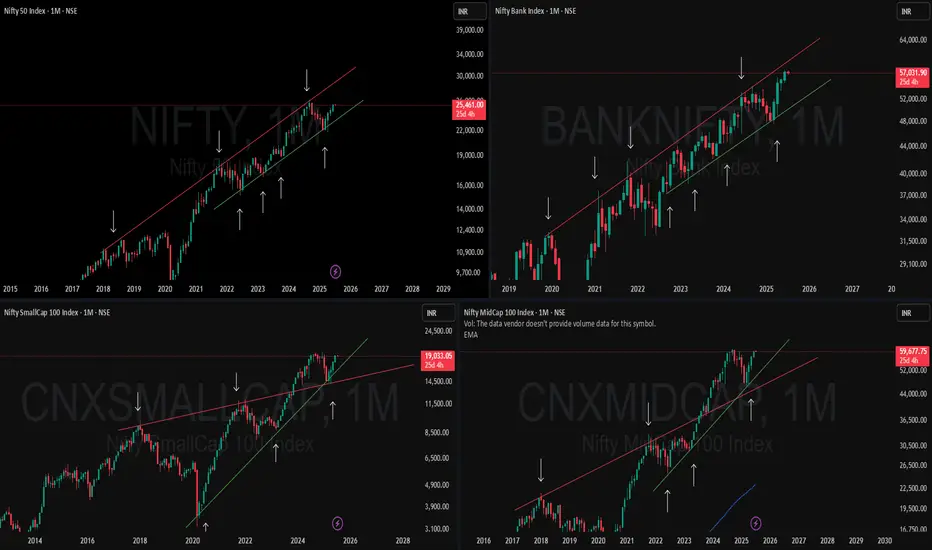
How These 2 Lines Caught Every Major Move in All 4 Indices! 📈 Keep It Simple, Keep It Powerful
When price action starts making sense, you’ll realize how far a single Support and Resistance line can take you.
🟥🟩 NIFTY & BANKNIFTY – Two clear examples of parallel channel trends, marching higher with clean Higher Highs and Higher Lows.
🟩🟥 MIDCAP & SMALLCAP – Not just catching up, but breaking out of Multi-Timeframe contraction patterns with strength — a sign of broader market participation.
They're now retesting and reclaiming previous highs after a much-needed breather.
💡What this chart tells us:
-Trendlines aren't just lines—they’re psychological guides to institutional and retail behavior.
-All four indices are moving in structured, rhythmic patterns.
-Simplicity works best. The markets speak clearly when you know what to listen for.
Nifty Starts July Quietly; Sideways Action May ContinueNifty began the month on a subdued note, registering a net weekly loss of 176.80 points (-0.69%). Market volatility also eased, with the India VIX declining by 0.59% to 12.31, indicating reduced trader anxiety.
From a technical standpoint, an immediate resistance zone has developed between 25,500 and 25,650, while a key support range lies between 25,200 and 25,300.
Open Interest (OI) data adds weight to these levels, with a significant build-up of call writing at 25,500 suggesting strong resistance, and put writing at 25,200 indicating solid support.
Looking ahead, Nifty is expected to remain range-bound between these two zones unless a decisive breakout or breakdown occurs.

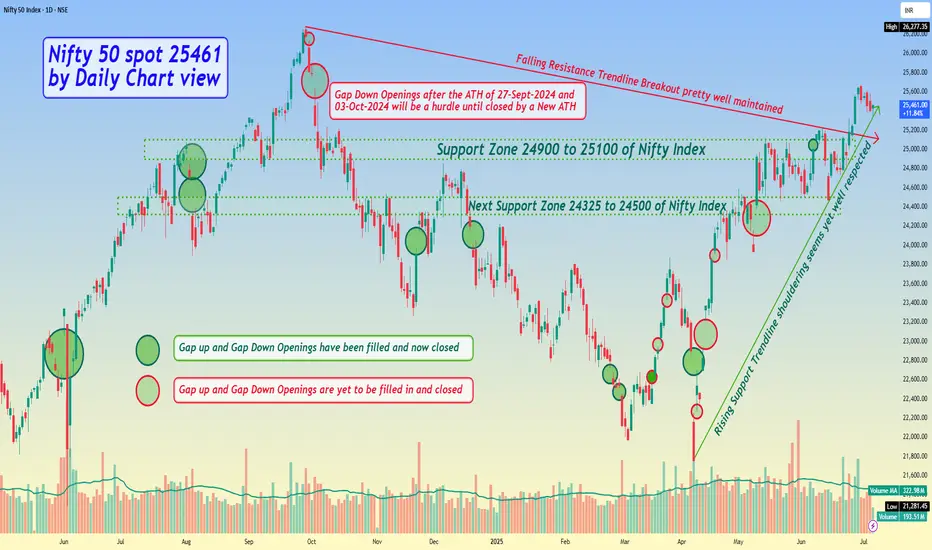
Nifty 50 spot 25461 by Daily Chart view - Weekly updateNifty 50 spot 25461 by Daily Chart view - Weekly update
- Support Zone 24900 to 25100 of Nifty Index
- Next Support Zone 24325 to 24500 of Nifty Index
- Resistance Zone 25860 to 26035 then ATH 26277.35 of Nifty Index levels
- Nifty Index retraced by unwarranted events and to a good extent by profit booking
- Nifty Index is shying away to sustain any upside towards 26000 and falling down flat face
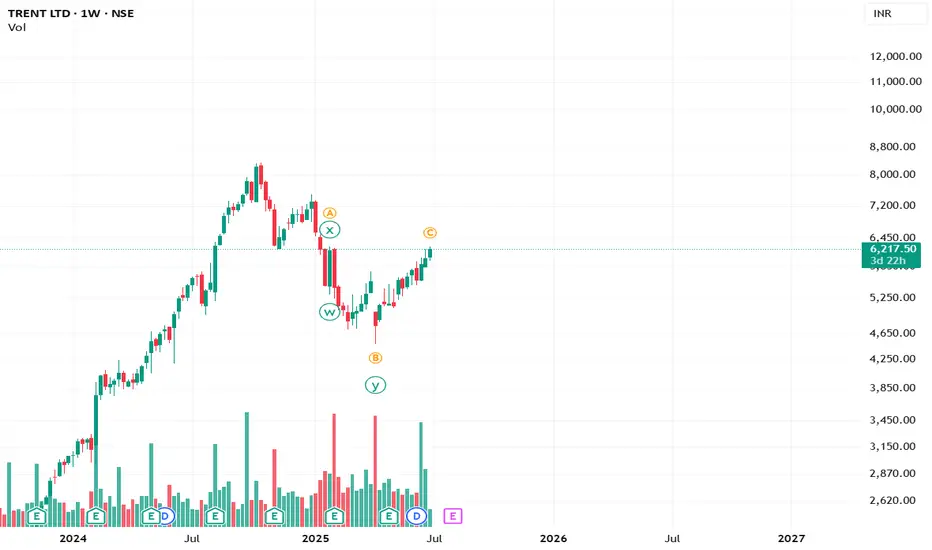
A Possible alternate count for TRENT?Whether TRENT has completed its complex correction or is still unfolding an expanded flat. Only time will tell.
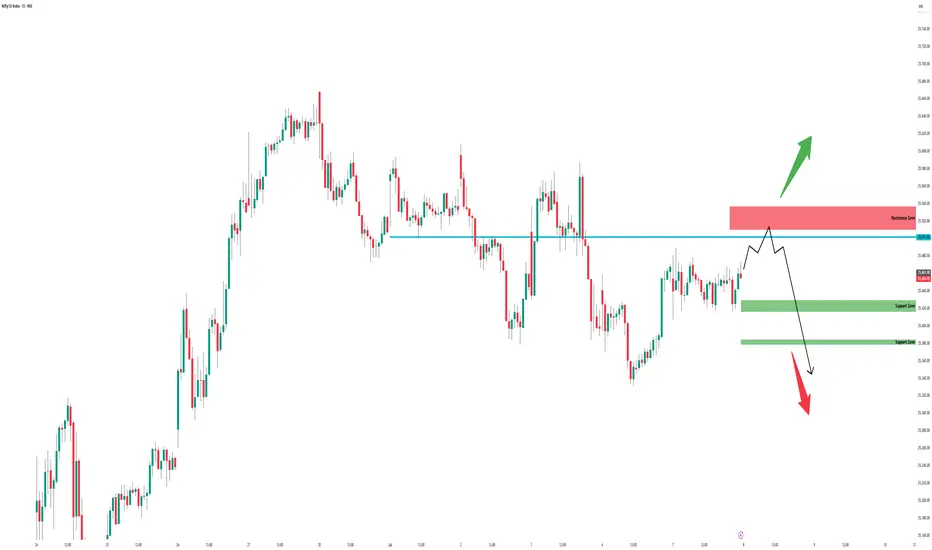
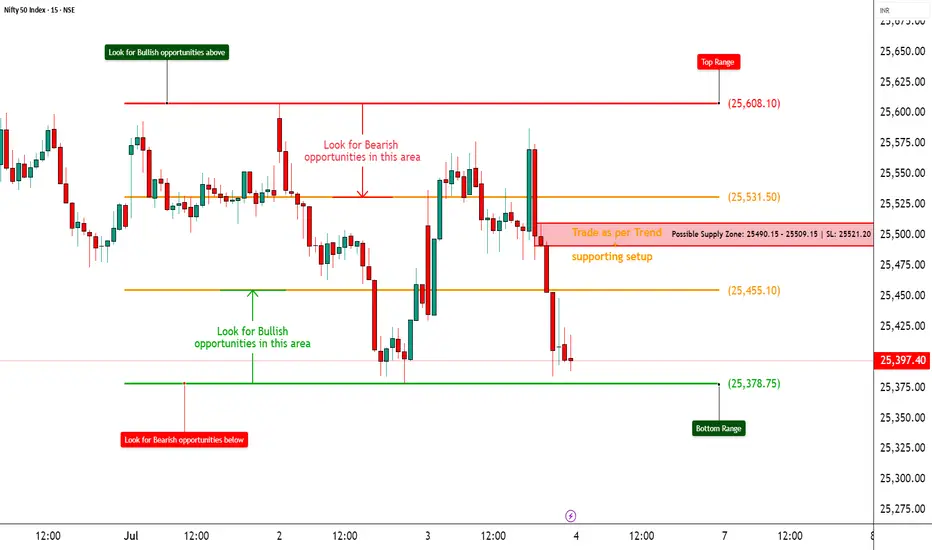
NIFTY – Range-Bound but Bearish Tilt Emerging📈 NIFTY – Range-Bound but Bearish Tilt Emerging | Option Chain + Price Action Analysis
🕒 Chart Type: 15-Minute
📆 Date: July 3, 2025
________________________________________
🔍 What’s Catching Our Eye:
NIFTY closed at ₹25,397.40, hugging the key support zone at ₹25,378. The index remains inside a well-defined range, but the sharp rejection from the ₹25,490–₹25,509 supply zone highlights sustained selling pressure. The failure to reclaim ₹25,455 signals caution from buyers.
________________________________________
📌 What We’re Watching For:
The ₹25,378 level is crucial. A breakdown below it with volume could ignite fast momentum towards ₹25,300–₹25,250. On the other side, a bullish reversal setup is only valid if NIFTY reclaims ₹25,455 with a strong candle and high volume. Option data tilts clearly bearish, showing confidence from institutions—not speculation.
________________________________________
📊 Volume Footprint:
Current volume stands at 293.43M, lower than the previous session’s 330.09M, indicating reduced participation and indecision. Watch for a volume spike below ₹25,378 (for breakdown confirmation) or above ₹25,455 (to validate reversal strength).
________________________________________
📈 Option Chain Highlights:
The 25,500 CE shows heavy short build-up, with OI sharply higher—clear sign of strong resistance. The 25,600 CE adds to that pressure with additional short positions. Meanwhile, 25,400 PE is witnessing long build-up, and strong OI in 25,000 PE shows downside anticipation. Overall, OI positioning strongly supports a bearish view.
________________________________________
🔁 Trend Bias:
🔴 Bearish unless NIFTY reclaims and sustains above ₹25,455
________________________________________
🧠 Trade Logic / Reasoning:
Price remains in a supply-driven setup, with a sharp rejection seen from ₹25,490–₹25,509. Support at ₹25,378 has held so far but looks increasingly fragile. Option chain behaviour reinforces this bearish bias—Call writers dominating higher levels and Put buyers building exposure at lower strikes.
________________________________________
📍 Important Levels to Mark:
🔺 Top Range: ₹25,608 – Look for breakout or reversal candlestick pattern + volume
🔻 Bottom Range: ₹25,378 – Watch for breakdown or bullish reversal pattern + volume
________________________________________
🎯 Trade Plan (Educational Purpose Only):
✅ Best Sell: Long - 25,400 PE – If breakdown below ₹25,378 confirms with volume
✅ Best Buy: Long 25,300 CE if price reclaims ₹25,455 + ₹25,490 zone with a strong bullish candle + volume
🟢 Demand Zone: NA
🔴 Supply Zone: ₹25,490–₹25,509 (Confirmed rejection area)
⚠️ Invalidation Below:
Bullish view becomes invalid if NIFTY breaks and holds below ₹25,378 with strong volume
Bearish view loses strength if NIFTY reclaims ₹25,455 with follow-through
________________________________________
⚠️ Disclaimer:
This post is for educational purposes only.
STWP is not a SEBI-registered advisor.
This is not a buy/sell recommendation.
Please consult your financial advisor before trading.
STWP is not responsible for any trading outcomes.
________________________________________
💬 Found this helpful?
Drop your thoughts in the comments ⬇️
🔁 Share with fellow traders
✅ Follow STWP for zone-based price action & option chain insights
🚀 Let’s boost awareness of smart & patient trading!
Nifty - Intraday levels & Prediction for - 04 Jul 2025Nifty Prediction for Tomorrow:
Trend : Sideways to BEARISH Continuation
Sentiment : Negative
Expectation : Nifty looks weaker and possibility of going down upto 25200/25100 levels
Look for Buy/Sell at Demand and Supply zone for profitable trades.
Demand and Supply Zones - When price breaks the zone, Demand zone will become Resistance and Supply zone will become Support.
Refer the chart for detailed Intraday Support and Resistance levels.
Trading with Professionalsnvesting Basics
Investing involves allocating money into assets with the expectation of generating income or profit over time. Unlike trading, investing usually focuses on long-term wealth building.
Investment Vehicles:
Stocks: Equity ownership in companies.
Bonds: Fixed-income securities.
Mutual Funds: Pooled investments managed by professionals.
ETFs: Funds that track indices and can be traded like stocks.
Real Estate: Property investments.
Investment Strategies:
Value Investing: Buying undervalued stocks.
Growth Investing: Investing in companies with high growth potential.
Dividend Investing: Focusing on stocks that provide regular income.
Risk Management in Investing:
Diversification across sectors and asset classes.
Regular portfolio rebalancing.
Long-term focus to absorb short-term volatility

Institutional TradingDivergence Trading
Divergence trading is a technical strategy based on the observation that asset prices and their related indicators (like RSI, MACD, etc.) sometimes move in opposite directions.
Types of Divergence:
Regular Divergence: Predicts potential trend reversals.
Hidden Divergence: Suggests trend continuation.
Tools Used:
Relative Strength Index (RSI)
Moving Average Convergence Divergence (MACD)
Stochastic Oscillator
How Divergence Works:
If prices are making new highs but the indicator isn’t, it signals weakening momentum and a possible reversal.
If prices are making new lows but the indicator isn’t, it could indicate that selling pressure is fading.
Benefits:
Early identification of potential trend changes.
Effective in volatile markets.
Risks:
False signals can occur, leading to premature trade entries.

Master Institutional TradingBenefits of Option Trading:
Leverage with less capital.
Hedging against market risks.
Income generation through premium collection.
Risks of Option Trading:
Complex pricing structures.
Potential for significant losses if not properly managed.
Divergence Trading
Divergence trading is a technical strategy based on the observation that asset prices and their related indicators (like RSI, MACD, etc.) sometimes move in opposite directions.

APOLLOHOSP Soon to ATH??!!!Yessss!!!!!
Chart patterns looks prudent for the above titled opinion
Rounding bottom....with a Inverted H&S pattern awaiting a Breakout!!!!!!
Expecting a Breakout by this week or next.
We can make our entry after the breakout solid candle....
Just add it to your watchlist and keep an eye on it!!!!
will update once the breakout happens!!!!!
just my opinion....not an advice nor tip....
Thank you!!!!!!

Nifty - Intraday levels & Prediction for - 03 Jul 2025 (Expiry)Nifty Prediction for Tomorrow:
Trend : Sideways then BULLISH Reversal
Sentiment : Negative but will change to Positive
Expectation : Nifty almost tested 15m 200 EMA but still there is a gap to fill, once its done we can see good BULLISH reversal in Nifty for New high. Some sort of consolidation will take place in the first half then good move likely to come.
Look for Buy/Sell at Demand and Supply zone for profitable trades.
Demand and Supply Zones - When price breaks the zone, Demand zone will become Resistance and Supply zone will become Support.
Refer the chart for detailed Intraday Support and Resistance levels.