NIFTY KEY LEVELS FOR 01.10.2025NIFTY KEY LEVELS FOR 01.10.2025
RTF: 3 Minutes
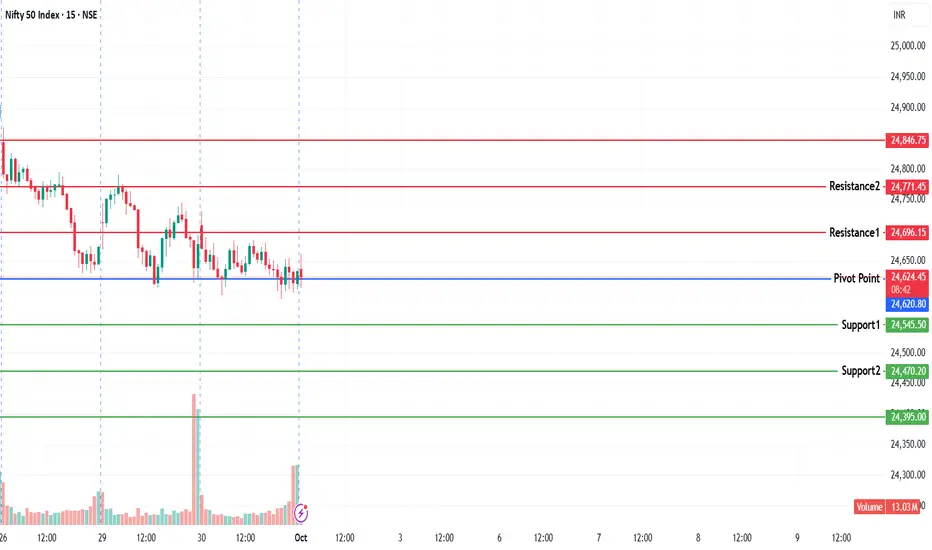
If the candle stays above the pivot point, it is considered a bullish bias; if it remains below, it indicates a bearish bias. Price may reverse near Resistance 1 or Support 1. If it moves further, the next potential reversal zone is near Resistance 2 or Support 2. If these levels are also broken, we can expect the trend.
When a support or resistance level is broken, it often reverses its role; a broken resistance becomes the new support, and a broken support becomes the new resistance.
If the range(R2-S2) is narrow, the market may become volatile or trend strongly. If the range is wide, the market is more likely to remain sideways
please like and share my idea if you find it helpful
📢 Disclaimer
I am not a SEBI-registered financial adviser.
The information, views, and ideas shared here are purely for educational and informational purposes only. They are not intended as investment advice or a recommendation to buy, sell, or hold any financial instruments.
Please consult with your SEBI-registered financial advisor before making any trading or investment decisions.
Trading and investing in the stock market involves risk, and you should do your own research and analysis. You are solely responsible for any decisions made based on this research.
Nifty50analysis
Nifty Intraday Expiry Setup! Sep 02 - Cup & Handle in Play!Body:
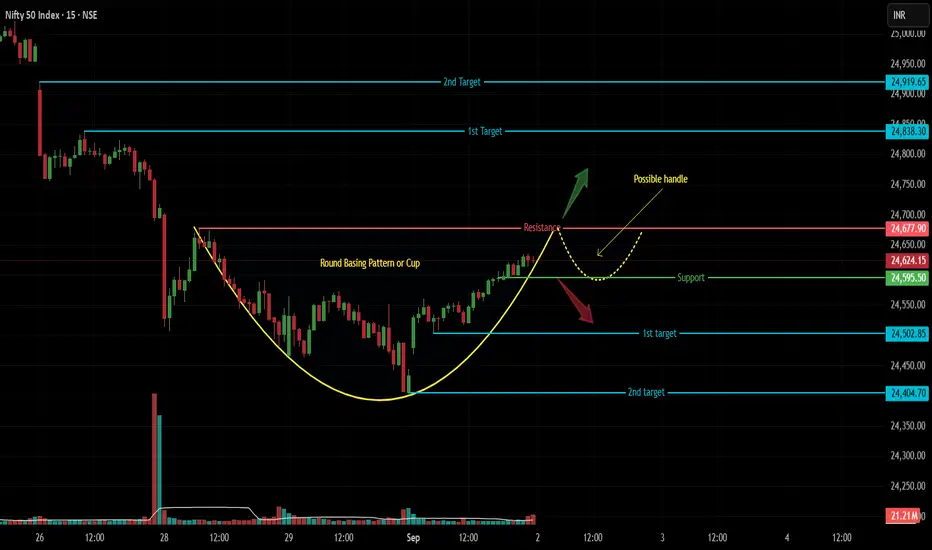
Nifty 15m is painting a classic price action setup! A nice rounding cup ☕ is aiming for the resistance zone ⚡
⚔️ Key Levels:
Resistance: 24680 - 24700
Support: 24595 - 24600
The Playbook:
✅ Handle Formation (Ideal): Price hits resistance, makes a U-turn to test 24595-600 as support to form the handle. Then we wait for the next breakout!
🔻 Break DOWN (Support Breaks):
T1: 24500
T2: 24400
🔺 Break UP (Resistance Breaks):
T1: 24800 - 24840
T2: 24900 - 24920
No directional trades between support & resistance! Wait for the break for a clear signal. 🚦
Disclaimer: This is purely an educational idea and not trading advice. Please do your own research and understand the risks involved before trading.
Boost 👍 and Follow for more price action ideas!
Nifty: The Unfilled Gap ScenarioNifty 1H Price Action Analysis (Week of 25th Aug) ⏰
Hey Traders! Let's break down the Nifty's juicy setup for the week.
The market left us a gift: The Nifty's powerful gap-up has left a major unfilled gap (24673 - 24852), a 179-point void that's calling price back! 📞🔻 Gaps are like market magnets 🧲—they have a strong tendency to get filled. Price has already tapped twice (18th & 22nd Aug) at the gap's roof (24850), treating it like a trampoline. But how long can the bounce last?
📍 The Key Levels & The Story:
The Floor (24850): This is our line in the sand. A solid break and close below this on the 1H chart could open the trapdoor 🚪, sending Nifty on a quick ride down to grab those gap points. It's the trade with the wind at its back.
The Ceiling (25150): This is the recent high and descending trendline resistance. A break above is exciting, but we're smart traders—we don't chase! 🏃💨 We've all been fakeout victims.
✅ The Bullish "No Fakeout" Plan:
To avoid getting trapped, we wait for a "Break-and-Retest"! If price punches above 25150, we don't buy the breakout. We wait patiently for price to come back and kiss the 25150 level and hold it as new support. That is our green light 🚦 and the high-probability long entry for a continued upmove!
The Bottom Line: Bears are eyeing the gap. Bulls need to prove their strength with a clean break and hold above 25150. Neutral until one side wins!
Bank Nifty Hint: Unlike Nifty, Bank Nifty has already filled its similar gap, suggesting Nifty might be next in line to complete the move.
Trading Plan:
Short Signal: Break & close below 24850. 🎯 Target: The Gap Zone.
Long Signal: Break ABOVE 25150, then wait for a pullback that finds support at 25150.
⚠️ Disclaimer: This is strictly an intraday idea for educational purposes. Trading is incredibly risky and you can lose your capital. This is not advice.
Found this helpful? Please give it a Boost! 🔥
What stocks should we dive into next? Let me know below! 👇😊

Nifty Trend AnalysisNifty has completed its corrective Wave B at 25,151 (Spot). It has now begun a sharp correction to complete Wave C. If this is a zig-zag correction, then Wave C is expected to end around 23,720, with TP2 at 22,936. The level of 23,463 will also play a crucial role in between. Generally, Wave 2 tends to be a slow correction phase where institutional accumulation takes place. If the price bounces to 24,917–24,876 or 24,952–25,068, these should be considered selling opportunities.

ULTRACEMCO: Wave C started from strong Fib clusterULTRACEMCO – Daily Chart Analysis
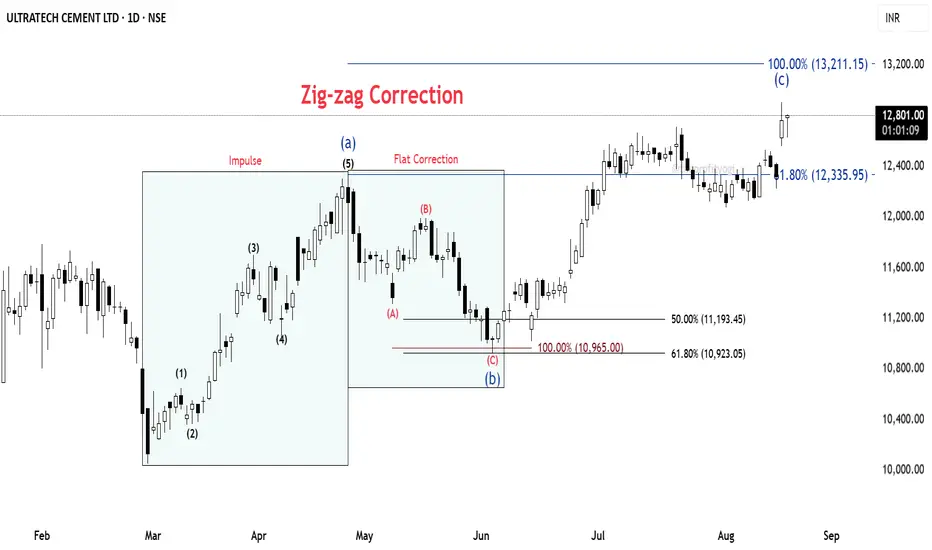
🔹 Base Point: The count begins from the low made on 3rd March 2025.
🔹 From this low, the price moved up in the form of a clear impulse wave, completing a 5-wave structure.
🔹 This was followed by a corrective fall, retracing 61.8% Fibonacci of the prior impulse.
⚡ Correction Phase:
The decline is counted as an ABC Flat correction (red).
Within this, the C wave extended fully to the 100% Fibonacci projection.
At this point, we observe a strong cluster zone formed by the 61.8% retracement and 100% extension, indicating confluence and potential support.
📈 Current Development:
From this support, the price has begun to move up again, showing the characteristics of a fresh impulse.
The overall structure fits into a larger Zig-Zag correction, where Wave C is still under development.⏳
📝 Summary:
✅ Impulse up (5 waves)
✅ Flat correction (A-B-C) complete at Fib cluster
🚀 Wave C of Zig-Zag unfolding
#ULTRACEMCO #NSEStocks #ElliottWave #Fibonacci #WaveAnalysis #TradingSetup #PriceAction
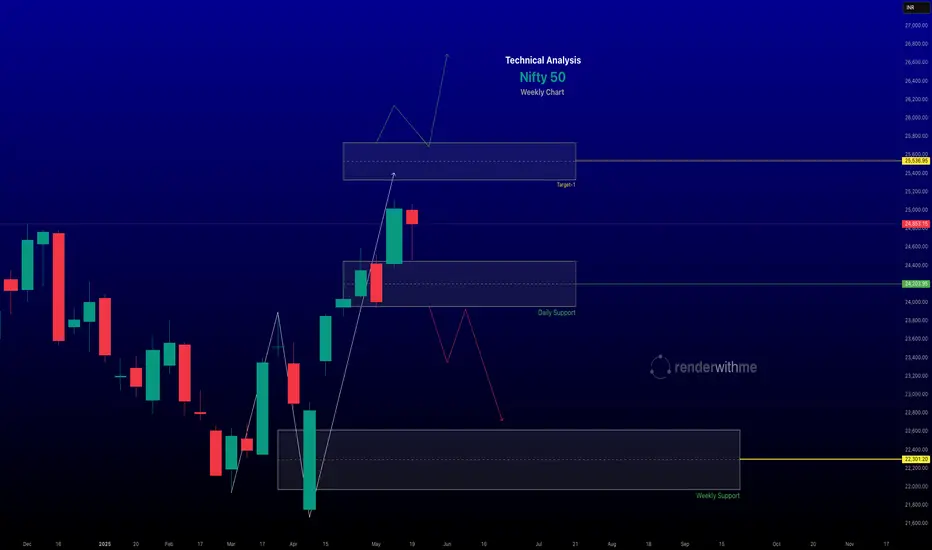
Nifty 50 Weekly: Inverted H&S Breakout Confirmation Awaited!Pattern & Breakout:
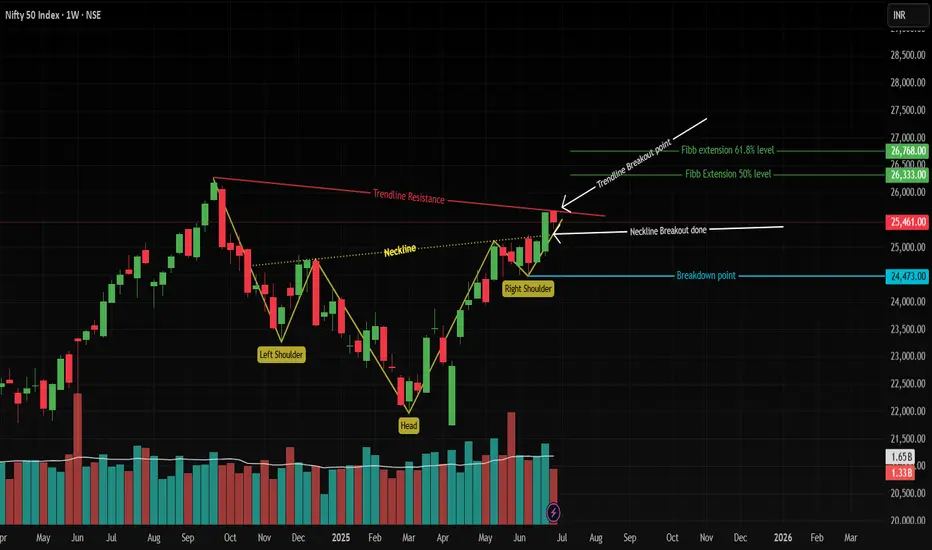
Inverted Head & Shoulders formed on the weekly chart (bullish reversal pattern). ✅
Neckline breakout occurred last week, but confirmation pending! This week failed to close above breakout level.
Confluence Alert: Weekly close above breakout level = Trendline resistance (red) breakout! 🚀
Targets (If Confirmed):
50% Fib extension: 26,333 📈
61.8% Fib extension: 26,768 🎯
(Fib drawn from 3rd March 2025 swing)
Key Invalidation:
Right Shoulder Low: 24,473 (blue line). Break below = pattern failed! ⚠️
Action Plan:
Wait for weekly close ABOVE neckline breakout.
Enter longs on confirmation (targets: 26,333 → 26,768).
Stop loss: Below 24,473.
Disclaimer:
This analysis is for educational purposes only. Trade at your own risk. Past performance isn’t indicative of future results. Always conduct your own research or consult a financial advisor. 📉💰
Boost visibility: 👍 Like | 💬 Comment | 🔔 Follow
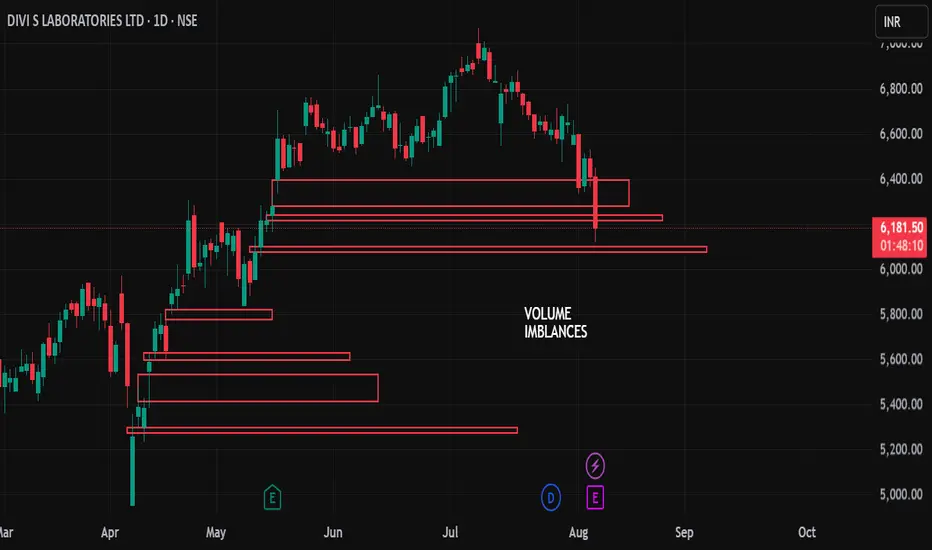
Understanding Volume ImbalancesUnderstanding Volume Imbalances – The Market’s Unfinished Business
A Volume Imbalance occurs when price moves very quickly upward or downward, leaving behind price zones where little or no trading has taken place – often called No Trade Zones. These imbalances can be spotted on the daily timeframe and are similar in nature to gap ups or gap downs. They typically happen due to strong news, institutional activity, or sudden shifts in sentiment. Market behavior shows that these gaps are often “filled” within 2–3 months, as price revisits these levels to balance out trading activity. For traders, these zones act as important reference points for future support, resistance, or potential trade targets.
#VolumeImbalance #PriceAction #GapTrading #MarketStructure #TechnicalAnalysis #TrueDirections1
Nifty50 Trend Analysis Daily TFNifty 50 is currently in a corrective phase, forming wave 4 on the daily time frame. Given the long-term bullish outlook of the market, wave 4 is expected to be a shallow correction, potentially ending around 24,821 or 24,311. A deep correction down to 23,898 is also possible, but the probability of this is low—around 10%, unless wave 5 becomes trapped in a complex triple-three corrective pattern.
The direction of Nifty 50 is strongly correlated with Reliance Industries' price movement. If Reliance fails to reverse from the ₹1,373 level, it may drop further to ₹1,332. In that case, Nifty 50 is unlikely to regain bullish momentum and may continue to consolidate sideways until Reliance completes its correction.
Key Levels to Watch:
Nifty 50: 24,821 (shallow correction), 24,311 (support), 23,898 (deep correction - low probability)
Reliance Industries: ₹1,373 (key support), ₹1,332 (deep correction level)
A strong bullish rally in the broader market is likely only if Nifty 50 finds support around 24,821 and Reliance reverses from ₹1,373.

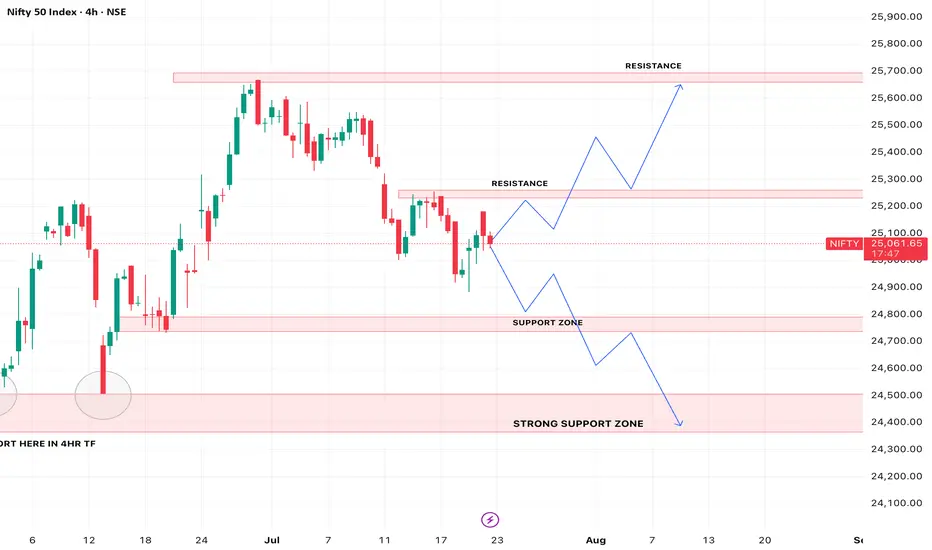
NIfty50 analysis for 23/07/2025nifty has been in a bearish trend over the past week and recently faced a strong rejection from the 25180–25200 zone, which aligns with a key resistance level on the daily time frame. price action suggests a possible retracement toward the 24780–24800 support zone. this area holds significance as a potential demand zone. it’s crucial to observe price behavior around this level — a strong reaction here could offer clues for the next directional move. wait for confirmation before taking any fresh positions.
NIFTY50Nifty could 📉 fall to below level 24850 within 18th July 2025 or to the white line marked on the chart.
Even there's a high possibility that 24850 could break and it could even fall 📉 to below red dashed line 24370 within last week of july 2025.
Disclaimer:
It's a personal view not a financial advice and I assume no responsibility and liability whatever outcome arises.

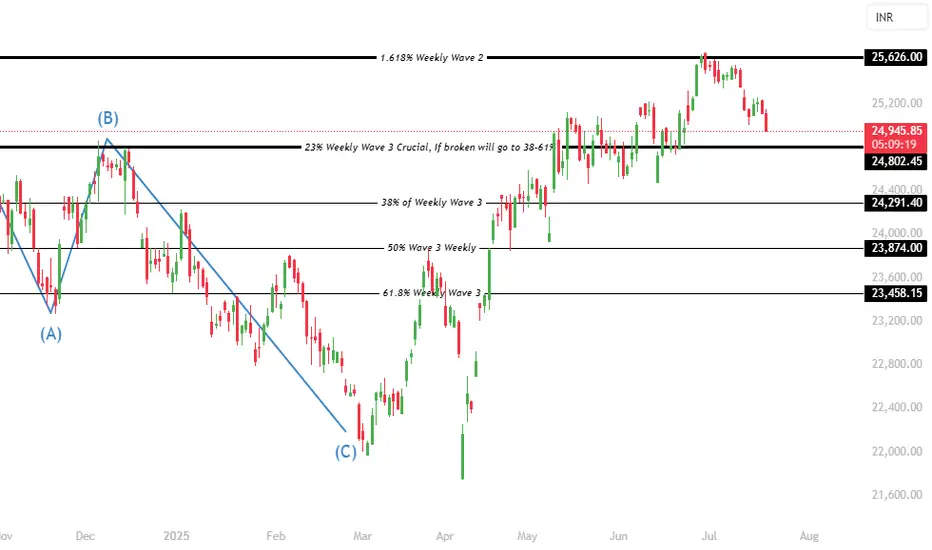
Nifty 50 Trend Analysis A detailed wave analysis in larger times frames indicates that nifty is beginning to trigger a sharp or moderate momentum deep correction. The correction & downtrend can last upto 23874 & 23458 potentially. In a downtrend, institutions will sell on every rise, hence its not the right time to make new investments directly in the stocks. Currently nifty is trading at 25073 and this swing momentum can go upto 24802 without reversals, and 24802 will play a crucial role but since the wave 3 has completed its maximum levels we need to brace for 23874 & 23458.
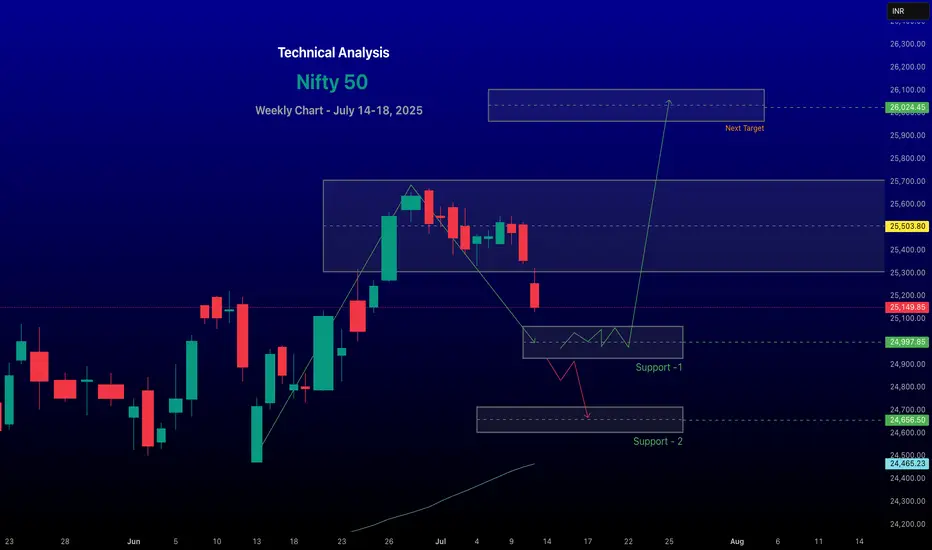
renderwithme | Nifty 50's movement for the week of July 14–18, Predicting the Nifty 50's movement for the week of July 14–18, 2025,
Involves analyzing recent market trends, technical indicators, and macroeconomic factors based on available data. Here’s a concise analysis:Market ContextRecent Performance: The Nifty 50 closed at 25,149.85 on July 11, 2025, down 0.78% from the previous day, reflecting a bearish session driven by losses in IT, auto, and oil & gas stocks. The index has been volatile, with a weekly decline of 0.59% but a monthly gain of 0.63%.
# Global Cues:
Mixed global market trends are influencing sentiment. U.S. markets are at record highs, but Wall Street futures are down, and Asian markets are mixed (e.g., Nikkei 225 up, Hang Seng down). The looming U.S. tariff deadline and potential U.S.–India trade agreement talks are key events to watch.
#FII/DII Activity:
Foreign Institutional Investors (FIIs) have been selling, which may weigh on short-term sentiment, while Domestic Institutional Investors (DIIs) could provide support.
~~ Technical Analysis ~~
Trend: The Nifty 50 is in a broader uptrend but showing signs of a short-term correction. It closed below the key level of 25,400, indicating potential weakness. Technical indicators suggest a sideways to bearish bias for the near term.
#Support and Resistance:
Support: Key support lies at 24,900–25,133. A break below 24,900 could lead to further declines toward 24,700 or 24,500.
Resistance: Immediate resistance is at 25,500–25,650. A sustained move above 25,650 could signal bullish momentum toward 25,770–26,000.
# Indicators:
Moving Averages: The index is above its 20-day, 50-day, and 200-day EMAs, supporting a bullish long-term trend, but recent selling pressure at higher levels indicates consolidation.
# Sectoral Outlook
Bullish Sectors: Banking, pharma, realty, oil & gas, and media showed resilience last week, with stocks like HDFC Bank, Bajaj Finance, and Coal India gaining.
Bearish Sectors: IT, metals, telecom, and auto underperformed. IT stocks like TCS, HCL Tech, and Infosys dragged the index due to weak Q1 results (e.g., TCS reported a 6% profit increase but faced margin pressure).
Key Events to WatchU.S.–India Trade Talks: Clarity on a potential interim trade agreement could boost sentiment, especially for export-oriented sectors.
FOMC Minutes: The release of FOMC minutes may influence global rate expectations, impacting FII flows.
Forecast for July 14–18, 2025Expected Range: The Nifty 50 is likely to trade between 25,000–25,750. A break below 24,900 could test 24,500, while a move above 25,650 may target 26,000.
~~ Disclaimer --
This analysis is based on recent technical data and market sentiment from web sources. It is for informational purposes only and not financial advice. Trading involves high risks, and past performance does not guarantee future results. Always conduct your own research or consult a SEBI-registered advisor before trading.
#Boost and comment will be highly appreciated
Nifty Starts July Quietly; Sideways Action May ContinueNifty began the month on a subdued note, registering a net weekly loss of 176.80 points (-0.69%). Market volatility also eased, with the India VIX declining by 0.59% to 12.31, indicating reduced trader anxiety.
From a technical standpoint, an immediate resistance zone has developed between 25,500 and 25,650, while a key support range lies between 25,200 and 25,300.
Open Interest (OI) data adds weight to these levels, with a significant build-up of call writing at 25,500 suggesting strong resistance, and put writing at 25,200 indicating solid support.
Looking ahead, Nifty is expected to remain range-bound between these two zones unless a decisive breakout or breakdown occurs.

NIFTY – Range-Bound but Bearish Tilt Emerging📈 NIFTY – Range-Bound but Bearish Tilt Emerging | Option Chain + Price Action Analysis
🕒 Chart Type: 15-Minute
📆 Date: July 3, 2025
________________________________________
🔍 What’s Catching Our Eye:
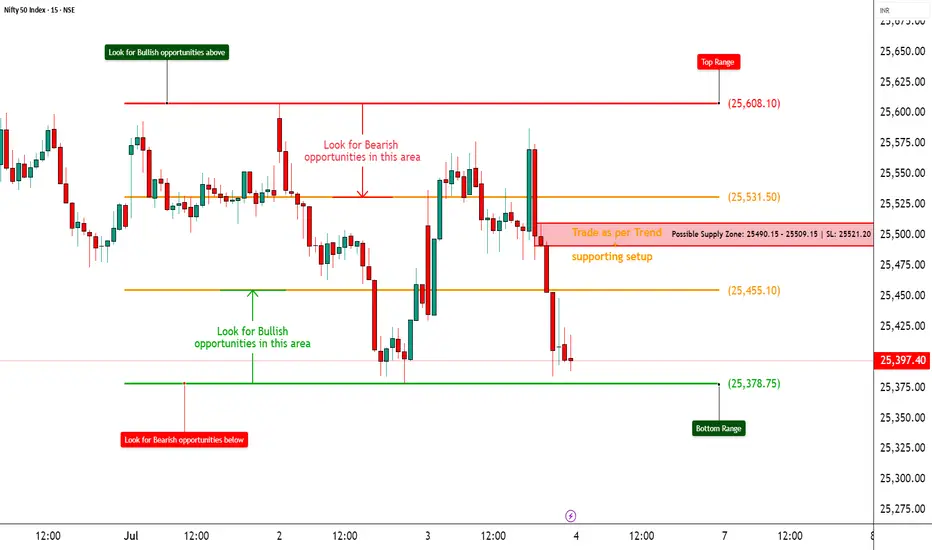
NIFTY closed at ₹25,397.40, hugging the key support zone at ₹25,378. The index remains inside a well-defined range, but the sharp rejection from the ₹25,490–₹25,509 supply zone highlights sustained selling pressure. The failure to reclaim ₹25,455 signals caution from buyers.
________________________________________
📌 What We’re Watching For:
The ₹25,378 level is crucial. A breakdown below it with volume could ignite fast momentum towards ₹25,300–₹25,250. On the other side, a bullish reversal setup is only valid if NIFTY reclaims ₹25,455 with a strong candle and high volume. Option data tilts clearly bearish, showing confidence from institutions—not speculation.
________________________________________
📊 Volume Footprint:
Current volume stands at 293.43M, lower than the previous session’s 330.09M, indicating reduced participation and indecision. Watch for a volume spike below ₹25,378 (for breakdown confirmation) or above ₹25,455 (to validate reversal strength).
________________________________________
📈 Option Chain Highlights:
The 25,500 CE shows heavy short build-up, with OI sharply higher—clear sign of strong resistance. The 25,600 CE adds to that pressure with additional short positions. Meanwhile, 25,400 PE is witnessing long build-up, and strong OI in 25,000 PE shows downside anticipation. Overall, OI positioning strongly supports a bearish view.
________________________________________
🔁 Trend Bias:
🔴 Bearish unless NIFTY reclaims and sustains above ₹25,455
________________________________________
🧠 Trade Logic / Reasoning:
Price remains in a supply-driven setup, with a sharp rejection seen from ₹25,490–₹25,509. Support at ₹25,378 has held so far but looks increasingly fragile. Option chain behaviour reinforces this bearish bias—Call writers dominating higher levels and Put buyers building exposure at lower strikes.
________________________________________
📍 Important Levels to Mark:
🔺 Top Range: ₹25,608 – Look for breakout or reversal candlestick pattern + volume
🔻 Bottom Range: ₹25,378 – Watch for breakdown or bullish reversal pattern + volume
________________________________________
🎯 Trade Plan (Educational Purpose Only):
✅ Best Sell: Long - 25,400 PE – If breakdown below ₹25,378 confirms with volume
✅ Best Buy: Long 25,300 CE if price reclaims ₹25,455 + ₹25,490 zone with a strong bullish candle + volume
🟢 Demand Zone: NA
🔴 Supply Zone: ₹25,490–₹25,509 (Confirmed rejection area)
⚠️ Invalidation Below:
Bullish view becomes invalid if NIFTY breaks and holds below ₹25,378 with strong volume
Bearish view loses strength if NIFTY reclaims ₹25,455 with follow-through
________________________________________
⚠️ Disclaimer:
This post is for educational purposes only.
STWP is not a SEBI-registered advisor.
This is not a buy/sell recommendation.
Please consult your financial advisor before trading.
STWP is not responsible for any trading outcomes.
________________________________________
💬 Found this helpful?
Drop your thoughts in the comments ⬇️
🔁 Share with fellow traders
✅ Follow STWP for zone-based price action & option chain insights
🚀 Let’s boost awareness of smart & patient trading!
Nifty 50 weekly Analysis for June 28, - 04, July 2025
~~ Nifty 50 Analysis for June 28, 2025 ~~
As of June 28, 2025, the Nifty 50 index continues to exhibit a bullish bias with cautious undertones, driven by global market sentiment, domestic buying, and technical patterns. Below is a comprehensive analysis based on the latest available data and market insights.
# Market Performance Overview
Previous Close (June 27, 2025): The Nifty 50 closed at 25,637.80, up 88.80 points (+0.35%), reflecting a positive session driven by select sectors.
Market Context: The index has been on a four-day gaining streak, supported by positive global cues, including easing geopolitical tensions (e.g., ceasefire between Israel and Iran), falling crude oil prices, and dovish signals from the U.S. Federal Reserve, which have boosted risk appetite.
##Technical Analysis
Trend and Momentum:
The Nifty 50 is trading within an ascending channel on the daily timeframe, indicating a bullish structure. On the weekly timeframe, it is forming an Ascending Triangle Pattern, a bullish setup that could lead to a breakout if the index sustains above 25,300.
The index is above key Exponential Moving Averages (EMAs) (20-day, 50-day, 100-day, and 200-day), reinforcing the bullish trend. The weekly chart shows alignment above the 20-week, 50-week, and 200-week EMAs, with an Inside Bar pattern indicating buying interest on dips.
Relative Strength Index (RSI): The RSI is at 49.90–64.58, reflecting neutral momentum. It is neither overbought nor oversold, suggesting room for movement in either direction depending on fresh triggers.
MACD: The MACD for the broader index is indecisive, with some constituents (e.g., HCL Technologies) showing bullish signals, while others (e.g., Hero MotoCorp) are bearish.
Support and Resistance Levels:
Support: Immediate support is at 25,130–25,060, with stronger support at 24,800–24,650. A break below 24,500 could lead to a deeper correction toward 24,300–24,400.
Resistance: The index faces resistance at 25,600–25,700, with a breakout above this zone potentially targeting 26,100, close to the all-time high of 26,277.35 (Sep 27, 2024).
A sustained move above 25,300 could confirm bullish continuation, while failure to break 25,700 may lead to profit booking.
Next Weekly Target 26,800 - 27,000 Chart posted for your reference only
-- Disclaimer --
This analysis is based on recent technical data and market sentiment from web sources. It is for informational purposes only and not financial advice. Trading involves high risks, and past performance does not guarantee future results. Always conduct your own research or consult a SEBI-registered advisor before trading.
#Boost and comment will be highly appreciated

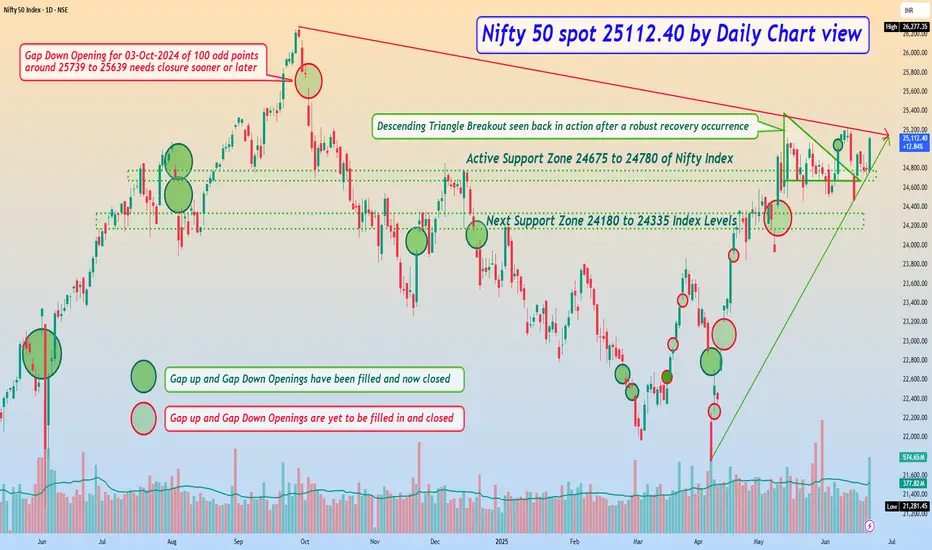
Nifty 50 spot 25112.40 by Daily Chart view - Weekly update*Nifty 50 spot 25112.40 by Daily Chart view - Weekly update*
- Active Support Zone 24675 to 24780 of Nifty Index
- Next Support Zone 24180 to 24335 of Nifty Index Levels
- Resistance Zone seen at 25200 to 25335 of Nifty 50 Index Levels
- Descending Triangle Breakout seen back in action after a robust recovery occurrence
- *Rising Support Trendline seems to have come into active mode but yet needs a stronghold*
Nifty Weekly Outlook: Volatility Ahead Amid Global Tensions● Despite briefly breaking above the 25,100 resistance last week, Nifty failed to sustain the momentum and witnessed a corrective pullback towards the 24,500 level.
● Market volatility ticked up, with India VIX rising by 3.08% to 15.08 on a weekly basis, reflecting growing investor nervousness.
● Geopolitical tensions—particularly the escalating conflict between Israel and Iran—are weighing on global sentiment, and Indian equities are not immune to this uncertainty. However, relative strength in the Indian markets suggests that they may continue to outperform global peers in the near term.
● For the upcoming week, Nifty is expected to remain highly volatile, with wide-range oscillations likely. A directional trend may only emerge if Nifty decisively breaches 25,100 on the upside or breaks below the key support at 24,500.
● Options data indicates that the 25,000 level will act as a strong resistance, while 24,500 remains a crucial support zone.
● Importantly, if the index opens below 24,400 at the start of the week, it could invite further selling pressure, tipping the balance in favor of the bears.
● Given the global headwinds and sensitive technical setup, traders are advised to stay cautious as heightened volatility could dominate the week ahead.
Bulls on Standby: Can Nifty Unleash Its Next Leg Higher?As anticipated, Nifty consolidated within a 600-point range between 24,500 and 25,100 last week, ending with a modest weekly gain of around 1%.
Volatility eased as well, with India VIX declining by 9% to close at 14.63, reflecting improved market stability.
Open Interest (OI) data indicates immediate support at 24,800, backed by the highest concentration of put writing.
Looking ahead, there is a strong possibility that Nifty may breach the 25,100 resistance level in the coming sessions, which could trigger a swift rally toward the 25,500 mark.
Nifty's Baby Shower: Will Mother Candle Deliver Before Expiry?👶📉📈
Will Mama Candle Deliver Before Expiry or Hold the Bump?
Hey traders, grab your popcorn (or baby carrots) because the Nifty is hosting a drama worthy of a maternity ward! Let’s break down this prenatal price action without any fancy indicators—just pure candle gossip !
The "Mother Candle" Saga
On May 15th, Nifty formed a MOTHER CANDLE (high: 25116, low: 24500) that’s been “pregnant” with 8 little baby candles. That’s right, 8 days of consolidation, and Mama’s still holding her ground. Will she deliver a explosive breakout before the expiry, or is this a false pregnancy? Let’s diagnose:
Key Levels to Watch (aka The Baby Monitor)
Due Date Resistance: 25116 (Mama’s high). Break this, and we’re naming the firstborn “Rocket Singh” 🚀.
Support Zone: 24500-ish (Mama’s comfy yoga pants zone). Hold here, and the bulls get baby shower confetti.
Critical Breakdown: 24700. Crack this, and it’s a slippery slope to 24500. Close below? Call it a "Failed Pregnancy" :(
The Obstetrician’s Bias (Spoiler: Bullish)
The price action suggests Mama Candle’s still got that pregnancy glow. Bulls are sipping coconut water, waiting for contractions (read: breakout). But if 24700 breaks, the midwives (bears) might rush in with forceps.
Will the Water Break This Week?
Bull Case: Mama holds 24500, pops above 25116, and we’re all godparents to a fresh uptrend. Baby shower theme: “All-Time Highs & Diaper Flys.”
Bear Case: A breakdown to 24500 turns into a ”diaper blowout”—messy, stinky, and nobody’s happy.
Trade Setup: Pack Your Hospital Bag
Long Entry: If Nifty snuggles above 24700 and eyes 25116. Bring tissues for happy tears.
Short Trigger: Close below 24500. Cancel the baby registry and buy bearish pacifiers.
Stop Loss: For bulls, keep it tight below 24500. For bears? Don’t get kicked out of the delivery room.
Final Thought: The expiry clock is ticking louder than a 3 AM baby monitor. Will Mama Candle push this week, or will the 24500 support double as a crib? Either way, keep your charts clean and your risk management tighter than a onesie.
Disclaimer: No actual candles or babies were harmed in this analysis. Trade at your own risk—parenthood (and trading) is unpredictable! 🍼🕯️

Nifty Outlook: Sideways Action Likely as June OpensAs anticipated last week, Nifty traded sideways, showing limited movement.
The current technical setup indicates the index may continue to remain range-bound in the upcoming week.
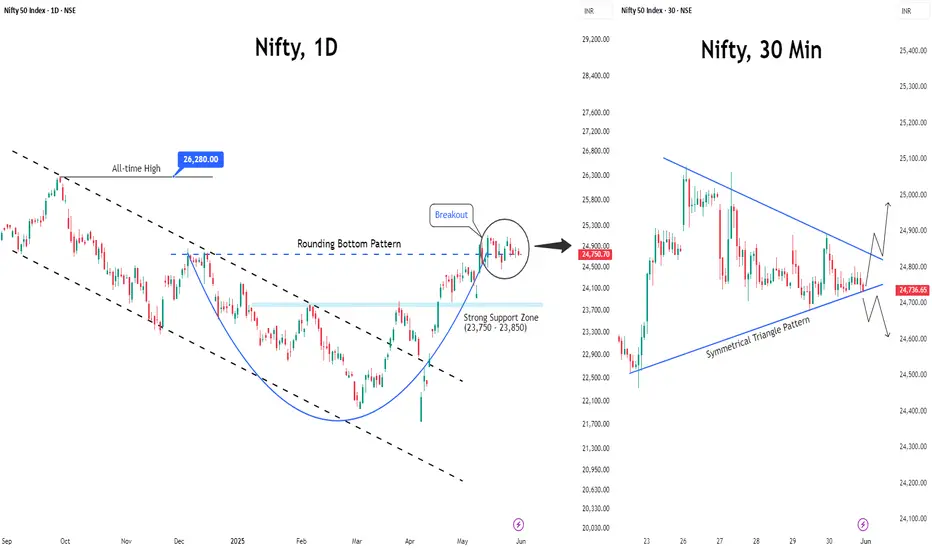
On the 30-minute chart, a symmetrical triangle pattern has formed, suggesting that a breakout in either direction could lead to a swift, short-term move.
Key Levels to Watch
Support: 24,500
Resistance: 25,100 – 25,150
A decisive breakout above 25,100, confirmed by two consecutive closes, could pave the way for a rally toward the 25,500 mark.
Meanwhile, Foreign Institutional Investors (FIIs) have cut their long positions to nearly half of April–May levels, reflecting a more cautious stance. Still, their net buying in the previous months, along with upcoming catalysts like the RBI policy announcement on June 6 and the progress of the monsoon, could potentially reignite market momentum.
Nifty to Stay in Pause Mode Ahead of Expiry WeekAfter a strong run, the Nifty rally seems to be losing steam and has now slipped into consolidation mode. With the monthly derivatives expiry coming up next week, the market is likely to remain range-bound.
Options data suggests that Nifty has carved out a trading range between 24,500 and 25,100. Until we see a decisive move beyond either end of this 600-point band, don’t expect a strong directional trend.
A clear breakout above 25,100 could reignite bullish momentum, while a breach below 24,500 might invite fresh selling pressure. Until then, it’s all about sideways action and expiry-driven volatility.

Nifty 50 Weekly Technical Analysis for May 26–30, 2025- Nifty 50 Technical Analysis for May 26–30, 2025 -
# Current Market Context
Recent Performance: As of May 23, 2025, the Nifty 50 closed at 24,853.15, up 243.45 points (0.99%), snapping a three-day losing streak. The index has shown resilience, supported by broad-based buying in financials, Pharma, and IT sectors.
- Market Sentiment: indicate a cautiously bullish outlook for the week targeting 25,300–25,700, driven by a positive weekly close and potential short covering. However, resistance near 25,000
# Key Technical Levels
- Support Levels:
Immediate support is at 24,400–24,000, aligning with the 20-day EMA and recent lows. A break and close below 24,000 could lead to further selling toward 24,099 or 23,500, a strong support level backed by put option open interest.
Weekly pivot support is at 23,559, with deeper support at 23,000.
- Resistance Levels:
Immediate resistance is at 25,000, with a confluence of weekly and monthly resistance at 25,297–25,575, reinforced by Fibonacci Retracement levels.
A sustained break above 25,100 could target 25,500–25,700, with potential for 26,161 by expiry if momentum persists.
-- Disclaimer --
This analysis is based on recent technical data and market sentiment from web sources and X posts. It is for informational purposes only and not financial advice. Trading involves high risks, and past performance does not guarantee future results. Always conduct your own research or consult a SEBI-registered advisor before trading.
E&OE
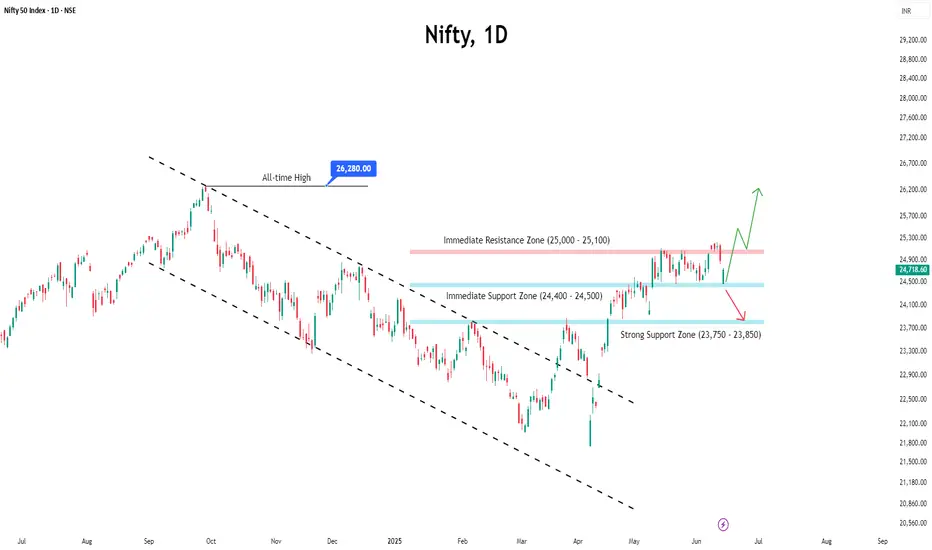
Nifty Breaks Past 25,000: Is a New High on the Horizon?Last week, Nifty broke above the psychological milestone of 25,000, shaking off market doubts and sparking fresh bullish momentum.
◉ Key levels to watch:
The zone between 24,750–24,850 now acts as immediate support, while 23,750–23,850 remains a major support.
This rally wasn't just a technical bounce — it was fuelled by meaningful tailwinds:
● India-Pakistan Ceasefire helped ease geopolitical concerns, calming the nerves of investors.
● Cooling inflation in both India and the U.S. sparked hopes of rate cuts, improving market liquidity.
● Strong corporate earnings from majors like Hero MotoCorp , HCL Tech , and Tata Motors lifted sentiment.
With continued FII inflows , the bullish momentum is expected to persist — potentially pushing Nifty toward its all-time high in the near term.
