Banking Sector Boost Nifty to New Levels: What’s Coming Next?The Nifty has shown a clear turnaround with a double bottom pattern and has broken past the 23,800 level. This strong move is mostly thanks to the banking sector, especially with great Q4 results from HDFC Bank and ICICI Bank.
The Bank Nifty, now trading just below its all-time high, might struggle near 55,000—a zone that previously triggered a pullback, leading to consolidation in the broader market.
For Nifty, the immediate resistance is seen at the 24,000 level, where significant call writing activity may pose a hurdle. On the downside, a breach below 23,500 could signal a potential reversal, dragging the index into a downtrend once again.
Nifty50analysis

Nifty50 Index Analysis by Stock EngineersNifty50 Index Analysis -
Trend analysis as per Dow theory.
Important candle at the bottom of swing.
Trump tariff news impact on the market.
Gap theory in the market.
Importance of the today's candle and it's closing.
What would be the next step and level to observe.
- All above points are discussed in the above Video Analysis.

NIFTY ViewNIFTY chart analysis showing general view for coming weeks.
Chart shows its in bearish mode untill it breakout channel. It has more chances to go down before breaking that.

NIFTY50 - AN INGISHT FOR INVESTORSSymbol - NIFTY50
CMP 25305
If you are a long term investor, one thing that will help you to decide when to invest - Nifty monthly RSI.
As and when RSI moved above 80, markets uniformly correctly (around 20% usually) & as and when RSI came below 40 level, markets uniformly rallied.
Now RSI is at 82
Fundamentals are also showing that overall market is modestly overvalued.
What you want to do or should you be worried ?
tell me in comments below.
P.S. : I'm out of all longs & have entered shorts.

NIFTY 50 next week levels?Will Nifty50 go to the level of 22,100 next week?
Or will the bulls be awake at the level of 22,416 and take Nifty50 above 24,024?
Let`s find out next week.
until have a good holiday guys.
Nifty 50 upcoming levelThe Nifty 50 has recently formed a bottom around 21,964.
Nifty is showing a one-directional move from that level, and momentum is increasing with each candle.
Previously, Nifty faced resistance around 23,780, and the current price is 23,658, just 120 points away from the previous resistance.
After a quick rally, Nifty 50 may encounter resistance near 23,780, and an Inverse Head & Shoulders formation is possible.
Note: Resistance does not guarantee a confirmed reversal, but we need to monitor price action at that level to determine whether it is breaking and sustaining the resistance.
Stay tuned for more updates!
Hit the Boost button for regular updates!

Nifty50 Dow TheoryDOW THEORY Update-
After New Dow Top "Y", now we have made new Dow Bottom "Z" as well.
* W is the previous significant swing high here.
* X is the current significant swing low here.
* Y is the current significant swing high here.
* Z is the current significant swing low here.

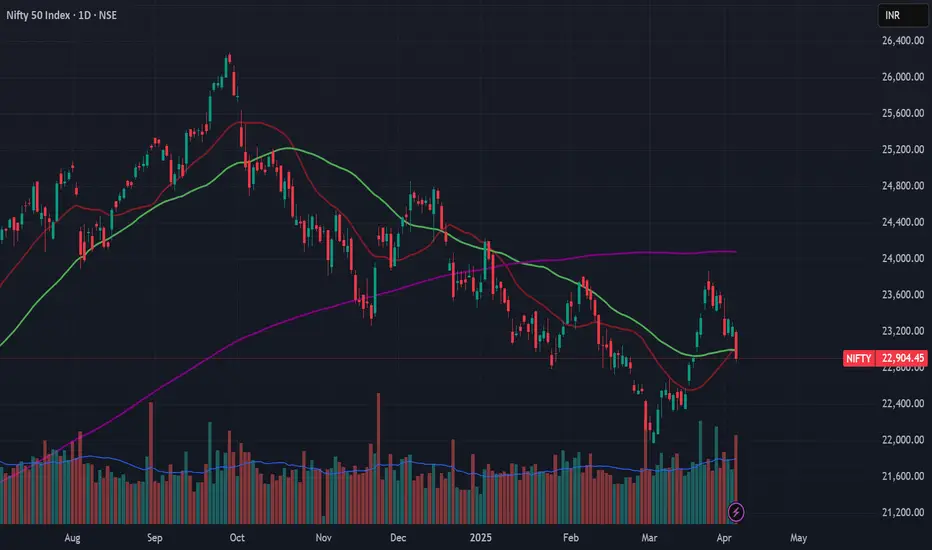
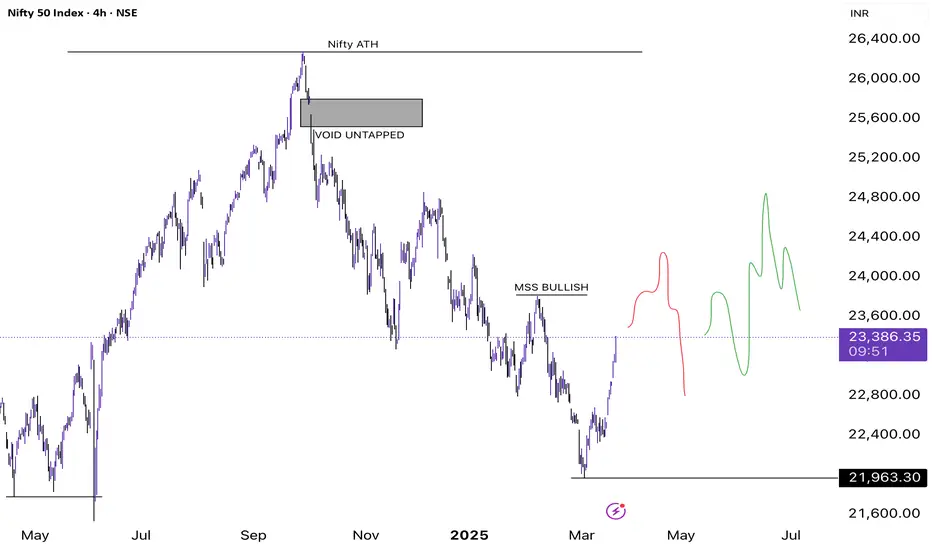
NIFTY 1D Technical Commentary on Market Maker Shifts- Nifty is currently trading at 23,395 up 6.5% from its recent high
- Nifty has still not flipped its structure so enjoying this rally doesn't look right
- Observation: Wait for a market structure shift above 23,828 and a weekly close above, this will help Nifty consume the sellers and make a bullish structure shift
- Two paths drawn signifies these 2 possibilities
- The red path shows we will deviate above the market structure shift trap many bids and long traders post that we will drop straight down
- The green path signifies we will reject straight from the Market Structure shift liquid zone and take out all the inefficiencies created and post that we might see an impulsive wave by trapping more shorts out.
- Everything depends on how the reaction is going to be
nifty 50 Today Analysisnifty 50 Today Analysis
Market created Regualr flat pattern which is showing a reversal because its a complete corrective pattern.
From here as our wave analysis is saying the next target level for Nifty 50 is 24500 to 24800

Nifty Down 16% from Highs: Eyes on Next Support at 21,800● Nifty 50 has declined by approximately 16% from its all-time high, signalling a significant correction in the market.
● The next crucial support level is anticipated around the 21,800 mark, a level where the index has historically found support on five previous occasions.
◉ OI Data Analysis
● The 22,500 strike price has the highest concentration of call writers, establishing it as a strong immediate resistance level.
● Conversely, the 22,000 strike price shows the highest accumulation of put writers, indicating robust support at this level.
◉ Valuation Analysis
● From a valuation standpoint, the Nifty appears attractive, currently trading at a Price-to-Earnings (PE) ratio of 19.7.
● This is notably below its 5-year average PE of 24.8, suggesting the index may be undervalued relative to its historical standards.

NIFTY fall & probability observation1) On Aug 5th, 2024 - Nifty's low (23,893.70).
2) On Nov 12th, 2024 - Nifty broke Aug 5th low and fell (-2.64%).
3) On Nov 21st, 2024 - Nifty's low (23,263.15).
4) On Jan 13th, 2025 - Nifty broke Nov 21st low and fell (-2.10%).
5) On Jan 27th, 2025 - Nifty's low (23,786.90).
As per the above observations of NIFTY chart data, Every time when nifty broke the previous low It fell an average of (-2%).
> The fall % difference between the (Aug 5th, 2024 to Nov 12th, 2024) is (-2.64%) - (-2.10) = 0.54%.
> Observing, Assuming and Applying this % difference data with the Jan 27th, 2025 low (23,786.90),
That is, (2.10% - 0.54%) = 1.56%
23,786.90 - 1.56% = 22,431.
-> FIB Retracement - Marking the Nifty's election day's (Jun 4th, 2024) low of 21,281.45 and Nifty's All Time High (Sep 27th, 2024) 26,277.35, The next level (0.786) of fib retracement comes around 22,350.
-> The above observation data collides with Fib Retracement.
Final Comment: If nifty breaks the level of (22,786.90), The next support would be 22,400 to 22,350. If it breaks further, Nifty may test the most major support of 21,800.

"Analyzing Nifty 50: Support, Resistance, and Trade Insights"Let's take a look at the Nifty 50 chart to analyze current support and resistance levels, and whether it's a good time to consider a bullish trade or if the market might drop further.
Currently, the Nifty 50 is showing a downtrend, forming lower highs and lower lows. This suggests that the market is struggling. However, there is a bottom trend line that supports the index quite well. Despite this, recent heavy selling by Foreign Institutional Investors (FIIs) means we haven’t seen a clear reversal pattern yet. Right now, the market is consolidating near this trend line.
For the Nifty to turn bullish, we would need to see a strong buying moment . We hope the index doesn’t fall below this trend line, but if it does, we could see a drop of several hundred points.
At this point, it might be wise to hold off on making any trades until we have clearer confirmation of market direction. For those considering a bullish position, a sensible stop-loss would be below 22,700 .
Please remember, this is for educational purposes only. Make sure to do your own analysis before making any trades and don't just follow someone else's advice blindly.

Nifty ready to move higher...Hello traders!
The market delivered exactly as we had expected for yesterday's trading. I've mentioned in the video idea what is to be expected for today's trading.
Not financial advice.
GLGT.

NIFTY analysis based on Elliott Wave theoryNIFTY is looking like in wave (Z).
Now, wave (Z) is always in 3 moves (ABC).
If we take a look in 75 min chart of NIFTY, we may see wave (a) of wave (Z) finished on 12 Feb. The price is in wave B of wave (b) now.
It looks like Zig-zag pattern is forming and it is observed most of the times that, Wave B of Zig-zag takes at least equal time of wave A.
So we may assume that, wave (b) of Zig-zag will finish at least by 19 Feb near 50% to 61.8% And then we may expect a fall to form wave (c) of Zig-zag.
This analysis is based on Elliott Wave theory and Fibonacci.
This analysis is for educational purpose only.

Nifty 50 | Head &Shoulders Pattern – A Breakdown Ahead?Hello everyone! I hope you all are doing great in life and in your trading . Today, I have brought an in-depth analysis of Nifty 50, focusing on a powerful Head & Shoulders pattern that is currently forming on the charts. This pattern is known for signaling a bearish reversal, which increases Supply in the market pushing prices downside. If this pattern plays out as expected, we could witness a strong Downside move in the coming sessions.
Currently nifty is trading at 23,340 levels Where previously buyers had shown interest pushing the market gap up following this pattern is selling pressure these buyers could Exit their position Pushing prices to 23,232 (Target 2) and 23,134 (Target 3).
Disclaimer:-This analysis is for educational purposes only. Please trade responsibly and consult a financial advisor before making any decisions.
If you found this analysis helpful, don’t forget to like, follow, and share your thoughts in the comments below! Your support keeps me motivated to share more insights. Let’s grow and learn together—happy trading!

Title: Nifty 50: Downtrend Persists, But a Reversal PossibleNifty 50 has dropped 12% from its all-time high, causing fear in the market. However, a Wolfe Wave pattern suggests a possible bounce. After peaking at 22,277 on September 27, 2024, Nifty has been falling, with a brief rise on November 21, 2024, before hitting a new low of 22,786 on January 27, 2025. The short-term correction seems over, and an upside move toward 24,900–25,000 is likely, though risks remain—stop-loss is essential.
Disclaimer: This is for information only, not financial advice. Do your research before investing.

Nifty 50 Index spot 23092.20 by the Daily Chart viewNifty 50 Index spot 23092.20 by the Daily Chart view
- Just sharing my personal point of view for things to unfold and look forward to for the coming week and then some more.

Deathcrossover is evident in next coming week trading sessionsDeathcrossover between SMA 50 and SMA 200 is inevitable in the next coming week. Caution to all traders

Nifty key levels for 09.01.2025Nifty key levels for 09.01.2025
If Nifty breaks the upper or lower range, we can expect momentum. The consolidation zone will be favorable for option sellers, while a breakout on either side will benefit option buyers.
Disclaimer:
These views are purely educational in nature. You are solely responsible for any decisions made based on this research.

Nifty Key Breakout Levels to Watch for Bullish or Bearish MoveHello guy's i hope you all will be doing good in your trading and your life as well today i have brought again Technical Analysis of Nifty 50:- Critical Levels to Watch.
The Nifty 50 index is currently consolidating in a well-defined pattern, with clear support and resistance levels in play. Here's the detailed analysis:
The price action is forming a descending channel, with a falling resistance line acting as the key barrier for upward movement. A breakout above this resistance can trigger bullish momentum, with targets at 23,966 (1st target) and 24,140 (2nd target).
On the downside, the support zone holds significant importance. A breach below this zone could open doors for further selling, with the next target at 23,464.
Key levels to monitor:
Stop Loss for Buying: 23,575
Stop Loss for Selling: 23,782
Here’s what happens:
Bullish Scenario: A breakout above the resistance will likely lead to a test of the mentioned targets, signaling a potential trend reversal.
Bearish Scenario: A breakdown below the support zone could signal bearish continuation, targeting the lower levels.
Outcome:
Watch for volume spikes during the breakout/breakdown to confirm the move.
Adhere to the stop-loss levels to manage risk effectively.
Disclaimer:- Please always do your own analysis or consult with your financial advisor before taking any kind of trades.
If you found this analysis insightful, don’t forget to hit like and follow for more such content!
For related trading ideas and educational posts, check out our profile TraderRahulPal Let’s learn and grow together!

Nifty 50: Tomorrow's Key Levels & Bullish Opportunities to Watch📈 Nifty 50 Analysis – Bulls Are Gaining Control!
The Nifty has made a strong comeback from a crucial support zone, and the signs are clear: the bulls are gearing up for action. With key levels now in place, there’s a great opportunity for traders to take advantage of the market’s potential momentum.
🔑 Key Levels to Focus On:
Support Zone: 23,370 – 23,460
This zone acted as a solid foundation for Nifty’s reversal. As long as it holds, buyers will likely maintain control.
A breakdown here could trigger a bearish wave.
Resistance Zone: 23,850 – 23,860
A critical barrier for Nifty to clear before it can continue its upward journey.
Buy Above: 23,716
If Nifty crosses and sustains this level, it signals a bullish breakout.
Targets:
🎯 1st Target: 23,860
🎯 2nd Target: 23,937
🎯 3rd Target: 24,064
Short Below: 23,545
If Nifty falls below this level, a bearish move could unfold.
Targets:
📉 1st Target: 23,460
📉 2nd Target: 23,285
📊 Market Indicators:
RSI (Relative Strength Index):
The RSI is rising steadily, reflecting growing bullish momentum.
Volume Surge:
The rebound from the support zone came with higher volumes, signaling confidence among buyers.
💡 Scenarios to Plan For:
🚀 Bullish Move:
If Nifty breaks 23,716, expect it to move toward 23,860 first. Once it clears this, the next logical steps are 23,937 and 24,064.
📉 Bearish Turn:
If Nifty drops below 23,545, a fall toward 23,460 is likely, and if selling pressure increases, it could extend to 23,285.
Pro Trader Tips:
Stick to the Plan: Always trade based on the levels and targets mentioned.
Set Stop-Loss: Manage your risk by placing stop-loss orders just below or above key levels.
Watch Volume: Ensure any breakout or breakdown is supported by strong volume to confirm the move.
🔔 Final Takeaway:
The current market setup is exciting, with a clear bullish potential. Keep an eye on 23,716 for confirmation of the upward move. At the same time, stay cautious around 23,545, as a break below this level could flip the sentiment. With three clear targets on the upside, this is your chance to trade with confidence and make the most of the market.
📜 Disclaimer:
This analysis is for educational purposes only and not financial advice. Please trade responsibly and manage risks effectively.
💬 Let’s Connect!
👍 Like this post if it helped you.
💬 Comment your thoughts or questions—I’d love to hear from you.
🔔 Follow for daily updates and insights.
📢 Check my profile for more educational content and trading ideas.
@TraderRahulPal 🚀

Nifty to Kick-Start the Year with a Pause!● A detailed examination of the daily chart reveals the emergence of an Inverted Cup and Handle pattern, suggesting a bearish outlook.
● However, the index is currently hovering above the critical support level of 23,500, while attempting to establish a foothold above the 200-period EMA, a key dynamic support.
● Furthermore, options data indicates a significant concentration of put writers at the 23,500 strike price, lending additional credence to the support zone.
● Given these technical and sentimental factors, we expect the index to remain in a consolidative phase over the next month, as market participants await a clear catalyst for direction.

NIFTY50 Head & Shoulder Pattern in Weekly Charts₹₹Nifty50 making Head & Shoulder in Weekly Charts with Price range of 3000 points(23266-26277). If Chart Pattern play-out perfectly then Target price range will be 2500-3000 points till 20288 levels.
Nifty50 also have a gap on 20288 levels bcoz of Election Results of 4 States on Dec 3,2023 after that rally started. Now Nifty50 can fill this gap if Chart Pattern play-out perfectly.
I will wait for Nifty50 to break down 23266-22777 levels zone & closing below 22777 levels. If Nifty50 close below 22777 levels then Short Nifty50 for Targets of 22122, 21777, 21288, 20777 & 20288 with Stop Loss of 23444.
But this Pattern will fail above levels of 24555.
Most Important we have to carefully watch RELIANCE bcoz it's already at 52 week lows & At Parallel Channel Support in Monthly Charts. If Reliance also give breakdown of channel then it will be easy for Nifty50 to reach all targets. Similarly HDFC BANK at upper Resistance of Parallel Channel in Monthly Charts.
