Nifty50 analysis(28/1/2026).CPR: overlapping + descending cpr: consolidation day.
FII: -3,068.49 Sold
DII: 8,999.71 bought.
Highest OI: too soon to tell
Resistance:25500.
Support : 24900.
conclusion:
My pov:
1.yesterday clearly DII support with 9000cr. today a positive almost 300 point gap. this gap will not sustain.
2.price will drift towards yesterdays high or today cpr only then price goes upward.
3.wait for the price come to your range so you can buy at bottom.
What IF:
1.if price breaks 24900 and closed in day candle then overall trend continues.
2.if the gap sustained from openning then 25600 will be the resistance .
psychology fact:
A setbacks as the result of minor, controllable, situations that have nothing to do with them personally.
note:
8moving average ling is blue colour.
20moving average line is green colour
50moving average line is red colour.
200moving average line is black colour.
cpr is for trend analysis.
MA line is for support and resistance.
Disclaimer:
Iam not Sebi registered so i started this as a hobby, please do your own analysis, any profit/loss you gained is not my concern. I can be wrong please do not take it seriously thank you.
Nifty50index

Nifty50 analysis(3/12/2025).
CPR: Narrow + decending cpr: trending day.
FII: -3,642.30 Sold
DII: 4,645.94 bought.
Highest OI:too soon to tell.
Resistance: nil
Support :nil
conclusion:
My pov:
1.Today market can be trending mostly bearish side .
2.techinical support at 25950, if it breaks and sustain in day candle then bearish trend can be expected.then support only at 25500.
3.any resistance in cpr can be a confirmed. then trade
psychology fact:
Maybe Trading can’t be done, but I’m going to do whatever I can to see if I’m one of the few who can do it.
note:
8moving average ling is blue colour.
20moving average line is green colour
50moving average line is red colour.
200moving average line is black colour.
cpr is for trend analysis.
MA line is for support and resistance.
Disclaimer:
Iam not Sebi registered so i started this as a hobby, please do your own analysis, any profit/loss you gained is not my concern. I can be wrong please do not take it seriously thank you.

Nifty50 Today(1/12/2025) analysis
CPR: Narrow + outside cpr: Sideways to bearish.
FII: -3,795.72 Sold
DII: 4,148.48 bought.
Highest OI:
Resistance:26300,26400.
Support :26000.
conclusion:
My pov:
1.Market opens with gap up but cpr shows a bearish view in techinical analysis ,there is two ways to confirm it if breakes ATH and sustains in 1hr candle and if it breaks and sustain above R1,also check volume . then go bullish.
2.market can be sideways to bearish.
3.confirmation is the key and wait for clarity.
psychology fact : most of the time, not doing anything is the best trading exercise you can ever do.
note:
8moving average ling is blue colour.
20moving average line is green colour
50moving average line is red colour.
200moving average line is black colour.
cpr is for trend analysis.
MA line is for support and resistance.
Disclaimer:
Iam not Sebi registered so i started this as a hobby, please do your own analysis, any profit/loss you gained is not my concern. I can be wrong please do not take it seriously thank you.

NIFTY 50 Nifty could test below white line or 24920 most probably within 27th Nov
if it moves sideways to bearish then it could reach within 8th Dec
Disclaimer:
It's a personal view not a financial advice and I assume no responsibility and liability whatever outcome arises.

Today(18/11/2025),nifty50 analysis(expiry).
CPR: Narrow + ascending cpr: trending
FII: 442.17 bought
DII: 1465.86 bought.
Highest OI:
Resistance: 26000, 26100,26200.
Support :25900, 25800,25700
conclusion:
My pov:
1.Today if market breaks recent high 26100 can be bullish, if not it will take a clear support and then go bullish, also today expiry so buyers should be careful.
2.Fii and Dii both buying.
3.Narrow cpr, expiry day can this day be trending but recent ath is near. lets wait and watch.
psychology fact : trading is 95% waiting and 5% execution.
note:
8moving average ling is blue colour.
20moving average line is green colour
50moving average line is red colour.
200moving average line is black colour.
cpr is for trend analysis.
MA line is for support and resistance.
Disclaimer:
Iam not Sebi registered so i started this as a hobby, please do your own analysis, any profit/loss you gained is not my concern. I can be wrong please do not take it seriously thank you.

Today(17/11/2025),nifty50 analysis.
CPR: slightly wide + overlapping lower cpr: sideways to bearish.
FII: -4,968.22 sold.
DII: 8,461.47 bought.
Highest OI:
Resistance: 26000, 26100
Support : 25800,25700
conclusion:
My pov: market is neutral to bearish, If and only 26100 is closed and crossed i view as bullish trend lets wait and watch. why because FII keep selling, That the reason i cant clearly think market is in bullish,
psychology fact : Trading is a profession where you have to think freely and creatively.
note:
8moving average ling is blue colour.
20moving average line is green colour
50moving average line is red colour.
200moving average line is black colour.
cpr is for trend analysis.
MA line is for support and resistance.
Disclaimer:
Iam not Sebi registered so i started this as a hobby, please do your own analysis, any profit/loss you gained is not my concern. I can be wrong please do not take it seriously thank you.

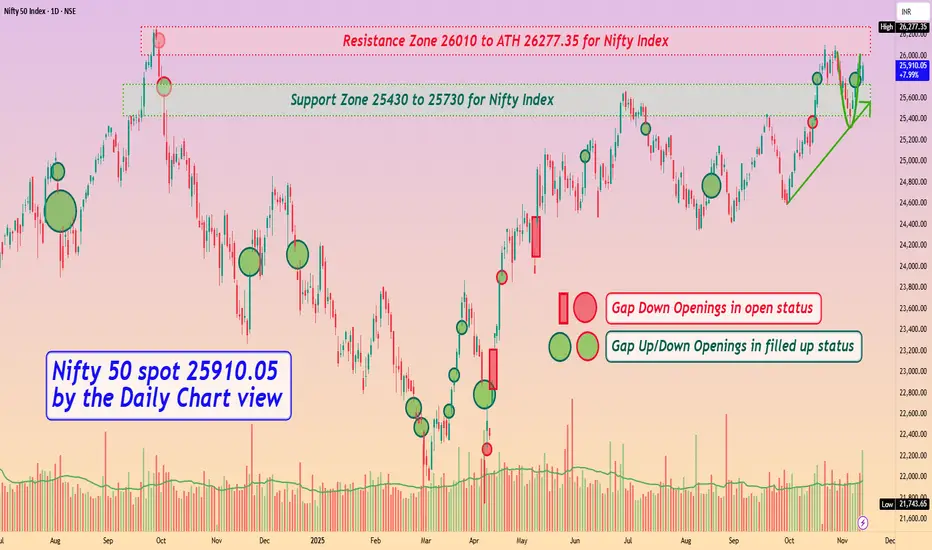
Nifty 50 spot 25910.05 by Daily Chart view - Weekly UpdateNifty 50 spot 25910.05 by Daily Chart view - Weekly Update
- Support Zone 25430 to 25730 for Nifty Index
- Resistance Zone 26010 to ATH 26277.35 for Nifty Index
- Rising Support Trendline seems respected by weekly positive closure
- Rounding Bottom Bullish momentum by Resistance Zone neckline seems sustained
- Nifty timidly shy from creating a New Lifetime High by crossing ATH final hurdle remains effectively elusive
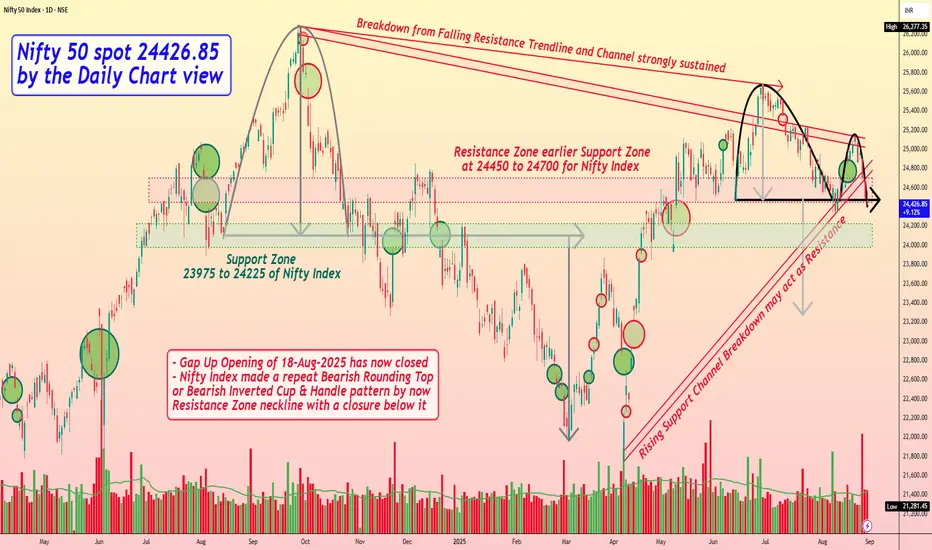
Nifty 50 spot 24426.85 by the Daily Chart view - Weekly updateNifty 50 spot 24426.85 by the Daily Chart view - Weekly update
- Support Zone 23975 to 24225 of Nifty Index
- Gap Up Opening of 18-Aug-2025 has now closed
- Resistance Zone earlier Support Zone at 24450 to 24700 for Nifty Index
- Rising Support Channel Breakdown may act as Resistance for upside move
- Breakdown from Falling Resistance Trendline and Channel has strongly sustained
- Nifty Index made a repeat Bearish Rounding Top or Bearish Inverted Cup & Handle pattern by now Resistance Zone neckline with a closure below it
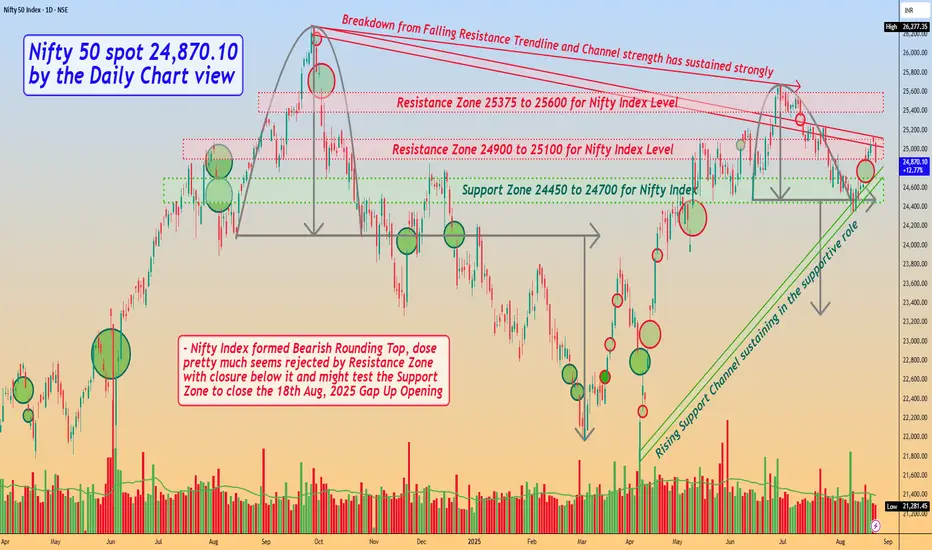
Nifty 50 spot 24,870.10 by the Daily Chart view - Weekly updateNifty 50 spot 24,870.10 by the Daily Chart view - Weekly update
- Support Zone 24450 to 24700 for Nifty Index
- Rising Support Channel sustaining in the supportive role
- Resistance Zone seen at 24900 to 25100 for Nifty Index Level
- Next Resistance Zone seen at 25375 to 25600 for Nifty Index Level
- Nifty Index formed Bearish Rounding Top, dose pretty much seems rejected by Resistance Zone with closure below it
- Basis Gap Up Opening done on 18th August, 2025, Nifty Index might just test Support Zone for closing Gap Up vacuum area
- Rest, let us HOPE FOR THE BEST TO HAPPEN, for the known fact that MARKETS ACT SUPREME ALL THE TIME, no matter what we propagate
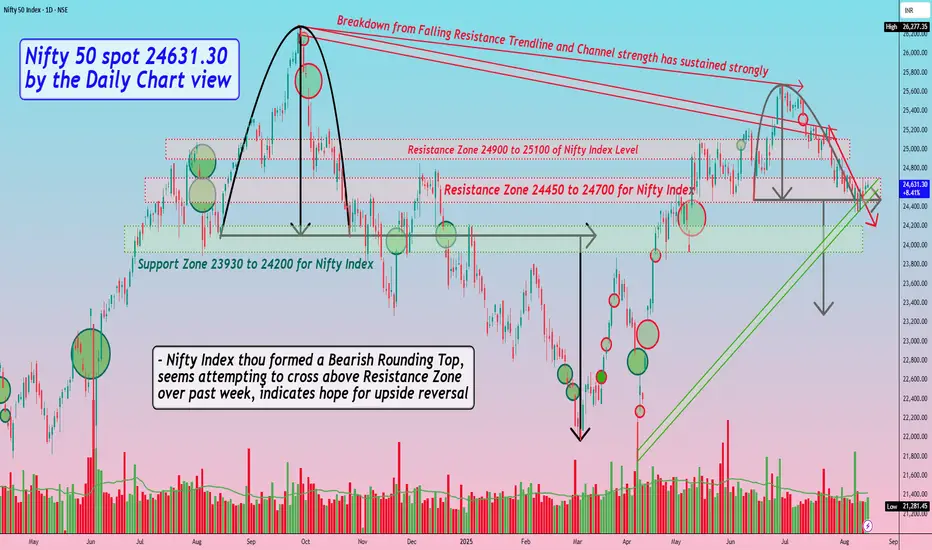
Nifty 50 spot 24631.30 by Daily Chart view - Weekly updateNifty 50 spot 24631.30 by Daily Chart view - Weekly update
- Support Zone 23930 to 24200 for Nifty Index
- Resistance Zone 24450 to 24700 for Nifty Index
- Breakout from above one of the Tiny Falling Resistance Trendline seems well sustained
- Rising Support Channel seems back in supportive role and maintained by current status of Nifty Chart setup
- Nifty Index thou formed a Bearish Rounding Top, seems attempting to cross above Resistance Zone over past week, indicates hope for upside reversal
Nifty 50 spot 24,363.30 by the Daily Chart view - Weekly updateNifty 50 spot 24,363.30 by the Daily Chart view - Weekly update
- Support Zone 23850 to 24100 for Nifty Index
- Resistance Zone 24450 to 24700 for Nifty Index earlier Support Zone
- Bearish Rounding pattern top for Nifty 50 Index from ATH 26277.35 to 24073.90 diff 2,203 points
- Nifty 50 Index took reversal from 21964.60 just tad above from expected low of 21870 by 2203 points
- Bearish Rounding Top has repeated from the recent high of 25669.35 to 24473 having a difference of 1196 points
- *Will the same downfall behavior happen and see history repeated for Nifty 50 Index going down till 23276 and then reverse upside*
- *Stock Markets Domestically and Globally, are bearing the brunt of adversely affecting and negatively playing Tariff Tantrum Trumpet*

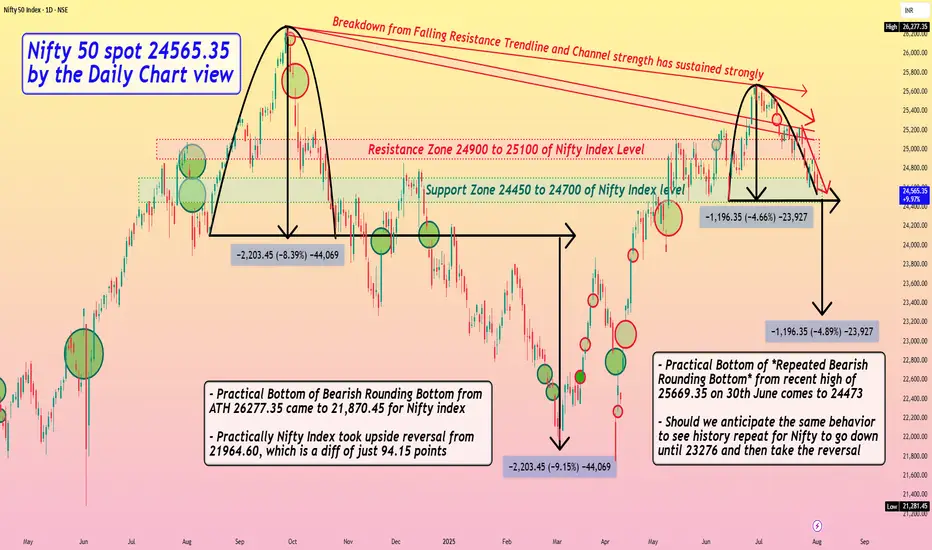
Nifty 50 spot 24565.35 by the Daily Chart view - Weekly update*Nifty 50 spot 24565.35 by the Daily Chart view - Weekly update*
- Resistance Zone 24900 to 25100 of Nifty Index Level
- Support Zone 24450 to 24700 of Nifty Index level still seen sustained
- Bearish Rounding Bottom after ATH level seen repeated at current week closure
- Practical Bottom of *Bearish Rounding Bottom* from ATH 26277.35 came to 21,870.45 for Nifty index
- Practically Nifty 50 Index later took an upside reversal from 21964.60, which is a diff of just 94.15 points
- Practical Bottom of *Repeated Bearish Rounding Bottom* from recent high of 25669.35 on 30th June comes to 24473
- Should we anticipate the same behavior to see history repeat for Nifty to go down until 23276 and then take the reversal
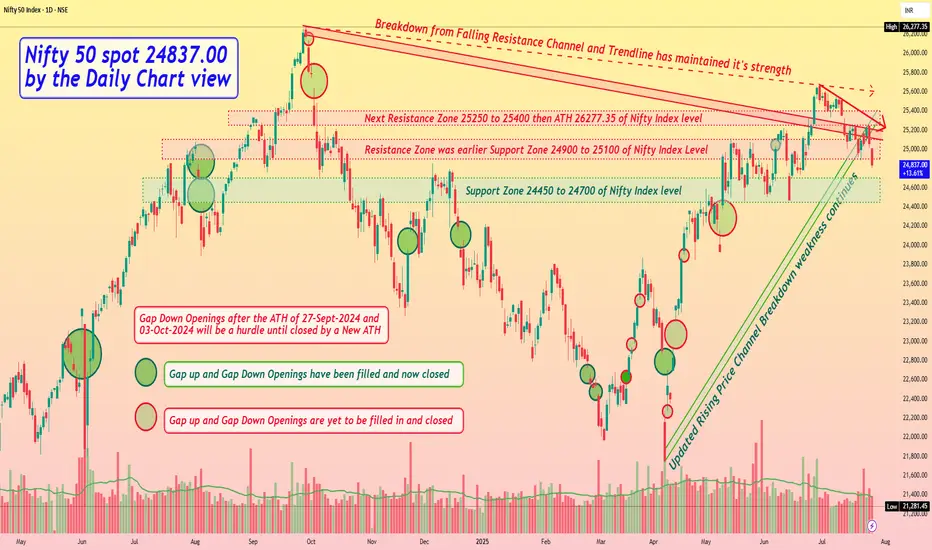
Nifty 50 spot 24837.00 by the Daily Chart view - Weekly updateNifty 50 spot 24837.00 by the Daily Chart view - Weekly update
- Support Zone 24450 to 24700 of Nifty Index level
- Updated Rising Price Channel Breakdown weakness continues
- Resistance Zone was earlier Support Zone 24900 to 25100 of Nifty Index Level
- Next Resistance Zone seen at 25250 to 25400 then ATH 26277.35 of Nifty Index level
- Breakdown from the Falling Resistance Channel and Trendline has maintained it's strength
- *Multiple reasons attribute for weakness and breakdown and that is how Markets show their Supremacy*
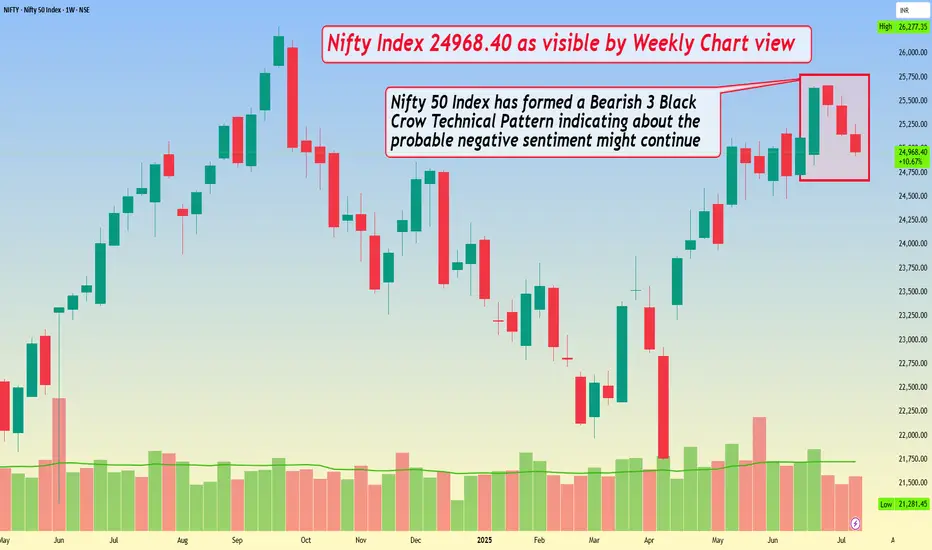
Nifty Index 24968.40 as visible by Weekly Chart viewNifty Index 24968.40 as visible by Weekly Chart view
- Nifty 50 Index has formed a Bearish 3 Black Crow Technical Pattern indicating about the probable negative sentiment might continue
- Nifty is also closely forming a sliding Bearish Double Top from ATH 26277.35 to current top 25669.35, which again syncs with the negative sentiment trend trajectory
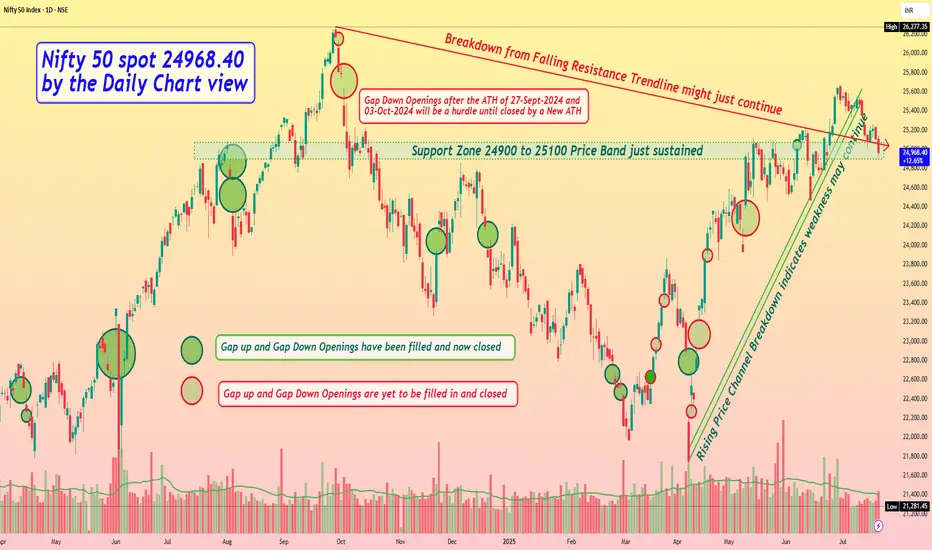
Nifty 50 spot 24968.40 by the Daily Chart view - Weekly updateNifty 50 spot 24968.40 by the Daily Chart view - Weekly update
- Support Zone 24900 to 25100 Price Band just sustained
- Next Support Zone seen at 24325 to 24500 of the Nifty Index
- Breakdown from Falling Resistance Trendline might just continue
- Rising Price Channel Breakdown indicates weakness might continue
- Resistance Zone 25250 to 25400 then ATH 26277.35 of Nifty Index levels
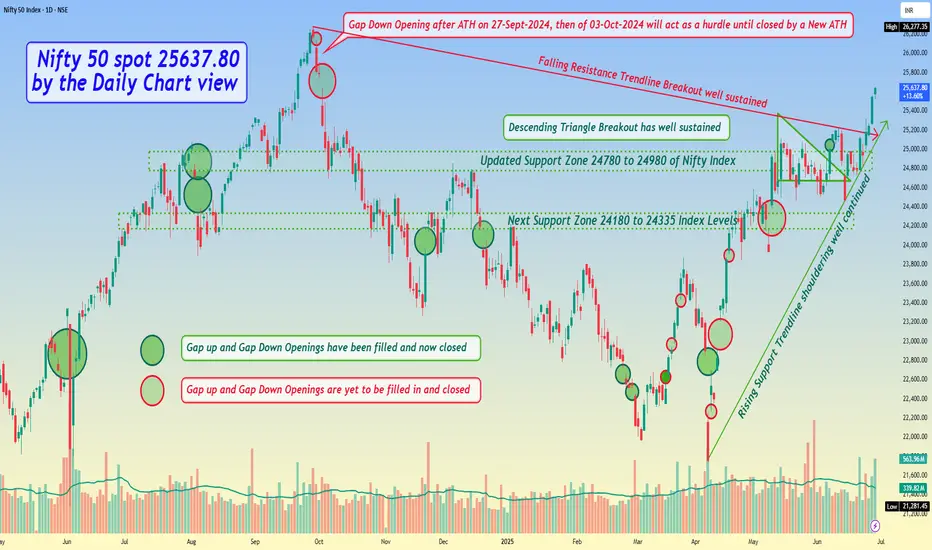
Nifty 50 spot 25637.80 by the Daily Chart view - Weekly update*Nifty 50 spot 25637.80 by the Daily Chart view - Weekly update*
- Descending Triangle Breakout has well sustained
- Immediate Support Zone 25125 to 25335 of Nifty Index
- Next updated Support Zone 24780 to 24980 of Nifty Index
- And then next Support Zone 24180 to 24335 of Nifty Index Levels
- Resistance Zone seen at 25860 to 26035 and then ATH 26277.35 of Nifty 50 Index levels
- Rising Support Trendline shouldering well continued and Falling Resistance Trendline Breakout well sustained
- *Gap Down Opening after ATH on 27-Sept-2024, then of 03-Oct-2024 will act as a hurdle until closed by a New ATH*
Nifty Weekly Outlook: Volatility Ahead Amid Global Tensions● Despite briefly breaking above the 25,100 resistance last week, Nifty failed to sustain the momentum and witnessed a corrective pullback towards the 24,500 level.
● Market volatility ticked up, with India VIX rising by 3.08% to 15.08 on a weekly basis, reflecting growing investor nervousness.
● Geopolitical tensions—particularly the escalating conflict between Israel and Iran—are weighing on global sentiment, and Indian equities are not immune to this uncertainty. However, relative strength in the Indian markets suggests that they may continue to outperform global peers in the near term.
● For the upcoming week, Nifty is expected to remain highly volatile, with wide-range oscillations likely. A directional trend may only emerge if Nifty decisively breaches 25,100 on the upside or breaks below the key support at 24,500.
● Options data indicates that the 25,000 level will act as a strong resistance, while 24,500 remains a crucial support zone.
● Importantly, if the index opens below 24,400 at the start of the week, it could invite further selling pressure, tipping the balance in favor of the bears.
● Given the global headwinds and sensitive technical setup, traders are advised to stay cautious as heightened volatility could dominate the week ahead.
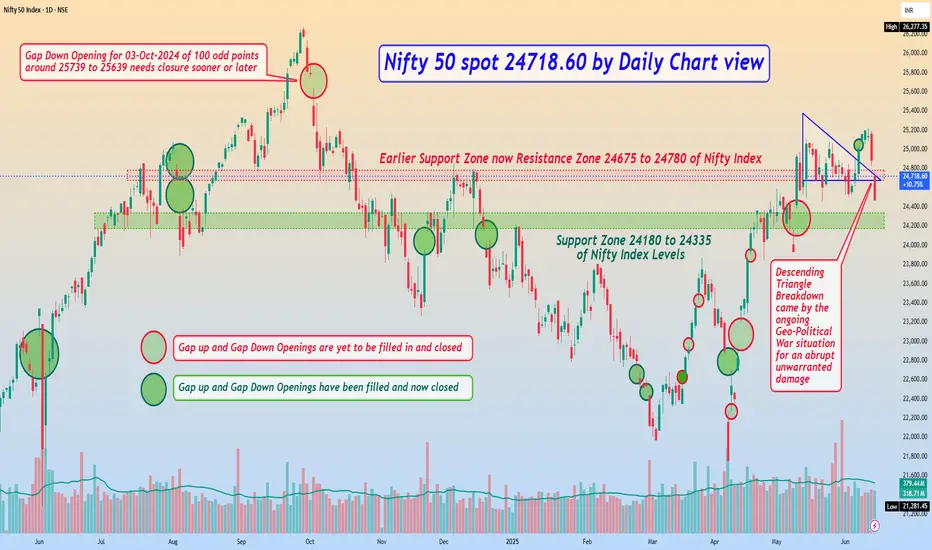
Nifty 50 spot 24718.60 by Daily Chart view - Weekly UpdateNifty 50 spot 24718.60 by Daily Chart view - Weekly Update
- Support Zone 24180 to 24335 of Nifty Index Levels
- Earlier Support Zone now Resistance Zone 24675 to 24780 of Nifty Index
- Descending Triangle Breakdown came by the ongoing Geo-Political War situation for an abrupt unwarranted damage
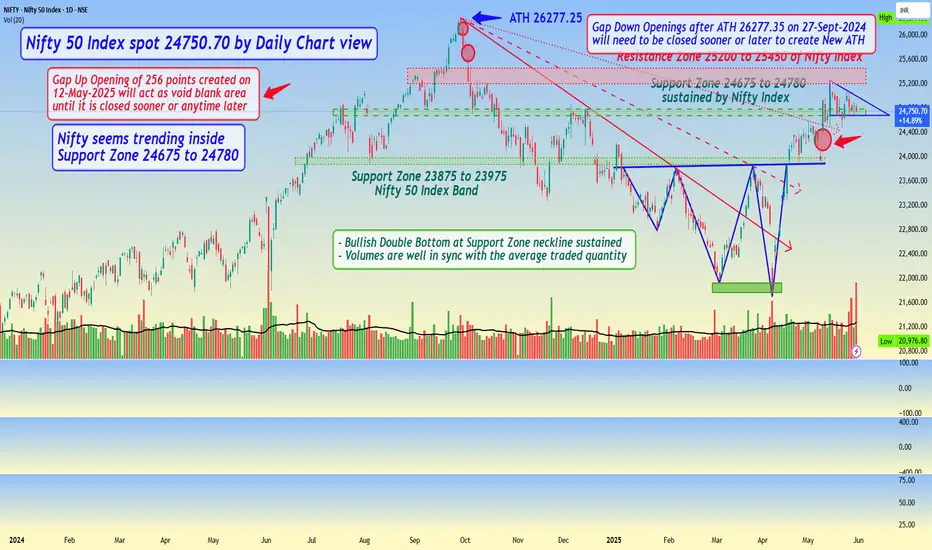
Nifty 50 Index spot 24750.70 by Daily Chart view - Weekly UpdateNifty 50 Index spot 24750.70 by Daily Chart view - Weekly Update
- Resistance Zone 25200 to 25450 of Nifty Index
- Support Zone 24675 to 24780 sustained by Nifty Index
- Nifty seems stuck within Descending Triangle pattern above Support Zone, needs to breakout from it for fresh upside
- Gap Up Opening of 256 points created on 12-May-2025 will act as void blank area until it is closed sooner or anytime later
- Gap Down Openings made after the ATH 26277.35 on 27-Sept-2024 will need to be closed sooner or later to create New ATH
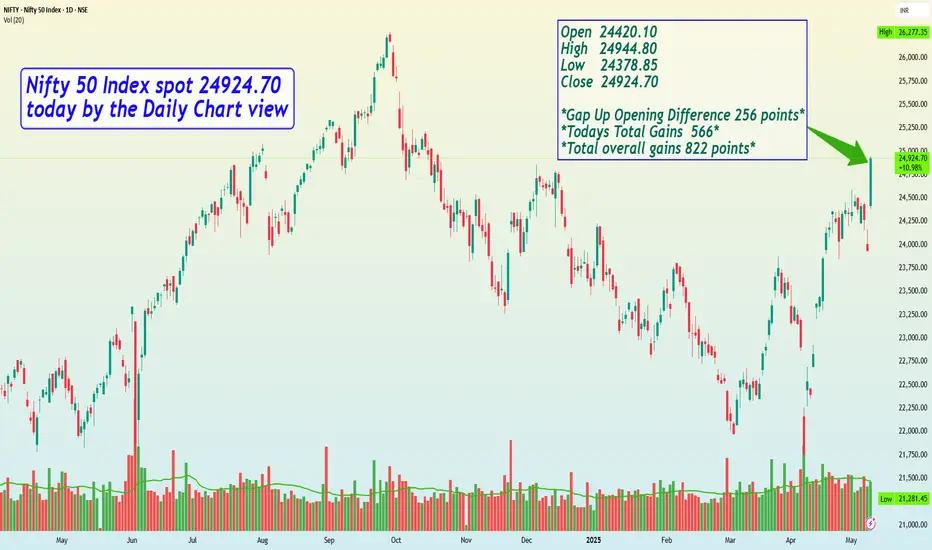
Nifty 50 Index spot 24924.70 today by the Daily Chart viewNifty 50 Index spot 24924.70 today by the Daily Chart view
Open 24420.10
High 24944.80
Low 24378.85
Close 24924.70
Gap Up Opening Difference 256 points
Todays Total Gains 565.95
Overall Total Points Gained 822 points 😃🙌🏼🤩🤝🏼😍👍🏼
* The Gap Up Opening today of 256 points will need to be closed sooner or later on for it might act as a vacuum created space to be filled in.
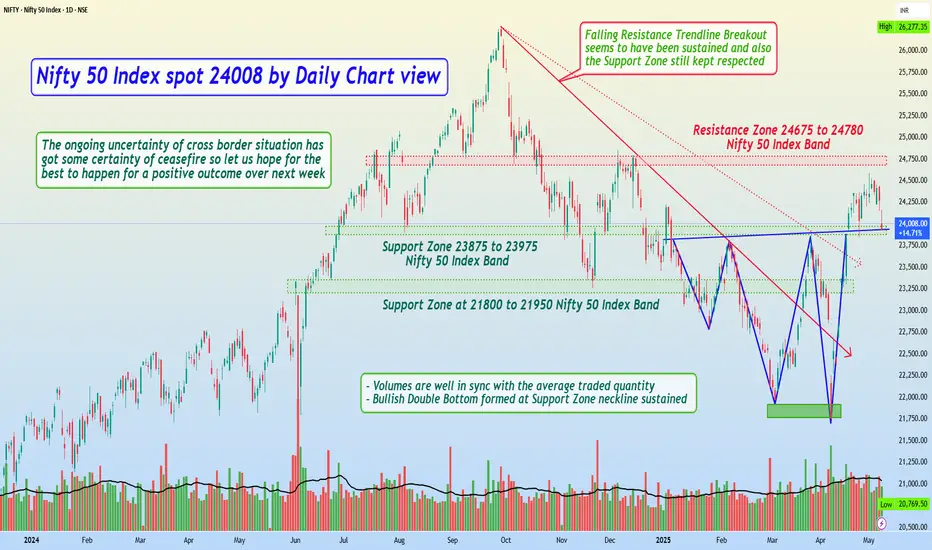
Nifty 50 Index spot 24008 by Daily Chart viewNifty 50 Index spot 24008 by Daily Chart view
- Resistance Zone 24675 to 24780 Nifty 50 Index Band
- Nifty is at Support Zone 23875 to 23975 Nifty 50 Index Band
- *Nifty having sustained above the Support Zone is bound to a bounce back by the cross border mellowed down situation*
- *The ongoing uncertainty of cross border situation has got some certainty of ceasefire so let us hope for the best to happen for a positive outcome over next week*
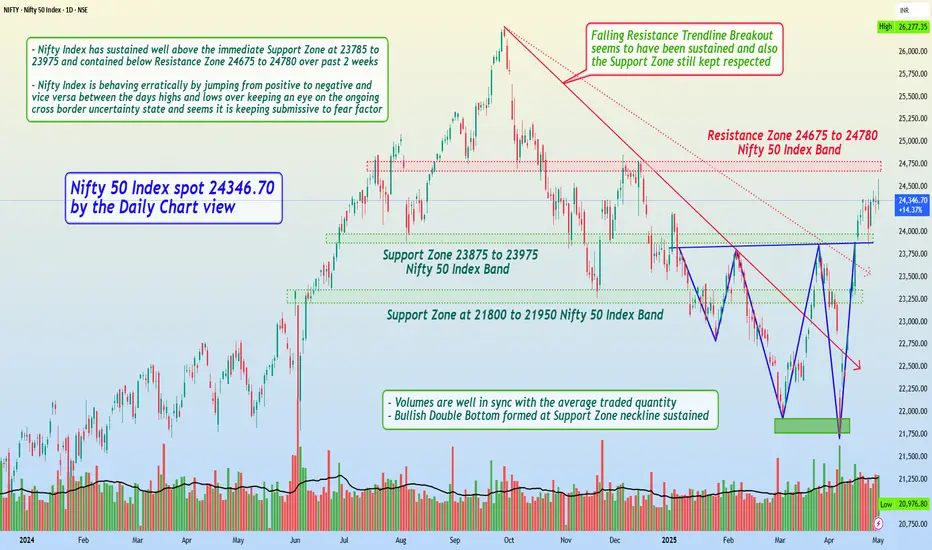
Nifty 50 Index spot 24346.70 by Daily Chart view - Weekly UpdateNifty 50 Index spot 24346.70 by the Daily Chart view
- Support Zone 23875 to 23975 Nifty 50 Index Band
- Resistance Zone 24675 to 24780 Nifty 50 Index Band
- Volumes are well in sync with the average traded quantity
- Nifty Index has sustained well above the immediate Support Zone at 23785 to 23975 and contained below Resistance Zone 24675 to 24780 over past 2 weeks
- Nifty Index is behaving erratically by jumping from positive to negative and vice versa between the days highs and lows over keeping an eye on the ongoing cross border uncertainty state and seems it is keeping submissive to fear factor
- Let us hope for the best to happen for a positive outcome over the coming days/weeks and foresee Nifty 50 Index to gradually and steadily progress towards the current ATH 26277.35 for a New ATH, in line with the Bank Nifty Index strides
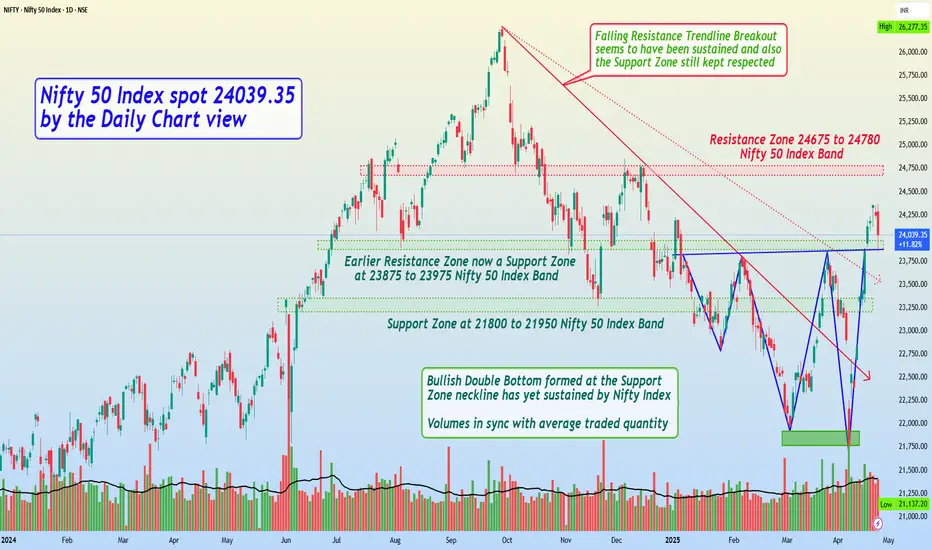
Nifty 50 Index spot 24039.35 by Daily Chart view - Weekly UpdateNifty 50 Index spot 24039.35 by the Daily Chart view - Weekly Update
- Resistance Zone 24675 to 24780 Nifty 50 Index Band
- Volumes are in good sync with the average traded quantity
- Both the Falling Resistance Trendlines have been decently maintained todate
- Earlier Resistance Zone now a Support Zone at 23875 to 23975 Nifty 50 Index Band
- Bullish Double Bottom formed at the Support Zone neckline has yet sustained by Nifty Index