Nifty 50 Price Structure Analysis [01/01/2026: Thursday]Top-Down Nifty 50 Price Structure Analysis for 01st of January 2026. The day is Thursday.
(1) Monthly Time Frame:
The candle is a red paper umbrella plus an inside candle. The lower wick of the candle is longer as compared to the red body. It means the bears tried to push down the price, but the bulls are defending hard for their existence. Major resistance is 26200. Major support is 26000. The view is indecision.
(2) Weekly Time Frame:
This week's candle is kind of a green dragonfly doji with a body of a green spinning top. Candle structures are imperfect but sufficient enough to offer psychological insights. Most importantly, this week's candle engulfed last week's bearish gravestone doji formation. For the past 4 weeks, the price has been within the range (26200 - 25900). Bears are badly trapped at the level 25900. Price gave a close above the level 26100 (which was previously a major resistance). Major resistance is 26200 while major support is 26000. Since it is the season of consecutive dojis (indecision candles) in Nifty 50, we still cannot build conviction of the trend. It is a sideways market for 10 weeks. However, this week's lower wick is long, showing signs of bullish emergence. The view is indecision to bullish.
(3) Daily Time Frame:
The daily candle is an imperfect bullish marubozu. There is no lower wick, but there is an upper wick that formed due to sharp selling below the level 26200. However, the green candle structure engulfed the previous 3 red days. Very strong support is now at level 26000. Level 26100 is presently a weak support, but as the price spends more time above level 26100, it will become a strong support. The view is indecision to bullish.
(4) 30-Minute Time Frame:
Price has been in a zig-zag price structure since mid-November. For bullish sustenance, it is necessary for the price to trade above the level 26200 for a longer time with a promise of breaking out the previous all-time high (ATH: 26277.35). Major resistance is 26200. Weak support is 26100. Major support is 26000. In the present market condition, every downward move should be doubted. The view is bullish.
Bullish Scenario Set-Up:
(i) Price sustains above the opening price.
(ii) Price stays above the level 26100 for a long time.
(iii) Price shows promise of breaking out above the level 26200.
Bearish Scenario Set-Up:
(i) Price sustains below the opening price.
(ii) Price starts to trade below the level 26050, with a sign of breaking down the level 26000.
No Trading Zone (NTZ): (26100 - 26050)
Events: SENSEX weekly expiry. No other high-impact event.
Summary of the Trading Plan (Hypothesis and Insights):
(i) The monthly TF bias is indecision.
(ii) The weekly TF bias is indecision to bullish.
(iii) The daily TF bias is indecision to bullish.
(iv) The 30-minute TF bias is bullish.
(v) Establish intraday bias with respect to the opening price.
(vi) Weekly SENSEX expiry. No other high-impact event. Expecting a choppy market in the first half. Price will probably remain below the level of 26200 in the first half.
(vii) Major resistance is 26200.
(viii) Weak support is 26100.
(ix) Major support is 26000.
(x) No Trading Zone (NTZ): (26100 - 26050).
(xi) Execute bullish trade when price sustains above 26100 for a long time with a promise of breaking out level 26200.
(xii) Execute bearish trade when price starts to trade below level 26050 with a promise of breaking down level 26000.
(xiii) Take trades only if either a bullish/bearish scenario appears. Otherwise, do not trade. Remember, not trading is an extension of trading activity. Be responsible.
NOTE:
"Mark your points. Trade your points. Price is God. Anything can happen in the markets. Therefore, trade what you see, not what you believe."
Happy Trading!
Nifty50levels

Nifty 50 Price Structure Analysis [31/12/2025: Wednesday]Top-Down Nifty 50 Price Structure Analysis for 31st of December 2025. The day is Wednesday.
(1) Monthly Time Frame:
Inside candle plus a red paper umbrella. Major resistance 26100. No bullish confidence till the price starts to trade above the level 26100. Weak support 25900. Major support 25800. The view is indecision.
(2) Weekly Time Frame:
The weekly candle is kind of a red spinning top. Bulls are trapped at 26100, and bears are trapped at 25900. Take no confident bullish trade unless the price sustains above the level 26100. Take no confident bearish trade unless the price sustains below the level 25900. The view is indecision to bearish.
(3) Daily Time Frame:
Consecutive five days red. Today's candle is a perfect long-legged doji. It means the day was indecisive. Maybe it is a pause in the downfall. If the price sustains above the level of 26000, then maybe there will be an upmove. Strong resistance zone is (26100 - 26050). Thus, any up move till 26100 will be led by underconfident bulls. Weak support is at the level 25900. If level 25900 is decisively broken. Then a fall till 25800 is highly probable. The view is indecision to bearish.
(4) 30-Minute Time Frame:
The lower lows and lower highs structure is still intact. The bearish phase is still intact. However, there is a strong buy zone at level 25900. Thus, plan no short trade till price sustains below level 25900. Also, there is an unfilled gap below the level 25900. On the contrary, the up move should be doubted. There are strong resistances at levels 26100 and 26050. Underconfident and sharp bullish trades can be executed above levels 26000 and 26050. Confident bullish trades can be executed only above the level 26100. The view is indecision to bearish.
Bullish Scenario Set-Up:
(i) Price sustains above the opening price.
(ii) Price sustains above the level 26000 along with
(iii) Underconfident and sharp bullish trades can be executed above levels 26000 and 26050.
(iv) Confident bullish trades can be executed only above the level 26100.
(v) Bullish trades will be tough.
Bearish Scenario Set-Up:
(i) Price sustains below the opening price.
(ii) Price decisively starts to trade below the level 25900.
(iii) Price shows a high probability of filling up the unfilled gap below level 25900.
(iv) If level 25900 is broken decisively, then there is a higher probability of price reaching level 25800.
No Trading Zone (NTZ): (26000 - 25900)
Events: No expiry. But FOMC minutes, a high-impact event, are there. So, trade with caution.
Summary of the Trading Plan (Hypothesis and Insight):
(i) Monthly TF bias is indecision.
(ii) Weekly TF bias is indecision to bearish.
(iii) Daily TF bias is indecision to bearish.
(iv) 30-Minute TF bias is indecision to bearish.
(v) Establish intraday bias with respect to the opening price.
(vi) No Trading Zone (NTZ): (26000 - 26900)
(vii) An unfilled gap is below the level 25900.
(viii) Take a confident bearish trade once the price starts to sustain below the level 25900 with a target of level 25800.
(ix) Take underconfident and sharp bullish trades above the levels 26000 and 26050. These trades should be short-lived. Capture points fast and exit trades.
(x) Take a confident bullish trade only when the price starts to trade above the level 26100.
(xi) Be cautious as there is a high-impact event - FOMC Minutes.
(xii) Take trades only if either a bullish/bearish scenario appears. Otherwise, do not trade. Remember, not trading is an extension of the trading activity.
NOTE:
"Mark your points. Trade your points. Price is God. Anything can happen in the markets. Therefore, trade what you see, not what you believe."
Happy Trading!

Nifty 50 Price Structure Analysis [29/12/2025: Monday]Top-Down Nifty 50 Price Structure Analysis for 29th of December 2025. The day is Monday.
(1) Monthly Time Frame:
The candle is a red paper umbrella or a hanging man. Also, the candle is inside the previous month's candle. The long-term trend is bullish, but the short-term trend is indecisive. Major resistance is 26200. Minor support is 26000. Major support is 25800. The view is indecision.
(2) Weekly Time Frame:
Nifty has successfully wasted 10 weeks in the same range (25700 - 26300). A 600-point range-bound consolidation is painful for directional traders. It is a good market for non-directional traders. Presently, the candle is a red gravestone doji. There is huge selling pressure in the zone of 26200. Major resistance is 26150. Take no bullish trades until price forms a higher highs and higher lows structure above the level 26150. Every up move should be doubted. Level 26000 is a weak support. Price sustaining below the level 26000 can pull the price down to the level 25900. The view is indecision to bearish.
(3) Daily Time Frame:
Structurally, the bulls are tired. In the daily time frame, the price is forming a complex triple top or head and shoulder (H&S) pattern. The price got multiple rejections from the levels - 26200, 26150, and 26100. Every up move should be doubted. Do not think of taking bullish trades unless the price forms a higher highs and higher lows structure above the level 26150. Weak support is 26000. If level 26000 is decisively broken, then there is a higher chance of the price reaching down to level 25900. Additionally, if level 25900 is decisively broken, then level 25800 would be a high probability target. The view is bearish.
(4) 30-Minute Time Frame:
There is a clear sign of weakness. The major resistance zone is (26150 - 26100). Weak support is 26000. Major support is at level 25900. There are multiple unfilled gaps below the level 26000. Take no bullish trades unless the price decisively starts to trade above level 26150. Initiate bearish trade the moment level 26000 is broken. The view is bearish.
Bullish Scenario Set-Up:
(i) Price sustains above the opening price.
(ii) Price starts to decisively sustain above the level 26150.
Bearish Scenario Set-Up:
(i) Price sustains below the opening price.
(ii) Price starts to decisively sustain below the level 26000.
(iii) If level 26000 is broken, then level 25900 will be a high probability target.
(iv) If level 25900 is also broken, then level 25800 will be a high probability target.
No Trading Zone (NTZ): (26150 - 26000)
Event: No expiry. But the day after is the Nifty 50 monthly expiry.
Summary of the Trading Plan (Hypothesis and Insights):
(i) Monthly TF bias is indecision.
(ii) Weekly TF bias is indecision to bearish.
(iii) Daily TF bias is bearish.
(iv) 30-Minute TF bias is bearish.
(v) Establish intraday bias with respect to the opening price.
(vi) The market is in a complex range-bound consolidation for 10 weeks. Thus, market structure is cracked, non-directional, and indecisive.
(vii) Bulls are tired while bears are slowly gaining strength. Technical patterns like complex triple top and head and shoulder (H&S) are visible.
(viii) Every up move should be doubted. Presently, a bearish bias is the path of least resistance for the market.
(ix) Think of bullish trades only when the price sustains above level 26150.
(x) Initiate bearish trades when level 26000 is decisively broken. Level 25900 is a high probability target.
(xi) If level 25900 is also broken, then level 25800 is a high probability target.
(xii) Major resistance (supply) zone: (26150 - 26100).
(xiii) Major support (demand) zone: (25850 - 25800).
(xiv) No Trading Zone (NTZ): (26150 - 26000).
(xv) Monthly expiry is near. Also, the quarter (the 3rd quarter of the financial year) is ending. Thus, we can expect major price anomalies and chaos.
(xvi) Trade only when bullish/ bearish conditions are fulfilled. Remember, not trading is an extension of the trading activity.
NOTE:
"Mark your points. Trade your points. Price is God. Anything can happen in the markets. Therefore, trade what you see, not what you believe."
Happy Trading!

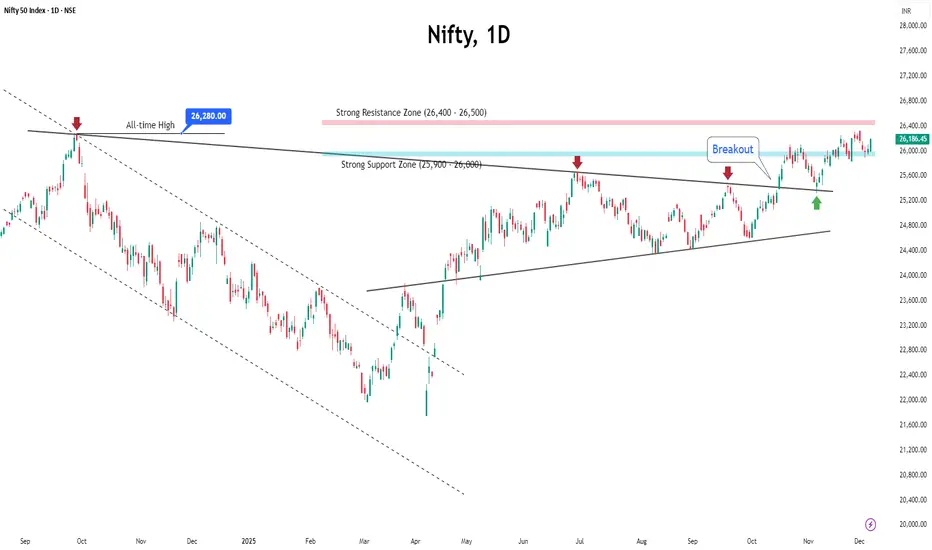
Nifty Holds Support — Is a Fresh Momentum Wave Ahead?The Nifty ended last week almost flat, up 0.6% at 26,186. The index started weak due to profit-booking, FII outflows, and a record-low rupee, but sentiment improved after the RBI cut the repo rate by 25 bps to 5.25%.
Adding to the positive tone, India VIX dropped over 11% to 10.315, highlighting a sharp cooling in volatility and a more stable trading environment.
◉ Technical Setup
Nifty has once again respected its strong support zone between 25,900 and 26,000, bouncing firmly from this level. This zone is expected to remain a key cushion for the coming week as well.
On the upside, the index faces a strong resistance around 26,400–26,500, which will be crucial to watch. A breakout above this could unlock further strength.
For now, the market is likely to trade within this range, oscillating between support and resistance until a clear signal emerges.
◉ Key Trigger This Week
US Fed Meeting (Dec 9–10)
Markets expect a 25 bps rate cut, but mixed signals from Fed officials keep uncertainty high.
A hawkish tone could weigh on global sentiment.
A dovish stance would likely support global markets, especially India.
◉ Suggested Strategy
Investors should adopt a balanced and selective approach:
Favour large caps and sectors that stand to benefit from the RBI rate cut, such as financials and autos,
Export and IT stocks may continue to draw support from the weaker rupee.
For traders, buy-on-dips remains the preferred strategy near strong support levels. Focus on stock-specific setups, maintain moderate position sizes, and stay flexible ahead of the crucial FOMC outcome.
Nifty50 Today(1/12/2025) analysis
CPR: Narrow + outside cpr: Sideways to bearish.
FII: -3,795.72 Sold
DII: 4,148.48 bought.
Highest OI:
Resistance:26300,26400.
Support :26000.
conclusion:
My pov:
1.Market opens with gap up but cpr shows a bearish view in techinical analysis ,there is two ways to confirm it if breakes ATH and sustains in 1hr candle and if it breaks and sustain above R1,also check volume . then go bullish.
2.market can be sideways to bearish.
3.confirmation is the key and wait for clarity.
psychology fact : most of the time, not doing anything is the best trading exercise you can ever do.
note:
8moving average ling is blue colour.
20moving average line is green colour
50moving average line is red colour.
200moving average line is black colour.
cpr is for trend analysis.
MA line is for support and resistance.
Disclaimer:
Iam not Sebi registered so i started this as a hobby, please do your own analysis, any profit/loss you gained is not my concern. I can be wrong please do not take it seriously thank you.

Today(17/11/2025),nifty50 analysis.
CPR: slightly wide + overlapping lower cpr: sideways to bearish.
FII: -4,968.22 sold.
DII: 8,461.47 bought.
Highest OI:
Resistance: 26000, 26100
Support : 25800,25700
conclusion:
My pov: market is neutral to bearish, If and only 26100 is closed and crossed i view as bullish trend lets wait and watch. why because FII keep selling, That the reason i cant clearly think market is in bullish,
psychology fact : Trading is a profession where you have to think freely and creatively.
note:
8moving average ling is blue colour.
20moving average line is green colour
50moving average line is red colour.
200moving average line is black colour.
cpr is for trend analysis.
MA line is for support and resistance.
Disclaimer:
Iam not Sebi registered so i started this as a hobby, please do your own analysis, any profit/loss you gained is not my concern. I can be wrong please do not take it seriously thank you.

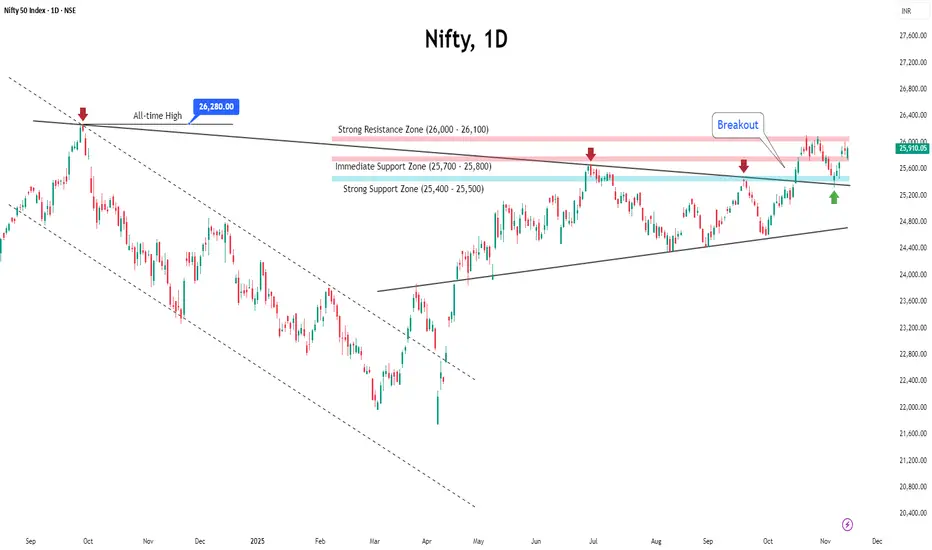
Nifty Builds Momentum, Breakout Looks Within ReachThe Indian market ended last week on a positive note, supported by the stronger-than-expected performance of the National Democratic Alliance (NDA) in the 2025 Bihar elections.
Nifty jumped over 1.5% to close at 25,910, just below the key resistance level of 26,000. Volatility also eased, with the India VIX falling over 5% on a weekly basis to settle at 11.93.
Open interest data suggests that the 25,700–25,800 zone will now act as immediate support, while 25,500 remains a strong support level.
Recent price action indicates that Nifty may attempt to break above the 26,000 resistance in the coming sessions.
In the week ahead, the overall sentiment is expected to stay positive due to strong domestic cues. Globally, market direction will depend on key U.S. economic releases, including the minutes of the latest FOMC meeting.
Investors should stick to a stock-specific approach, focusing on sectors supported by domestic demand. For traders, a buy-on-dips strategy remains favourable as long as Nifty holds above its key support zones.
Nifty Holds 24k: FII Confidence Hints at Bullish Trend Ahead● Despite rising war tensions, Nifty held firm above the 24,000 mark last week, showing the strength and resilience of Indian market—bolstered further by strong Q4 earnings.
● While many are expecting a sharp fall, foreign investors (FIIs) have mostly continued buying, except for last session, which suggests confidence is still intact and a major crash seems unlikely.
● Meanwhile, India VIX spiked above 21, signalling that volatility is heating up.
● Option data shows heavy put writing at the 24,000 level, marking it as a strong immediate support zone.
● On the charts, 23,800 stands out as solid technical support, and as long as Nifty stays above it, the overall mood is likely to stay bullish.
● Given this setup, the market is likely to trade in a sideways to bullish range in the coming week, unless major negative news breaks.

Nifty 50 Index spot 23092.20 by the Daily Chart viewNifty 50 Index spot 23092.20 by the Daily Chart view
- Just sharing my personal point of view for things to unfold and look forward to for the coming week and then some more.

NIFTY50 Head & Shoulder Pattern in Weekly Charts₹₹Nifty50 making Head & Shoulder in Weekly Charts with Price range of 3000 points(23266-26277). If Chart Pattern play-out perfectly then Target price range will be 2500-3000 points till 20288 levels.
Nifty50 also have a gap on 20288 levels bcoz of Election Results of 4 States on Dec 3,2023 after that rally started. Now Nifty50 can fill this gap if Chart Pattern play-out perfectly.
I will wait for Nifty50 to break down 23266-22777 levels zone & closing below 22777 levels. If Nifty50 close below 22777 levels then Short Nifty50 for Targets of 22122, 21777, 21288, 20777 & 20288 with Stop Loss of 23444.
But this Pattern will fail above levels of 24555.
Most Important we have to carefully watch RELIANCE bcoz it's already at 52 week lows & At Parallel Channel Support in Monthly Charts. If Reliance also give breakdown of channel then it will be easy for Nifty50 to reach all targets. Similarly HDFC BANK at upper Resistance of Parallel Channel in Monthly Charts.

Nifty 50 spot 24685 by the Daily Chart viewsNifty 50 spot 24685 by the Daily Chart views
-Gap Down Opening Fill-Up for 05-August-2024 seen by all probably is seen on the Nifty 50 Daily Chart. Gap Down Opening was from 24686 to 24350
- Nifty Index traversed thru Back to Back Parallel Rising Price Channel but currently it seems like a decent Resistance Zone at 25075 to 25225 with the nearest Support Zone seen at 24375 to 24475

Nifty50 Support And Resistance 10-Oct-24Find find below simple Support and Resistance:
Resistance1: 25160
Resistance2: 25234
Support1: 24888
Support2: 24756
Dis: not sebi resistered.

Nifty 50 spot 25014.60 by Daily Chart views*Nifty 50 spot 25014.60 by Daily Chart views*
- 24750 to 24875 may be probable Support Zone
- Gap Down openings will need to be filled in sooner or later on
- Nifty 50 Index traversing in Bullish Rising Price Channel currently near Probable Support Zone for upside reversal anticipated

Nifty50 Support And Resistance 12-Aug-2024
Please find Above simple resistance and support
𝐃𝐈𝐒𝐂𝐋𝐀𝐈𝐌𝐄𝐑: I'm not 𝐒𝐄𝐁𝐈 Registered.

Nifty50 Support And Resistance 9-Aug-2024Please find Above simple resistance and support
𝐃𝐈𝐒𝐂𝐋𝐀𝐈𝐌𝐄𝐑: I'm not 𝐒𝐄𝐁𝐈 Registered.

Nifty50 Support And Resistance 8-Aug-2024Nifty50 Support And Resistance 8-Aug-2024
Please find Above simple resistance and support
𝐃𝐈𝐒𝐂𝐋𝐀𝐈𝐌𝐄𝐑: I'm not 𝐒𝐄𝐁𝐈 Registered.

Nifty50 Support And Resistance 7-Aug-2024Nifty50 Support And Resistance 7-Aug-2024
Please find Above simple resistance and support
𝐃𝐈𝐒𝐂𝐋𝐀𝐈𝐌𝐄𝐑: I'm not 𝐒𝐄𝐁𝐈 Registered.

Nifty50 Support And Resistance 6-Aug-2024Nifty50 Support And Resistance 6-Aug-2024
Please find Above simple resistance and support
𝐃𝐈𝐒𝐂𝐋𝐀𝐈𝐌𝐄𝐑: I'm not 𝐒𝐄𝐁𝐈 Registered.

Nifty montly chart analysis for Month of April 2024.Nifty is around the ATH and there is profit booking at the higher levels.
The market is spending time near the high and last week too it has test the ATH. Seller are there in the higher levels and closing of the weekly candel is dicey.
Higher time frame is showing some RSI bearish divergence and market is forming grave stone doji on the daily charts.
Monthly charts has not formed a red candle still and is forming doji after doji which still shows no clear bearish indication. But the price is trading on the higher levels of the bollinger band.
Market participants be cautious as there seems to be a bearish month ahead.
This being the election year may remain volatile till the election results. Spike may be seen in this month or the next one either side.
Trend is still bullish and doji on the higher levels may indicate a reversal after a price action formation.
This month was a volatile one and market didn't settle either side. There was days when market has moved more than 400 points.
Last day move, is the only trending move in last 2 weeks, closing 180 points lower from the day high.
Price action is needed to be formed around the higher levels on higher time frame to confirm the trend.

NIFTY 50 at key support levelNIFTY 50 is once again testing key support levels and the 2024 support trend line
If it sustains below 21837, it will be sign of reversal
Although it is almost certain to give a bounce from these levels
Unless...it's the end of the bull run, in which case there are a lot of gaps pending at lower levels

WILL NIFTY50 SHOW REVERSAL FROM SUPPORT LEVELS ?Symbol - NIFTY50
CMP - 21980
NIFTY50 witnessing heavy selling and now slipping below 22,000 round level.
Market sentiment is weak but according to my analysis, Nifty is now trading at major support levels.
22000 - 21930 is good support range for Nifty. I believe Nifty will take support from current levels & will show a reversal from here soon.
Dow Jones is at good support levels, Crude is showing reversal from upper levels etc. are the triggers that will help Nifty to go higher from current levels.
Hence I'm taking Future long positions in Nifty at CMP 21977 - 21980
I'll add more position around 21920 - 21930 levels, if comes & hold with 21880 SL.
Targets will be 22170 - 22300 - 22430

Nifty50 Support And Resistance 23-Feb-24Please find below simple resistance and support:
Resistance: 22266
If crossed up then will see upward move as follows:
T1: 22347
T2: 22412
Support: 22133
If crossed down then will see downward move as follows:
T1: 22087
T2: 22022
This is only for education purpose. Do your own research before investing or trading.
I AM NOT SEBI REGISTERED ANALYST, SO BEFORE TAKING ANY DECISION CONSULT ANY PROFESSIONAL.
We Strictly Recommend You Not To Make Any Decisions, Financial, Investments, Trading, Or Otherwise.
Please Understand That Using This Information Would Be Totally At Your Own Risk.
****************************************************************************
𝐃𝐈𝐒𝐂𝐋𝐀𝐈𝐌𝐄𝐑: We/I are not 𝐒𝐄𝐁𝐈 ( Securities and Exchange Board of India ) Registered. The Information Provided Is For Educational & Instructive Purposes Only. Our Intention Is Not To Provide Any Financial Advice, Investment Advice, Training Advice, Or Any Other Advice. This Is General Information And Is Not Explicit To You Or Anyone Else.
Without The Consultation Of Any Professional, We Strictly Recommend You Not To Make Any Decisions, Financial, Investments, Trading, Or Otherwise. Please Understand That Using This Information Would Be Totally At Your Own Risk.
Do Not Take Any Action Unless You Are Set Up To Continue An
'All Out Misfortune " or "Total Loss".
Your Misfortune Could Incorporate Cash You Contributed Just As Commissions And Exchange Charges

Nifty50 Support And Resistance 15-Feb-24Please find below simple resistance and support:
Resistance: 21916
If crossed up then will see upward move as follows:
T1: 21970
T2: 22035
Support: 21784
If crossed down then will see downward move as follows:
T1: 21709
T2: 21664
This is only for education purpose. Do your own research before investing or trading.
I AM NOT SEBI REGISTERED ANALYST, SO BEFORE TAKING ANY DECISION CONSULT ANY PROFESSIONAL.
We Strictly Recommend You Not To Make Any Decisions, Financial, Investments, Trading, Or Otherwise.
Please Understand That Using This Information Would Be Totally At Your Own Risk.
****************************************************************************
𝐃𝐈𝐒𝐂𝐋𝐀𝐈𝐌𝐄𝐑: We/I are not 𝐒𝐄𝐁𝐈 ( Securities and Exchange Board of India ) Registered. The Information Provided Is For Educational & Instructive Purposes Only. Our Intention Is Not To Provide Any Financial Advice, Investment Advice, Training Advice, Or Any Other Advice. This Is General Information And Is Not Explicit To You Or Anyone Else.
Without The Consultation Of Any Professional, We Strictly Recommend You Not To Make Any Decisions, Financial, Investments, Trading, Or Otherwise. Please Understand That Using This Information Would Be Totally At Your Own Risk.
Do Not Take Any Action Unless You Are Set Up To Continue An
'All Out Misfortune " or "Total Loss".
Your Misfortune Could Incorporate Cash You Contributed Just As Commissions And Exchange Charges
