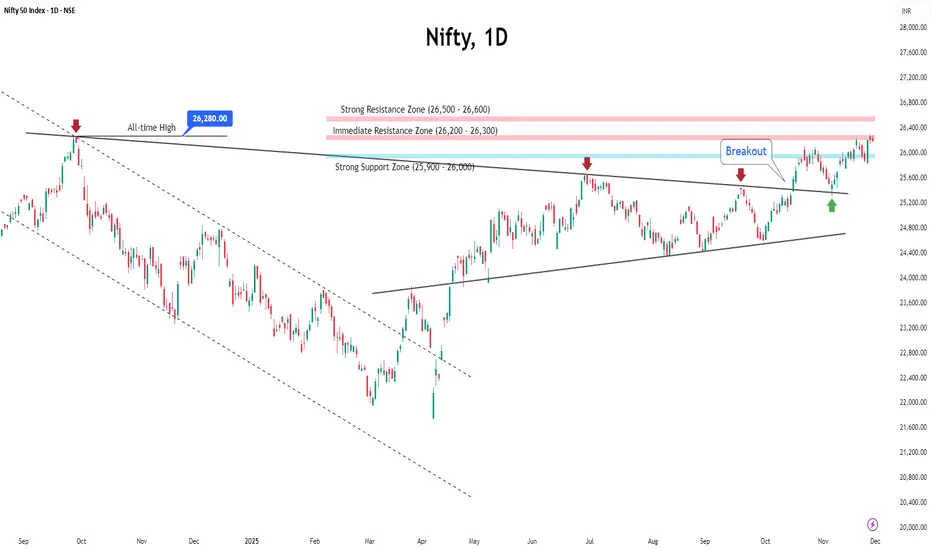
Nifty Hits a New Peak: Is the Next Leg Up Around the Corner?Indian equities kicked off the New Year with confidence, gaining nearly 1% and finally breaking out of a five-week consolidation phase. After a slow and mixed start, a strong rebound in the latter half of the week pushed the Nifty to a fresh all-time high of 26,329.
Volatility ticked up slightly, with India VIX rising 3.28% to 9.45, but it continues to remain at comfortable, historically low levels.
◉ Technical Outlook
As highlighted earlier, the Cup & Handle pattern has now taken a clearer shape. A decisive breakout and sustained move above the neckline could trigger the next leg of the rally.
◉ Key Levels to Watch
● Resistance: 26,500 – 26,600 (heavy call writing zone)
● Immediate Support: 26,100 – 26,200
● Strong Support: 25,900 – 26,000 (heavy put writing zone)
◉ Near-Term View
Nifty is likely to consolidate within a 300-point range, broadly between 26,200 and 26,500, as the market digests recent gains.
◉ Key Trigger to Watch
Global cues remain important. Markets will closely monitor developments after reports of US military strikes on Venezuela, which could influence sentiment in the coming sessions.
◉ Trading Strategy
Expect mild profit-taking at higher levels. Avoid aggressive fresh buying, protect existing gains, and stay selective by focusing on stocks showing relative strength.
Nifty50technicalanalysis

NIFTY Hits New Highs but Breadth Weakens — What’s the Signal?The NIFTY 50 closed the week with a neat gain of 134.80 points (0.52%), touching fresh lifetime highs of 26,310.45.
Sounds impressive, right?
Yes — but there’s a twist.
A deeper look shows the Nifty 500 is still over 2.5% below its all-time high.
Meaning? This rally is not broad-based — it’s being carried by select large-cap heavyweights.
Meanwhile, the India VIX dropped 14.77% to 11.62, keeping volatility calm… for now.
◉ Key Levels to Watch This Week
Support Zones
● 26,000 — Strong and immediate support. Heavy put writing is visible here.
Resistance Zones
● 26,200 – 26,300 — Near-term supply zone
● 26,500 — Major resistance to beat
◉ Key Triggers This Week
1. RBI Policy – December 5
A 25 bps rate cut is widely expected, but the RBI may take a cautious approach as it balances low inflation with rising growth momentum.
2. Q2 GDP at 8.2%
The stronger-than-expected GDP print boosts sentiment but reduces the urgency for aggressive rate cuts, shifting the policy outlook toward a more measured stance.
3. India–US Trade Deal
Both countries are close to finalizing the agreement by year-end, which could support IT, manufacturing and export-focused sectors.
4. Rupee Weakness
The rupee’s slide to ₹89.49/$ raises import costs and potential inflation risks, adding pressure on the RBI while impacting corporate margins differently across sectors.
◉ December Outlook — What’s Likely Ahead?
● Base Case: NIFTY stays in a 26,000–26,500 range, with most upside already priced in.
● Bull Case: A breakout above 26,500 could send it toward 26,700 by month-end.
● Caution: If market breadth weakens further, volatility may creep back in.
◉ Strategy:
● As long as NIFTY holds above 26,000, sentiment stays positive.
● Dips above 26,000 = buying opportunity
● Avoid chasing breakouts blindly — focus on quality sectors and high-volume confirmations.
Today(13/11/2025),Nifty50 analysis.
CPR: narrow+ascending cpr: trending.
FII: -1750.03 sold.
DII: +5127.12 bought.
Highest OI:
Resistance: 26000
Support : 25800,25700
Events.
1.Bihar elections result on Friday from morning.
conclusion:
My pov: there is uncertainty so no view until the event is over, and preserve the capital.
psychology fact : It is important to make sure that your losses are reasonable.
note:
8moving average ling is blue colour.
20moving average line is green colour
50moving average line is red colour.
200moving average line is black colour.
cpr is for trend analysis.
MA line is for support and resistance.
Disclaimer:
Iam not Sebi registered so i started this as a hobby, please do your own analysis, any profit/loss you gained is not my concern. I can be wrong please do not take it seriously thank you.

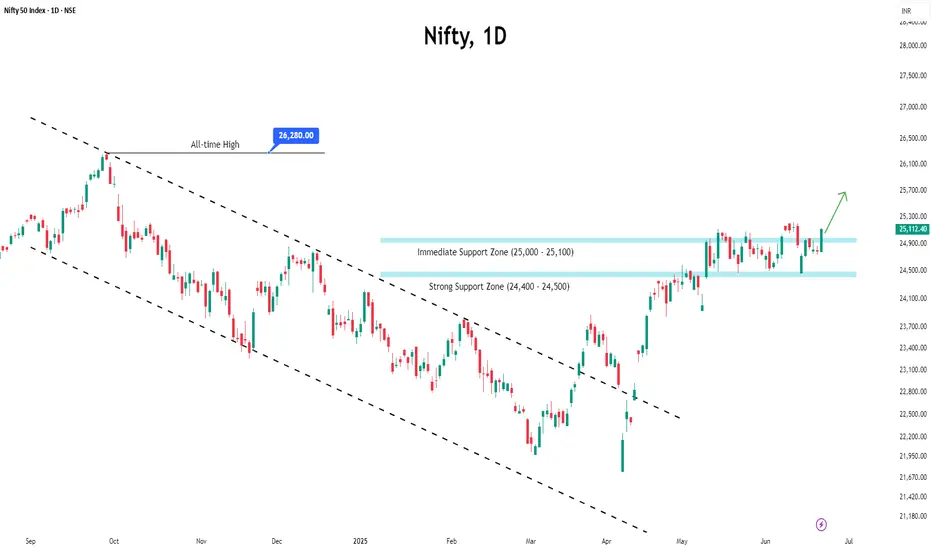
Nifty Eyes Upside as Bulls Take Charge Ahead of Expiry WeekThe Nifty closed around 25,112 on Friday, marking a 1.29% gain for the week and signalling strong bullish momentum. The rally was driven by broad-based buying, particularly in financial heavyweights like HDFC Bank, ICICI Bank, and Reliance Industries.
Despite lingering global uncertainties, market sentiment remained stable, with the India VIX closing at 13.67—reflecting subdued volatility and cautious optimism among participants.
In the derivatives space, the highest concentration of put writing at the 25,000 strike highlights strong immediate support, while the 25,500 level is emerging as a key resistance zone due to significant call writing activity.
Heading into the upcoming expiry week, the bullish trend is likely to continue, provided no major geopolitical shocks disrupt market sentiment.
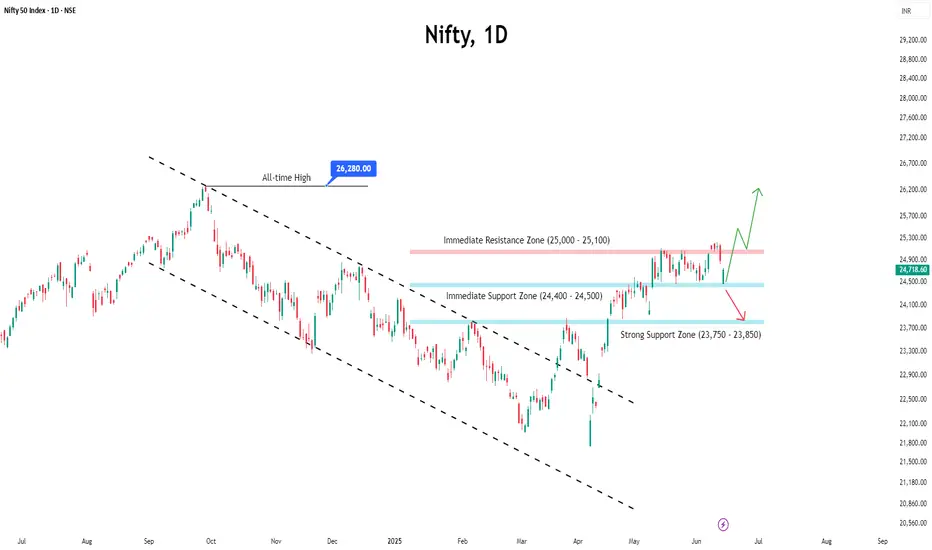
Nifty Weekly Outlook: Volatility Ahead Amid Global Tensions● Despite briefly breaking above the 25,100 resistance last week, Nifty failed to sustain the momentum and witnessed a corrective pullback towards the 24,500 level.
● Market volatility ticked up, with India VIX rising by 3.08% to 15.08 on a weekly basis, reflecting growing investor nervousness.
● Geopolitical tensions—particularly the escalating conflict between Israel and Iran—are weighing on global sentiment, and Indian equities are not immune to this uncertainty. However, relative strength in the Indian markets suggests that they may continue to outperform global peers in the near term.
● For the upcoming week, Nifty is expected to remain highly volatile, with wide-range oscillations likely. A directional trend may only emerge if Nifty decisively breaches 25,100 on the upside or breaks below the key support at 24,500.
● Options data indicates that the 25,000 level will act as a strong resistance, while 24,500 remains a crucial support zone.
● Importantly, if the index opens below 24,400 at the start of the week, it could invite further selling pressure, tipping the balance in favor of the bears.
● Given the global headwinds and sensitive technical setup, traders are advised to stay cautious as heightened volatility could dominate the week ahead.
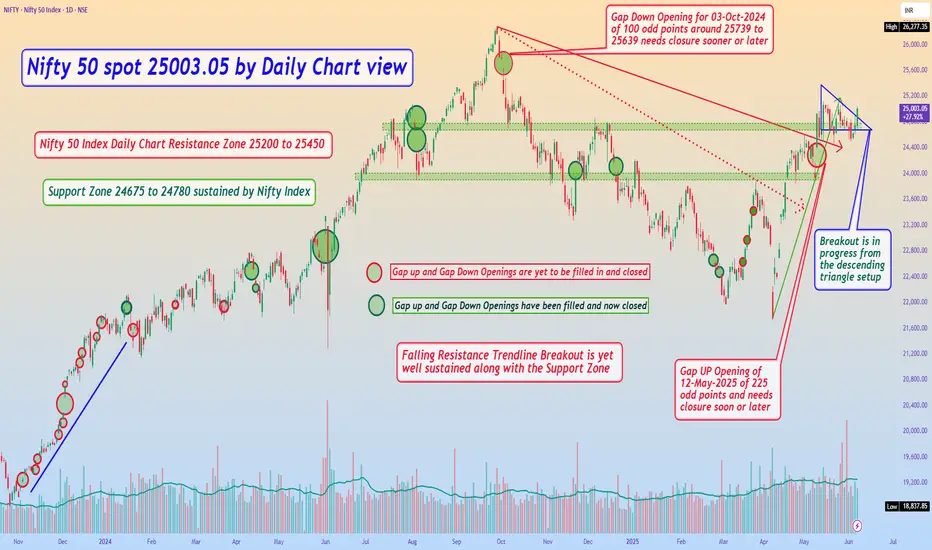
Nifty 50 spot 25003.05 by Daily Chart view - Weekly UpdateNifty 50 spot 25003.05 by Daily Chart view - Weekly Update
- Support Zone 24675 to 24780 sustained by Nifty Index
- Nifty 50 Index Daily Chart Resistance Zone 25200 to 25450
- Breakout seems in progress from the descending triangle setup
- Gap UP Opening of 12-May-2025 of 225 odd points, needs closure sooner or later
- *Nifty 50 Index yet lagging well behind to create a New ATH unlike the Bank Nifty Index*
Nifty Breaks Past 25,000: Is a New High on the Horizon?Last week, Nifty broke above the psychological milestone of 25,000, shaking off market doubts and sparking fresh bullish momentum.
◉ Key levels to watch:
The zone between 24,750–24,850 now acts as immediate support, while 23,750–23,850 remains a major support.
This rally wasn't just a technical bounce — it was fuelled by meaningful tailwinds:
● India-Pakistan Ceasefire helped ease geopolitical concerns, calming the nerves of investors.
● Cooling inflation in both India and the U.S. sparked hopes of rate cuts, improving market liquidity.
● Strong corporate earnings from majors like Hero MotoCorp , HCL Tech , and Tata Motors lifted sentiment.
With continued FII inflows , the bullish momentum is expected to persist — potentially pushing Nifty toward its all-time high in the near term.

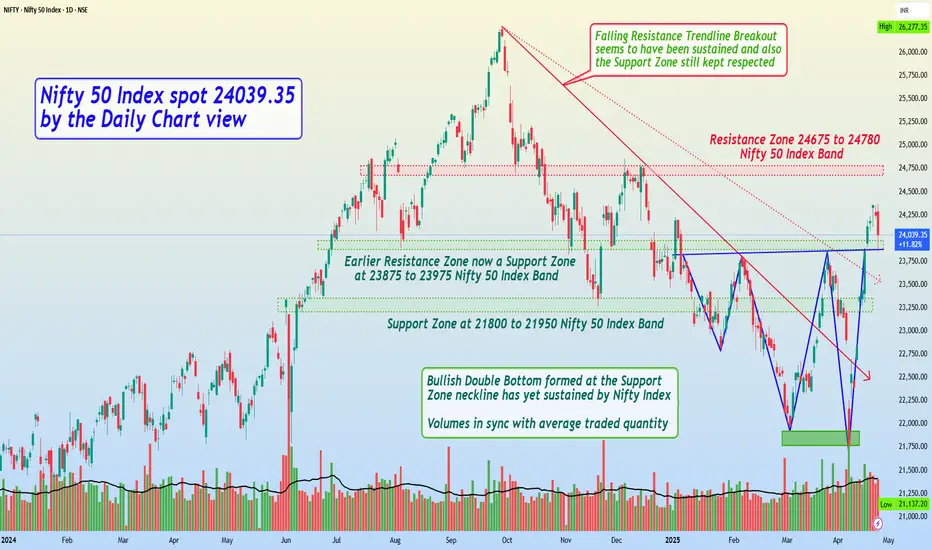
Nifty 50 Index spot 24039.35 by Daily Chart view - Weekly UpdateNifty 50 Index spot 24039.35 by the Daily Chart view - Weekly Update
- Resistance Zone 24675 to 24780 Nifty 50 Index Band
- Volumes are in good sync with the average traded quantity
- Both the Falling Resistance Trendlines have been decently maintained todate
- Earlier Resistance Zone now a Support Zone at 23875 to 23975 Nifty 50 Index Band
- Bullish Double Bottom formed at the Support Zone neckline has yet sustained by Nifty Index
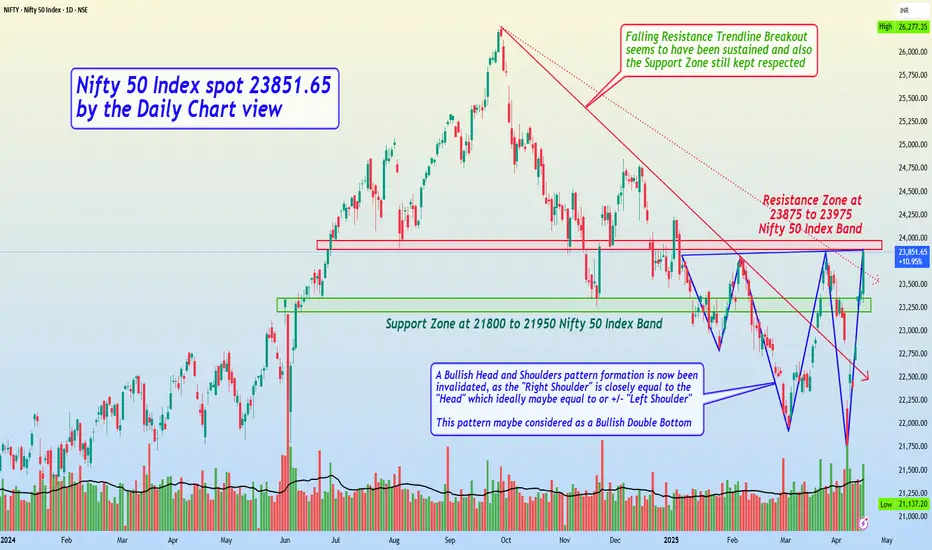
Nifty 50 Index spot 23851.65 by Daily Chart view - Weekly UpdateNifty 50 Index spot 23851.65 by the Daily Chart view - Weekly Update
* Support Zone at 21800 to 21950 Nifty 50 Index Band
* Resistance Zone at 23875 to 23975 Nifty 50 Index Band
* A Bullish Head and Shoulders pattern formation is now been invalidated, as the "Right Shoulder" is closely equal to the "Head" which ideally maybe equal to or +/- "Left Shoulder". This pattern maybe considered as a Bullish Double Bottom
Nifty 50 Index spot 22904.45 by Daily Chart viewNifty 50 Index spot 22904.45 by Daily Chart view
- Resistance Zone at 23875 to 23975 for Nifty 50 Index Band
- Can we expect the Right Shoulder depth act as a Support base alike of the Left Shoulder depth near 22700 to 22800 ???
- If the Right Shoulder gets sustained, a Support base in sync with the Left Shoulder of the Bullish Head & Shoulder pattern may get activated
- Let us hope for the best to happen expecting some fresh breather over the next week basis the fact that, the Markets are always Supreme to look up to ......

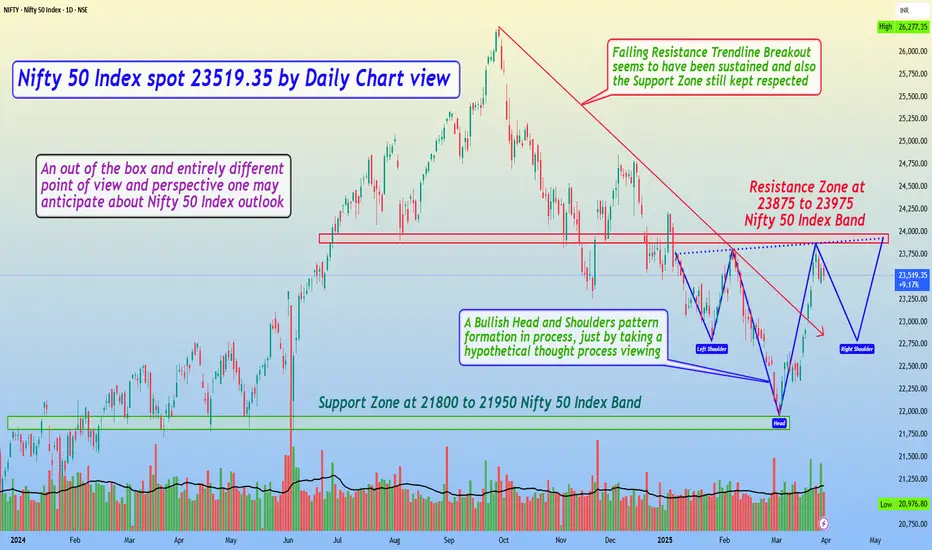
Nifty 50 Index spot 23519.35 by Daily Chart view - Weekly updateNifty 50 Index spot 23519.35 by Daily Chart view - Weekly update
- Support Zone at 21800 to 21950 Nifty 50 Index Band
- Resistance Zone at 23875 to 23975 Nifty 50 Index Band
- Falling Resistance Trendline Breakout seems to have been sustained and also Support Zone still kept respected
- A Bullish Head and Shoulders pattern formation in process, just by taking a hypothetical thought process viewing
- An out of the box and entirely different point of view and perspective one may anticipate about Nifty 50 Index outlook
- Going by this Hypothetical H&S probability for the Nifty 50 Index Chart, we may anticipate good fire crackers to observe
- As such this is just a high level technical chart pattern formation and the Market are always Supreme to work in their own ways
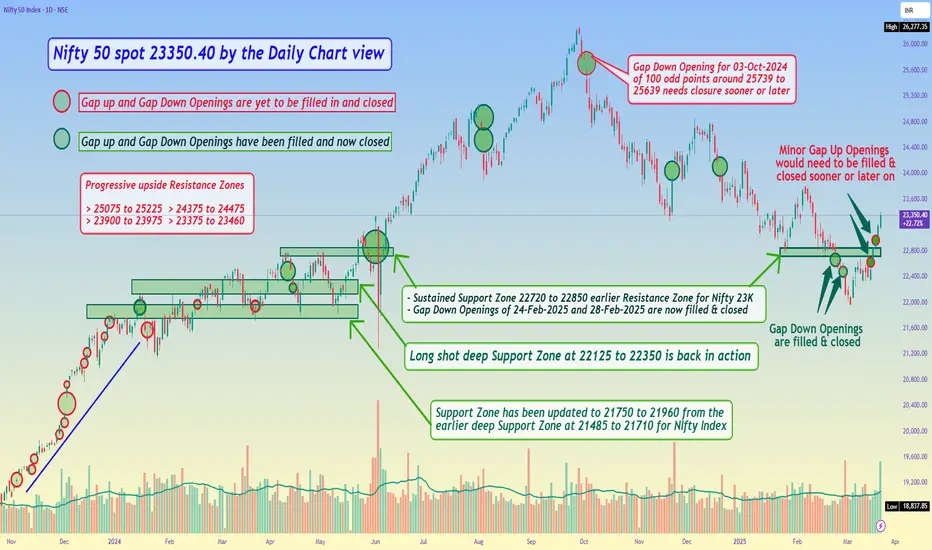
Nifty 50 spot 23350.40 by the Daily Chart view - Weekly updateNifty 50 spot 23350.40 by the Daily Chart view - Weekly update
- Sustained Support Zone 22720 to 22850 earlier Resistance Zone for Nifty 23K
- Minor Gap Up Openings around above Support Zone would need to be filled & closed sooner or later on
- Next set of Resistance Zones seen at indicative Nifty 50 Index levels of 23375 to 23460 and 23900 to 23975
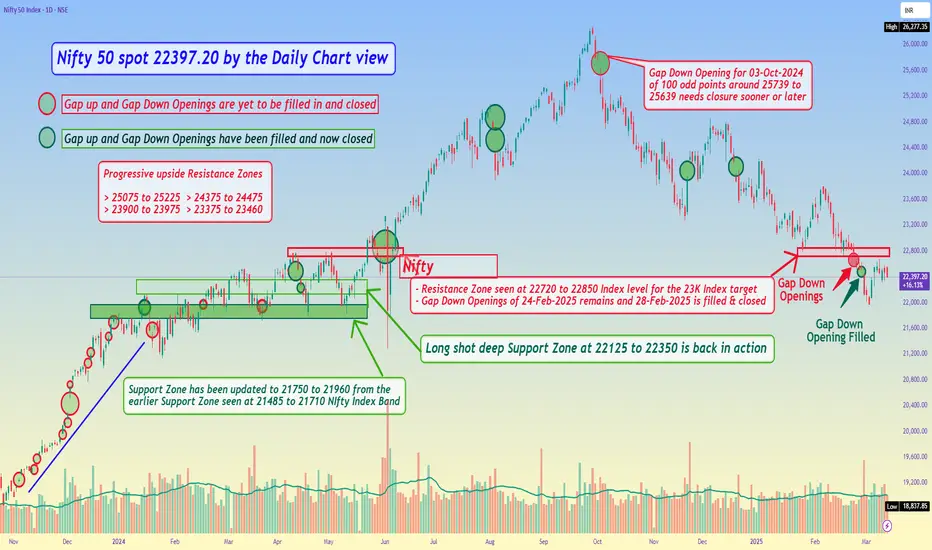
Nifty 50 spot 22397.20 by the Daily Chart view - Weekly updateNifty 50 spot 22397.20 by the Daily Chart view - Weekly update
- Resistance Zone seen at 22720 to 22850 Index level for the 23K Index target
- Gap Down Openings of 24-Feb-2025 remains and 28-Feb-2025 is filled & closed
- Long shot deep inline Support Zone seen at 22125 to 22350 is now back in action
Nifty 50 Index 22124.70 by Daily Chart view: Different ViewpointNifty 50 Index 22124.70 by the Daily Chart view - Different Viewpoint
A different point of view for the Nifty 50 Index Technical Chart Setup Analysis. This is solely and purely my personal perspective for the Bearish Head & Shoulders pattern's. I will be happy to welcome and get your fine line pointers for the improvement on the Technical Analysis for this Chart Setup. Thank you in advance to One and All.
The 1st H&S Bottom is broken down and now need to look forward, if ..... Nifty 50 Index touches the 2nd H&S Bottom or takes an early reversal ..... Hope for the best to happen and keeping fingers crossed. God Bless All.

Nifty 50 spot 22124.70 by the Daily Chart viewJust sharing an update in continuation over the last week Nifty 50 Index chart data reading.
Nifty 50 spot 22124.70 by the Daily Chart view
- Next Support Zone at 21485 to 21710 Level
- Gap Down Openings of 24-Feb-2025 and 28-Feb-2025 would need to be closed

Nifty 50 spot 22795.90 by the Daily Chart viewNifty 50 spot 22795.90 by the Daily Chart view
- Nifty 50 Index 22775 to 22950 Support Band is yet sustained
- Long shot deep Support Zone seen at 22125 to 22350 which for now seems bit (un)likely by current technical chart status setup
- Just a flag to highlight : Nifty Index had dipped up to 22720 in recent past few days and similar levels was Resistance Level in April 2024 for 23K Index target
- Few of the Gap Ups and Gap Down openings, yet are remaining to get closed and filled in below the Old Long Shot Support Zone at 22125 to 22350 for Nifty Index levels

Nifty 50 Index spot 22929.25 by Monthly Chart viewNifty 50 Index spot 22929.25 by Monthly Chart view
- Nifty 50 Index trending along the Rising Support Trendline 4th time over since March 2020.
- Support point starting March 2020, next in March 2023 followed in Nov 2023 and now in Feb 2025.
- *What can we anticipate and can we hope for some upside reversal from here ????*

Nifty 50 spot 22929.25 by the Daily Chart viewNifty 50 spot 22929.25 by the Daily Chart view
- Just an FYI to note, for the current status of the Nifty 50 Index Daily Closure
- Nifty 50 Index 22775 to 22950 Support Band is yet sustained and nothing more to quote

Nifty 50 23559.95 Daily Chart view - Update on 02-Feb-2025Nifty 50 spot 23559.95 by the Daily Chart view
- Resistance Zone 23900 to 23975 Index level
- Resistance Zone 23375 to 23460 turned to Support Zone still been sustained
- Nifty Daily Chart view of 02-February-2025

Nifty 50 spot 23482.15 by the Daily Chart viewNifty 50 spot 23482.15 by the Daily Chart view
- Nifty 50 Index 22775 to 22950 Support Band is yet sustained
- Resistance Zone 23375 to 23460 to turn in as a probable Support Zone

Nifty 50 spot 23507.50 by the Daily Chart view*Just an FYI to share on the Nifty 50 Index Chart shared last week*
*Nifty 50 spot 23507.50 by the Daily Chart view*
- Nifty 50 Index 22775 to 22950 Support Zone has been sustained by Daily upwards closure above it

Nifty 50 spot 24556.00 by Hourly Chart viewNifty 50 spot 24556.00 by Hourly Chart view
- Intermediate Support Zone 24475 to 24525
- Resistance Zone 24750 to 24885 Price Band may become a Support Zone
- The Next Support Zone seen at 24300 to 24375 Price Band acting as H&S neckline
- Resistance Zone 24750 to 24885 Price Band needs to be crossed, closure sustained above it for continued upwards bullish transition

Nifty 50 spot 24781.30 by Hourly Chart viewNifty 50 spot 24781.30 by Hourly Chart view
- Intermediate Support Zone 24475 to 24525
- Resistance Zone 24750 to 24885 Price Band may become a Support Zone
- The Next Support Zone seen at 24300 to 24375 Price Band acting as H&S neckline
- Resistance Zone 24750 to 24885 Price Band needs to be crossed, closure sustained above it for continued upwards bullish transition
