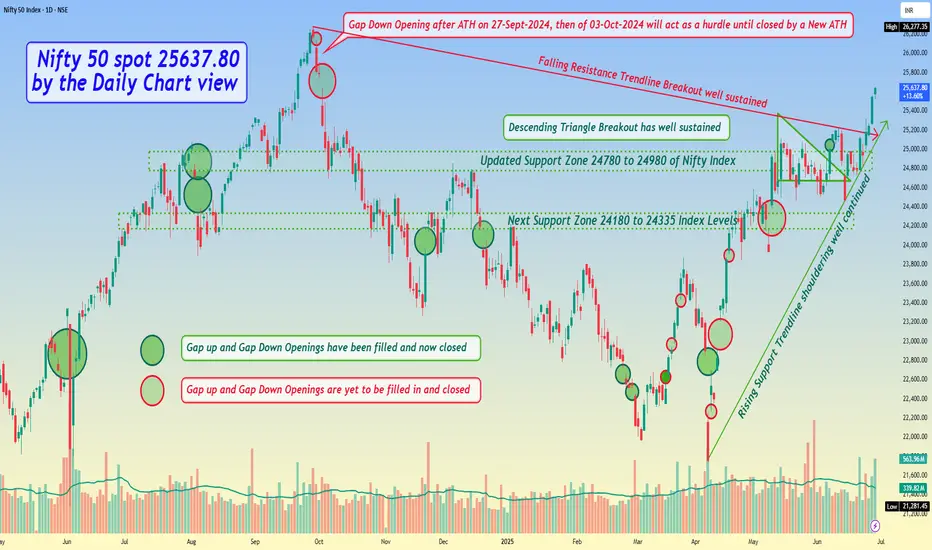
Nifty 50 spot 25637.80 by the Daily Chart view - Weekly update*Nifty 50 spot 25637.80 by the Daily Chart view - Weekly update*
- Descending Triangle Breakout has well sustained
- Immediate Support Zone 25125 to 25335 of Nifty Index
- Next updated Support Zone 24780 to 24980 of Nifty Index
- And then next Support Zone 24180 to 24335 of Nifty Index Levels
- Resistance Zone seen at 25860 to 26035 and then ATH 26277.35 of Nifty 50 Index levels
- Rising Support Trendline shouldering well continued and Falling Resistance Trendline Breakout well sustained
- *Gap Down Opening after ATH on 27-Sept-2024, then of 03-Oct-2024 will act as a hurdle until closed by a New ATH*
Nifty50technicalchartanalysis
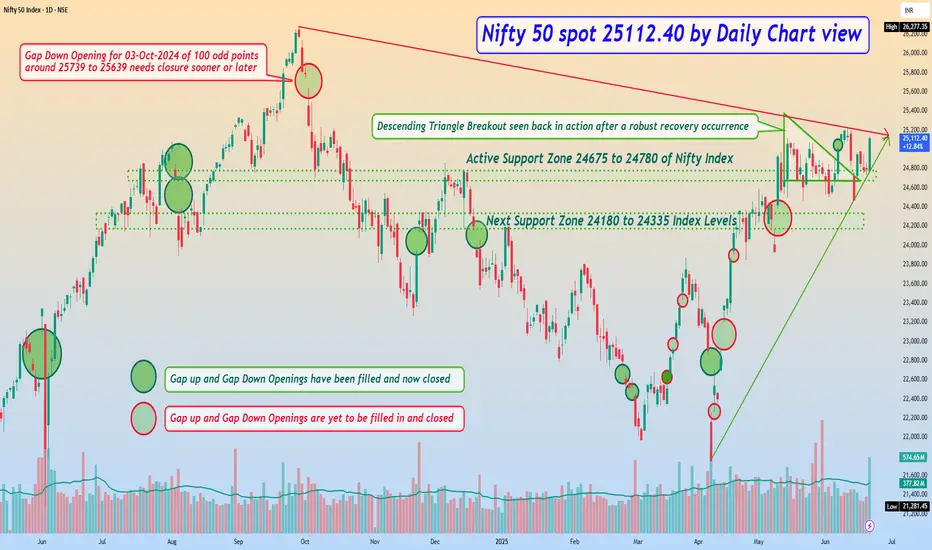
Nifty 50 spot 24112.40 by Daily Chart view - Weekly update**Nifty 50 spot 24112.40 by Daily Chart view - Weekly update*
- Active Support Zone 24675 to 24780 of Nifty Index
- Next Support Zone 24180 to 24335 of Nifty Index Levels
- Resistance Zone seen at 25200 to 25335 of Nifty 50 Index Levels
- Descending Triangle Breakout seen back in action after a robust recovery occurrence
- *Rising Support Trendline seems to have come into active mode but yet needs a stronghold*
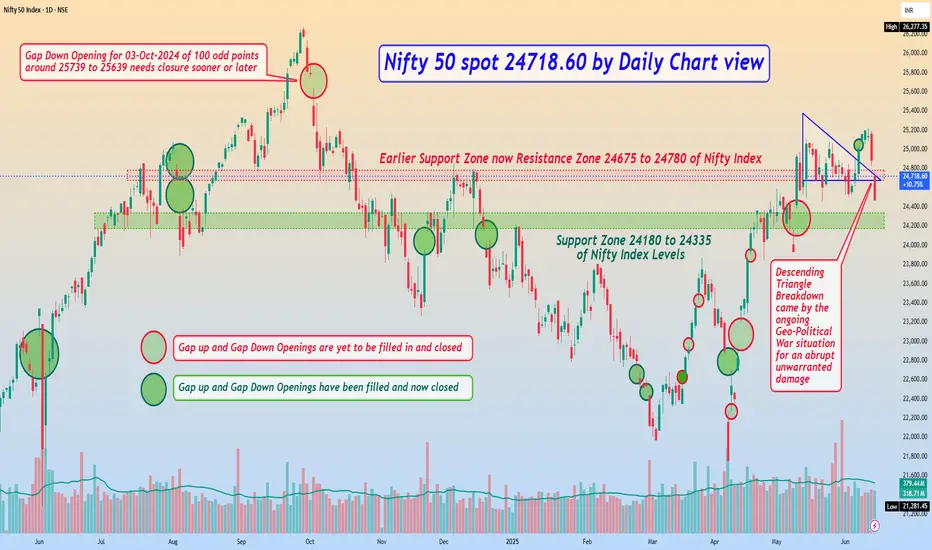
Nifty 50 spot 24718.60 by Daily Chart view - Weekly UpdateNifty 50 spot 24718.60 by Daily Chart view - Weekly Update
- Support Zone 24180 to 24335 of Nifty Index Levels
- Earlier Support Zone now Resistance Zone 24675 to 24780 of Nifty Index
- Descending Triangle Breakdown came by the ongoing Geo-Political War situation for an abrupt unwarranted damage
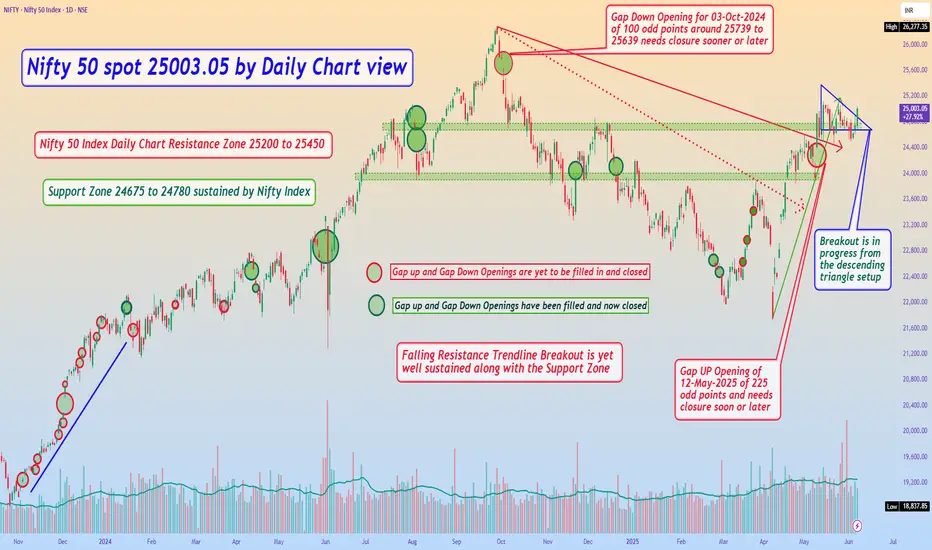
Nifty 50 spot 25003.05 by Daily Chart view - Weekly UpdateNifty 50 spot 25003.05 by Daily Chart view - Weekly Update
- Support Zone 24675 to 24780 sustained by Nifty Index
- Nifty 50 Index Daily Chart Resistance Zone 25200 to 25450
- Breakout seems in progress from the descending triangle setup
- Gap UP Opening of 12-May-2025 of 225 odd points, needs closure sooner or later
- *Nifty 50 Index yet lagging well behind to create a New ATH unlike the Bank Nifty Index*
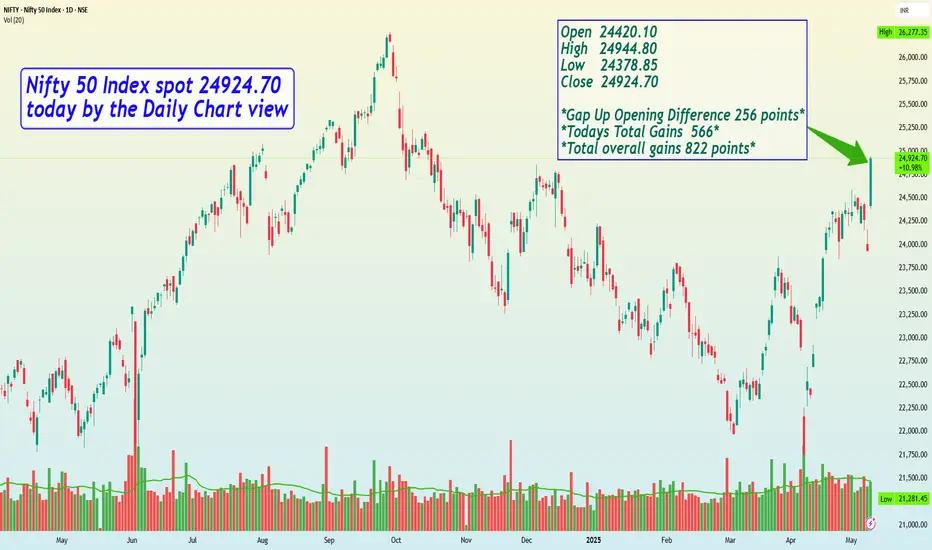
Nifty 50 Index spot 24924.70 today by the Daily Chart viewNifty 50 Index spot 24924.70 today by the Daily Chart view
Open 24420.10
High 24944.80
Low 24378.85
Close 24924.70
Gap Up Opening Difference 256 points
Todays Total Gains 565.95
Overall Total Points Gained 822 points 😃🙌🏼🤩🤝🏼😍👍🏼
* The Gap Up Opening today of 256 points will need to be closed sooner or later on for it might act as a vacuum created space to be filled in.
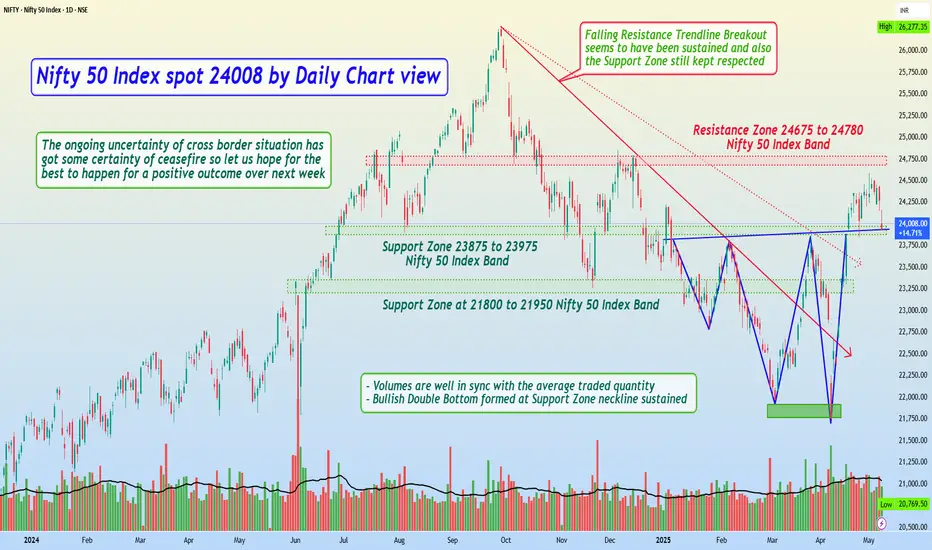
Nifty 50 Index spot 24008 by Daily Chart viewNifty 50 Index spot 24008 by Daily Chart view
- Resistance Zone 24675 to 24780 Nifty 50 Index Band
- Nifty is at Support Zone 23875 to 23975 Nifty 50 Index Band
- *Nifty having sustained above the Support Zone is bound to a bounce back by the cross border mellowed down situation*
- *The ongoing uncertainty of cross border situation has got some certainty of ceasefire so let us hope for the best to happen for a positive outcome over next week*
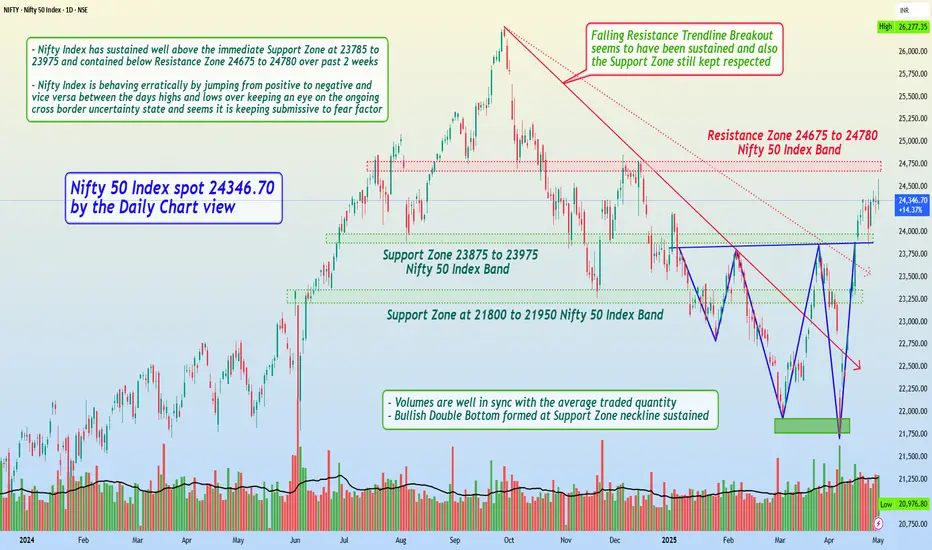
Nifty 50 Index spot 24346.70 by Daily Chart view - Weekly UpdateNifty 50 Index spot 24346.70 by the Daily Chart view
- Support Zone 23875 to 23975 Nifty 50 Index Band
- Resistance Zone 24675 to 24780 Nifty 50 Index Band
- Volumes are well in sync with the average traded quantity
- Nifty Index has sustained well above the immediate Support Zone at 23785 to 23975 and contained below Resistance Zone 24675 to 24780 over past 2 weeks
- Nifty Index is behaving erratically by jumping from positive to negative and vice versa between the days highs and lows over keeping an eye on the ongoing cross border uncertainty state and seems it is keeping submissive to fear factor
- Let us hope for the best to happen for a positive outcome over the coming days/weeks and foresee Nifty 50 Index to gradually and steadily progress towards the current ATH 26277.35 for a New ATH, in line with the Bank Nifty Index strides
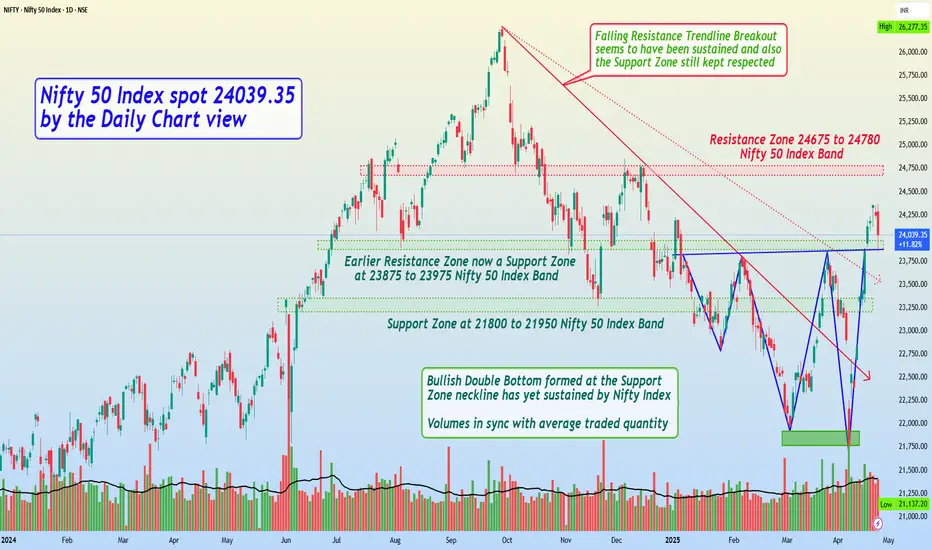
Nifty 50 Index spot 24039.35 by Daily Chart view - Weekly UpdateNifty 50 Index spot 24039.35 by the Daily Chart view - Weekly Update
- Resistance Zone 24675 to 24780 Nifty 50 Index Band
- Volumes are in good sync with the average traded quantity
- Both the Falling Resistance Trendlines have been decently maintained todate
- Earlier Resistance Zone now a Support Zone at 23875 to 23975 Nifty 50 Index Band
- Bullish Double Bottom formed at the Support Zone neckline has yet sustained by Nifty Index
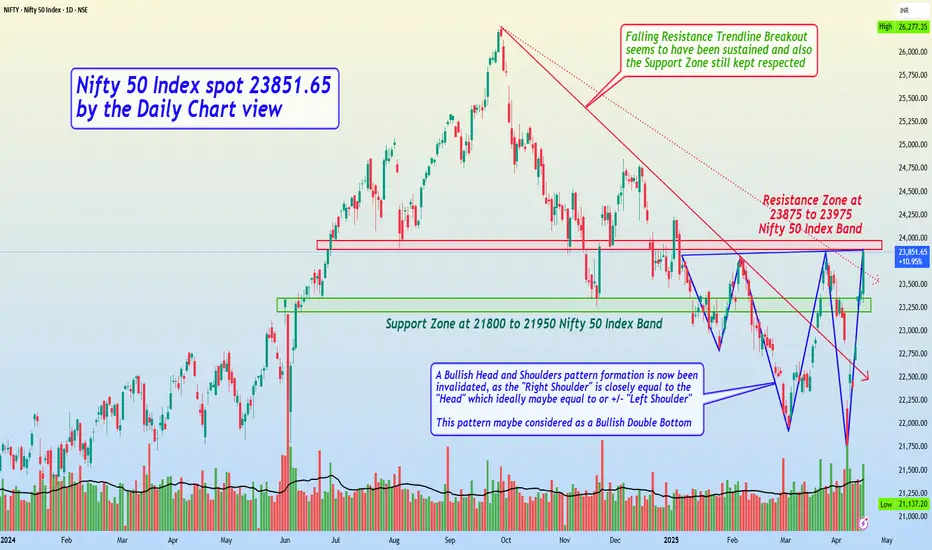
Nifty 50 Index spot 23851.65 by Daily Chart view - Weekly UpdateNifty 50 Index spot 23851.65 by the Daily Chart view - Weekly Update
* Support Zone at 21800 to 21950 Nifty 50 Index Band
* Resistance Zone at 23875 to 23975 Nifty 50 Index Band
* A Bullish Head and Shoulders pattern formation is now been invalidated, as the "Right Shoulder" is closely equal to the "Head" which ideally maybe equal to or +/- "Left Shoulder". This pattern maybe considered as a Bullish Double Bottom
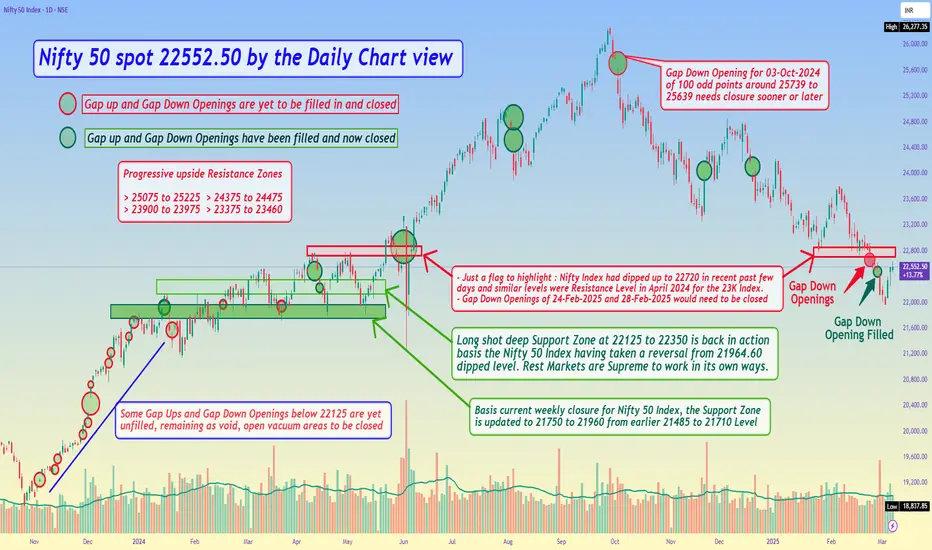
Nifty 50 spot 22552.50 by the Daily Chart view - Weekly Update*Nifty 50 spot 22552.50 by the Daily Chart view - Weekly Update*
- Gap Down Opening of 28th February, 2025 is now filled and has been closed
- Basis current weekly closure for Nifty 50 Index, the Support Zone is updated to 21750 to 21960 from earlier 21485 to 21710 Level
- Long shot deep Support Zone at 22125 to 22350 is back in action basis the Nifty 50 Index having taken a reversal from 21964.60 dipped level.
- Rest Markets are Supreme and work in their own ways. We can at most anticipate, expect and look forward for the best to happen by our assumptions
Nifty 50 Index 22124.70 by Daily Chart view: Different ViewpointNifty 50 Index 22124.70 by the Daily Chart view - Different Viewpoint
A different point of view for the Nifty 50 Index Technical Chart Setup Analysis. This is solely and purely my personal perspective for the Bearish Head & Shoulders pattern's. I will be happy to welcome and get your fine line pointers for the improvement on the Technical Analysis for this Chart Setup. Thank you in advance to One and All.
The 1st H&S Bottom is broken down and now need to look forward, if ..... Nifty 50 Index touches the 2nd H&S Bottom or takes an early reversal ..... Hope for the best to happen and keeping fingers crossed. God Bless All.

Nifty 50 spot 22795.90 by the Daily Chart viewNifty 50 spot 22795.90 by the Daily Chart view
- Nifty 50 Index 22775 to 22950 Support Band is yet sustained
- Long shot deep Support Zone seen at 22125 to 22350 which for now seems bit (un)likely by current technical chart status setup
- Just a flag to highlight : Nifty Index had dipped up to 22720 in recent past few days and similar levels was Resistance Level in April 2024 for 23K Index target
- Few of the Gap Ups and Gap Down openings, yet are remaining to get closed and filled in below the Old Long Shot Support Zone at 22125 to 22350 for Nifty Index levels

Nifty 50 spot 22929.25 by the Daily Chart viewNifty 50 spot 22929.25 by the Daily Chart view
- Just an FYI to note, for the current status of the Nifty 50 Index Daily Closure
- Nifty 50 Index 22775 to 22950 Support Band is yet sustained and nothing more to quote

Nifty 50 spot 23482.15 by the Daily Chart viewNifty 50 spot 23482.15 by the Daily Chart view
- Nifty 50 Index 22775 to 22950 Support Band is yet sustained
- Resistance Zone 23375 to 23460 to turn in as a probable Support Zone

Nifty 50 spot 23507.50 by the Daily Chart view*Just an FYI to share on the Nifty 50 Index Chart shared last week*
*Nifty 50 spot 23507.50 by the Daily Chart view*
- Nifty 50 Index 22775 to 22950 Support Zone has been sustained by Daily upwards closure above it
