Nifty 50 Price Structure Analysis [29/12/2025: Monday]Top-Down Nifty 50 Price Structure Analysis for 29th of December 2025. The day is Monday.
(1) Monthly Time Frame:
The candle is a red paper umbrella or a hanging man. Also, the candle is inside the previous month's candle. The long-term trend is bullish, but the short-term trend is indecisive. Major resistance is 26200. Minor support is 26000. Major support is 25800. The view is indecision.
(2) Weekly Time Frame:
Nifty has successfully wasted 10 weeks in the same range (25700 - 26300). A 600-point range-bound consolidation is painful for directional traders. It is a good market for non-directional traders. Presently, the candle is a red gravestone doji. There is huge selling pressure in the zone of 26200. Major resistance is 26150. Take no bullish trades until price forms a higher highs and higher lows structure above the level 26150. Every up move should be doubted. Level 26000 is a weak support. Price sustaining below the level 26000 can pull the price down to the level 25900. The view is indecision to bearish.
(3) Daily Time Frame:
Structurally, the bulls are tired. In the daily time frame, the price is forming a complex triple top or head and shoulder (H&S) pattern. The price got multiple rejections from the levels - 26200, 26150, and 26100. Every up move should be doubted. Do not think of taking bullish trades unless the price forms a higher highs and higher lows structure above the level 26150. Weak support is 26000. If level 26000 is decisively broken, then there is a higher chance of the price reaching down to level 25900. Additionally, if level 25900 is decisively broken, then level 25800 would be a high probability target. The view is bearish.
(4) 30-Minute Time Frame:
There is a clear sign of weakness. The major resistance zone is (26150 - 26100). Weak support is 26000. Major support is at level 25900. There are multiple unfilled gaps below the level 26000. Take no bullish trades unless the price decisively starts to trade above level 26150. Initiate bearish trade the moment level 26000 is broken. The view is bearish.
Bullish Scenario Set-Up:
(i) Price sustains above the opening price.
(ii) Price starts to decisively sustain above the level 26150.
Bearish Scenario Set-Up:
(i) Price sustains below the opening price.
(ii) Price starts to decisively sustain below the level 26000.
(iii) If level 26000 is broken, then level 25900 will be a high probability target.
(iv) If level 25900 is also broken, then level 25800 will be a high probability target.
No Trading Zone (NTZ): (26150 - 26000)
Event: No expiry. But the day after is the Nifty 50 monthly expiry.
Summary of the Trading Plan (Hypothesis and Insights):
(i) Monthly TF bias is indecision.
(ii) Weekly TF bias is indecision to bearish.
(iii) Daily TF bias is bearish.
(iv) 30-Minute TF bias is bearish.
(v) Establish intraday bias with respect to the opening price.
(vi) The market is in a complex range-bound consolidation for 10 weeks. Thus, market structure is cracked, non-directional, and indecisive.
(vii) Bulls are tired while bears are slowly gaining strength. Technical patterns like complex triple top and head and shoulder (H&S) are visible.
(viii) Every up move should be doubted. Presently, a bearish bias is the path of least resistance for the market.
(ix) Think of bullish trades only when the price sustains above level 26150.
(x) Initiate bearish trades when level 26000 is decisively broken. Level 25900 is a high probability target.
(xi) If level 25900 is also broken, then level 25800 is a high probability target.
(xii) Major resistance (supply) zone: (26150 - 26100).
(xiii) Major support (demand) zone: (25850 - 25800).
(xiv) No Trading Zone (NTZ): (26150 - 26000).
(xv) Monthly expiry is near. Also, the quarter (the 3rd quarter of the financial year) is ending. Thus, we can expect major price anomalies and chaos.
(xvi) Trade only when bullish/ bearish conditions are fulfilled. Remember, not trading is an extension of the trading activity.
NOTE:
"Mark your points. Trade your points. Price is God. Anything can happen in the markets. Therefore, trade what you see, not what you believe."
Happy Trading!
Nifty50trend

Nifty50 analysis(3/12/2025).
CPR: Narrow + decending cpr: trending day.
FII: -3,642.30 Sold
DII: 4,645.94 bought.
Highest OI:too soon to tell.
Resistance: nil
Support :nil
conclusion:
My pov:
1.Today market can be trending mostly bearish side .
2.techinical support at 25950, if it breaks and sustain in day candle then bearish trend can be expected.then support only at 25500.
3.any resistance in cpr can be a confirmed. then trade
psychology fact:
Maybe Trading can’t be done, but I’m going to do whatever I can to see if I’m one of the few who can do it.
note:
8moving average ling is blue colour.
20moving average line is green colour
50moving average line is red colour.
200moving average line is black colour.
cpr is for trend analysis.
MA line is for support and resistance.
Disclaimer:
Iam not Sebi registered so i started this as a hobby, please do your own analysis, any profit/loss you gained is not my concern. I can be wrong please do not take it seriously thank you.

Nifty50 Today(1/12/2025) analysis
CPR: Narrow + outside cpr: Sideways to bearish.
FII: -3,795.72 Sold
DII: 4,148.48 bought.
Highest OI:
Resistance:26300,26400.
Support :26000.
conclusion:
My pov:
1.Market opens with gap up but cpr shows a bearish view in techinical analysis ,there is two ways to confirm it if breakes ATH and sustains in 1hr candle and if it breaks and sustain above R1,also check volume . then go bullish.
2.market can be sideways to bearish.
3.confirmation is the key and wait for clarity.
psychology fact : most of the time, not doing anything is the best trading exercise you can ever do.
note:
8moving average ling is blue colour.
20moving average line is green colour
50moving average line is red colour.
200moving average line is black colour.
cpr is for trend analysis.
MA line is for support and resistance.
Disclaimer:
Iam not Sebi registered so i started this as a hobby, please do your own analysis, any profit/loss you gained is not my concern. I can be wrong please do not take it seriously thank you.

Today(18/11/2025),nifty50 analysis(expiry).
CPR: Narrow + ascending cpr: trending
FII: 442.17 bought
DII: 1465.86 bought.
Highest OI:
Resistance: 26000, 26100,26200.
Support :25900, 25800,25700
conclusion:
My pov:
1.Today if market breaks recent high 26100 can be bullish, if not it will take a clear support and then go bullish, also today expiry so buyers should be careful.
2.Fii and Dii both buying.
3.Narrow cpr, expiry day can this day be trending but recent ath is near. lets wait and watch.
psychology fact : trading is 95% waiting and 5% execution.
note:
8moving average ling is blue colour.
20moving average line is green colour
50moving average line is red colour.
200moving average line is black colour.
cpr is for trend analysis.
MA line is for support and resistance.
Disclaimer:
Iam not Sebi registered so i started this as a hobby, please do your own analysis, any profit/loss you gained is not my concern. I can be wrong please do not take it seriously thank you.

Today(17/11/2025),nifty50 analysis.
CPR: slightly wide + overlapping lower cpr: sideways to bearish.
FII: -4,968.22 sold.
DII: 8,461.47 bought.
Highest OI:
Resistance: 26000, 26100
Support : 25800,25700
conclusion:
My pov: market is neutral to bearish, If and only 26100 is closed and crossed i view as bullish trend lets wait and watch. why because FII keep selling, That the reason i cant clearly think market is in bullish,
psychology fact : Trading is a profession where you have to think freely and creatively.
note:
8moving average ling is blue colour.
20moving average line is green colour
50moving average line is red colour.
200moving average line is black colour.
cpr is for trend analysis.
MA line is for support and resistance.
Disclaimer:
Iam not Sebi registered so i started this as a hobby, please do your own analysis, any profit/loss you gained is not my concern. I can be wrong please do not take it seriously thank you.

Nifty50 analysis today(12/11/2025)
CPR: wide+ascending cpr: consolidation.
FII: -803.22sold.
DII: 2,188.47 bought.
Highest OI: too soon to say levels, because yesterday only expiry.
Resistance:
Support :
Possibilities:
1hour timeframe.
1.Today is wide candle there is high chance of consolidation.
2.if and only it takes support at any cpr levels , can move up.
Events.
1.Bihar elections result on Friday.
conclusion:
My pov: market is bullish but the cpr is wide . i will just watch the market.
note:
8moving average ling is blue colour.
20moving average line is green colour
50moving average line is red colour.
200moving average line is black colour.
cpr is for trend analysis.
MA line is for support and resistance.
Disclaimer:
Iam not Sebi registered so i started this as a hobby, please do your own analysis, any profit/loss you gained is not my concern. I can be wrong please do not take it seriously thank you.

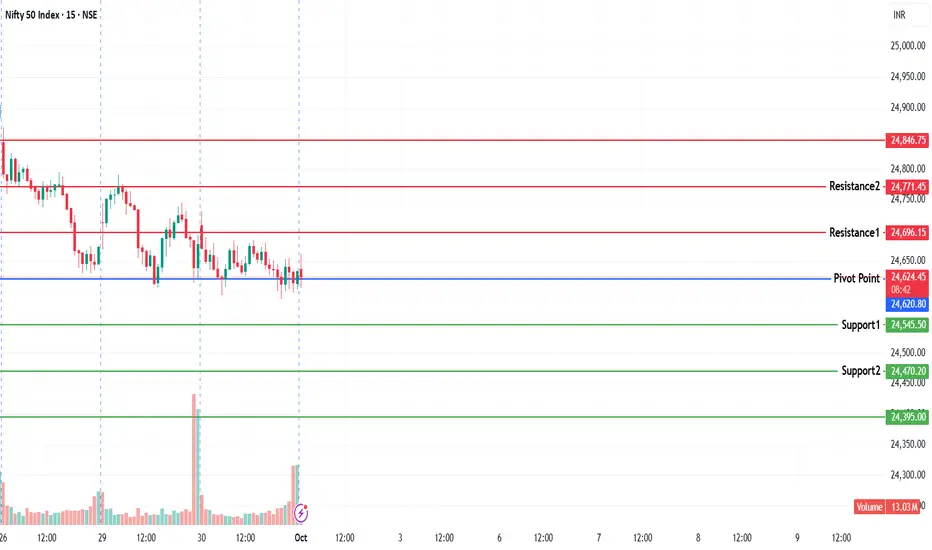
NIFTY KEY LEVELS FOR 01.10.2025NIFTY KEY LEVELS FOR 01.10.2025
RTF: 3 Minutes
If the candle stays above the pivot point, it is considered a bullish bias; if it remains below, it indicates a bearish bias. Price may reverse near Resistance 1 or Support 1. If it moves further, the next potential reversal zone is near Resistance 2 or Support 2. If these levels are also broken, we can expect the trend.
When a support or resistance level is broken, it often reverses its role; a broken resistance becomes the new support, and a broken support becomes the new resistance.
If the range(R2-S2) is narrow, the market may become volatile or trend strongly. If the range is wide, the market is more likely to remain sideways
please like and share my idea if you find it helpful
📢 Disclaimer
I am not a SEBI-registered financial adviser.
The information, views, and ideas shared here are purely for educational and informational purposes only. They are not intended as investment advice or a recommendation to buy, sell, or hold any financial instruments.
Please consult with your SEBI-registered financial advisor before making any trading or investment decisions.
Trading and investing in the stock market involves risk, and you should do your own research and analysis. You are solely responsible for any decisions made based on this research.
NIFTY50Nifty could 📉 fall to below level 24850 within 18th July 2025 or to the white line marked on the chart.
Even there's a high possibility that 24850 could break and it could even fall 📉 to below red dashed line 24370 within last week of july 2025.
Disclaimer:
It's a personal view not a financial advice and I assume no responsibility and liability whatever outcome arises.

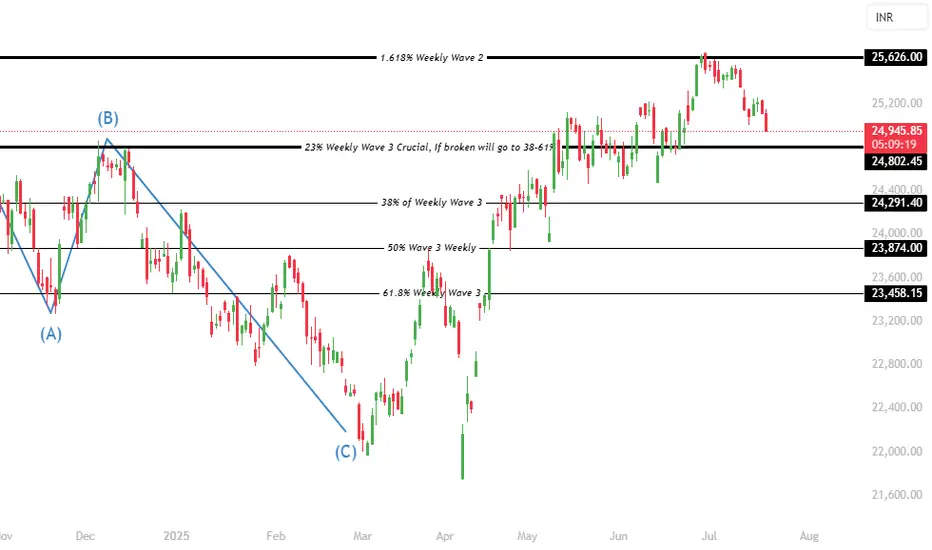
Nifty 50 Trend Analysis A detailed wave analysis in larger times frames indicates that nifty is beginning to trigger a sharp or moderate momentum deep correction. The correction & downtrend can last upto 23874 & 23458 potentially. In a downtrend, institutions will sell on every rise, hence its not the right time to make new investments directly in the stocks. Currently nifty is trading at 25073 and this swing momentum can go upto 24802 without reversals, and 24802 will play a crucial role but since the wave 3 has completed its maximum levels we need to brace for 23874 & 23458.
NIFTY ViewNIFTY chart analysis showing general view for coming weeks.
Chart shows its in bearish mode untill it breakout channel. It has more chances to go down before breaking that.

Deathcrossover is evident in next coming week trading sessionsDeathcrossover between SMA 50 and SMA 200 is inevitable in the next coming week. Caution to all traders

NIFTY50 Head & Shoulder Pattern in Weekly Charts₹₹Nifty50 making Head & Shoulder in Weekly Charts with Price range of 3000 points(23266-26277). If Chart Pattern play-out perfectly then Target price range will be 2500-3000 points till 20288 levels.
Nifty50 also have a gap on 20288 levels bcoz of Election Results of 4 States on Dec 3,2023 after that rally started. Now Nifty50 can fill this gap if Chart Pattern play-out perfectly.
I will wait for Nifty50 to break down 23266-22777 levels zone & closing below 22777 levels. If Nifty50 close below 22777 levels then Short Nifty50 for Targets of 22122, 21777, 21288, 20777 & 20288 with Stop Loss of 23444.
But this Pattern will fail above levels of 24555.
Most Important we have to carefully watch RELIANCE bcoz it's already at 52 week lows & At Parallel Channel Support in Monthly Charts. If Reliance also give breakdown of channel then it will be easy for Nifty50 to reach all targets. Similarly HDFC BANK at upper Resistance of Parallel Channel in Monthly Charts.

Nifty 50 spot 24556.00 by Hourly Chart viewNifty 50 spot 24556.00 by Hourly Chart view
- Intermediate Support Zone 24475 to 24525
- Resistance Zone 24750 to 24885 Price Band may become a Support Zone
- The Next Support Zone seen at 24300 to 24375 Price Band acting as H&S neckline
- Resistance Zone 24750 to 24885 Price Band needs to be crossed, closure sustained above it for continued upwards bullish transition

Nifty 50 spot 24672.50 by Hourly Chart viewNifty 50 spot 24672.50 by Hourly Chart view
- Resistance Zone 24750 to 24875 Price Band
- Support Zone 24300 to 24375 Price acting H&S neckline

Nifty 50 spot 24275.25 by Hourly Chart viewNifty 50 spot 24275.25 by Hourly Chart view
- Bullish Rounding Bottom plus Tiny Cup & Handle followed by another Rounding Bottom awaiting completion at 24340 of Resistance Zone midway

Nifty 50 spot 24000.45 by Daily Chart viewNifty 50 spot 24000.45 by Daily Chart view
Update to the last review for Nifty 50 Index Chart

Nifty 50 spot 24339.00 by Daily Chart viewNifty 50 spot 24339.00 by Daily Chart view
- Most probable Resistance Zone seen at 24750 to 24875 for Nifty 50 Index
- Gap Down Opening of 03-October-2024 got Filled Up and has been Closed
- Gap Down Opening of 05-Aug-2024 of 336 points got filled in by downfall of Nifty 50
- 24050 to 24175 decent Support Zone and it seems Nifty reversed tad low from 24073.90
- Nifty 50 Index traversed inside Bullish Rising Price Channel till the end of September 2024
- Currently in Bearish Falling Price Channel but seems taking reversal at Support Zone 24050 to 24175 anticipating upside

Nifty 50 spot 24685 by the Daily Chart viewsNifty 50 spot 24685 by the Daily Chart views
-Gap Down Opening Fill-Up for 05-August-2024 seen by all probably is seen on the Nifty 50 Daily Chart. Gap Down Opening was from 24686 to 24350
- Nifty Index traversed thru Back to Back Parallel Rising Price Channel but currently it seems like a decent Resistance Zone at 25075 to 25225 with the nearest Support Zone seen at 24375 to 24475

NIFTY50 - TIME FOR A SHORT TRADE?Symbol - NIFTY50
NIFTY50 is currently trading at 25905
I'm seeing a trading opportunity on sell side.
Shorting NIFTY50 Futures at CMP 25905
I will be adding more position if 26100 comes & will hold with SL 26230
Targets I'm expecting are 25370 - 25010 & below.
Disclaimer - Do not consider this as a buy/sell recommendation. I'm sharing my analysis & my trading position. You can track it for educational purposes. Thanks!

Nifty 50 spot 25014.60 by Daily Chart views*Nifty 50 spot 25014.60 by Daily Chart views*
- 24750 to 24875 may be probable Support Zone
- Gap Down openings will need to be filled in sooner or later on
- Nifty 50 Index traversing in Bullish Rising Price Channel currently near Probable Support Zone for upside reversal anticipated

Nifty50 weekly Bullish Engulfing can we follow or not????Nifty50 in 1st week Bearish Engulfing but not closed below 24811 & bounce back. In 2nd week Bullish Engulfing but having Trend line Resistance with Negative Divergences on RSI. Upside move will be limited till rate cuts but levels can’t be decided for upside. Now trade with Nifty trend & proper risk management. Happy Trading & thank you.

Nifty 50 negative divergence on RSI on weekly chart##Nifty50 showing negative divergence on RSI on weekly charts. We can see some correction or time based consolidation in Nifty50.
Nifty50 levels for selling will be below 24811 on daily basis for target of 24444 & 24011 with Stop-loss of 25025.
Trade with risk management properly. Thank you

Nifty50 Support And Resistance 8-Aug-2024Nifty50 Support And Resistance 8-Aug-2024
Please find Above simple resistance and support
𝐃𝐈𝐒𝐂𝐋𝐀𝐈𝐌𝐄𝐑: I'm not 𝐒𝐄𝐁𝐈 Registered.
