Market Gap UP 100% - Nifty 50, Nifty Bank and SensexSir/Mam,
Tomorrow market will be gap up and after that it will fill their gap of each (check subject header's Indices) so I suggest buy same strike price CE and PE and sell it on profit. Better safe idea of earning. Tomorrow market is very interesting for those who already taken PE and CE today.
Take care all of you for today.
Hope for the best for tomorrow.
Niftybankanalysis

NIFTYBANK ROUNDING BOTTOM BREAKOUT RETESTNifyybank giving rounding bottom breakout
retest level 57600
weekly support 57600-57000
weekly resistance 58600 ATH
need to watch breakout sustaining or not
FOR EDUCATIONAL PURPOSE

[INTRADAY] #BANKNIFTY PE & CE Levels(03/09/2025)Bank Nifty is expected to open with a gap down today, signaling weakness in the overall sentiment. The index has been consolidating within a narrow range, but pressure at higher levels continues to weigh on the price action.
On the upside, a reversal buying opportunity could emerge if Bank Nifty sustains above 53,550–53,600. In such a case, the index may move toward 53,750, 53,850, and 53,950+. A stronger breakout above 54,050–54,100 would further extend the rally toward 54,250, 54,350, and 54,450+.
On the downside, if the index remains under pressure and slips below 53,450–53,400, then fresh selling may drag it lower toward 53,250, 53,150, and 53,050. A breakdown below 53,050 could open the gates for 52,900–52,800 levels.
Overall, today’s market is likely to start with a gap down opening, keeping the momentum tilted to the bearish side unless the index manages to hold above key reversal levels.

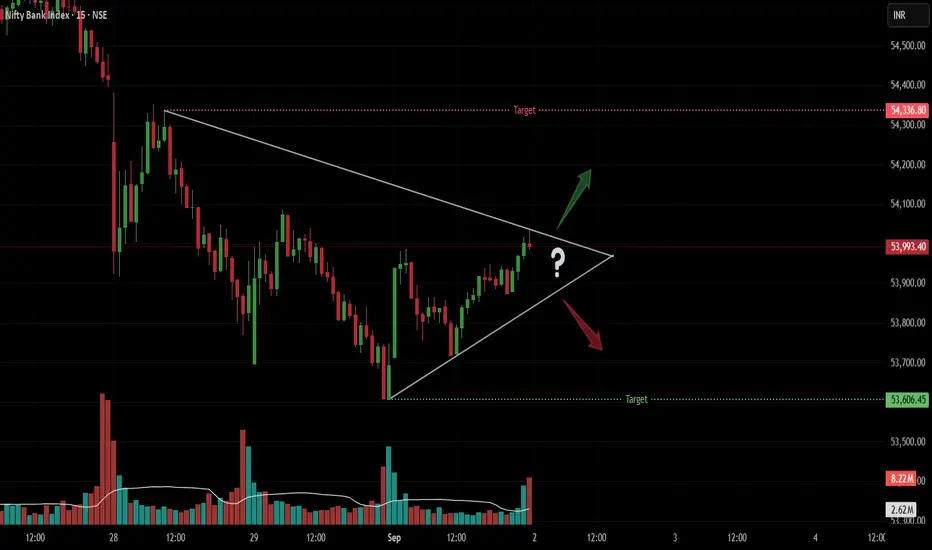
Intraday Alert: Nifty Bank Symmetrical Triangle! Nifty Bank is squeezing into a tight Symmetrical Triangle on the 15-min chart! Expect a strong intraday breakout soon.
Pattern: Symmetrical Triangle
Timeframe: 15 Minutes
Strategy: WAIT for the breakout. No trades inside the pattern.
🟢 LONG above resistance
🎯 Target: 54300
❌ Stop: Below breakout candle
🔴 SHORT below support
🎯 Target: 53600
❌ Stop: Above breakdown candle
Patience pays!
⚠️ Disclaimer: This is NOT trading advice. This post is for educational purposes only. Trading is high risk. Please do your own research and consult a SEBI registered advisor before making any trade decisions.
💬 Boost if helpful! Follow for more! ✅
Bank nifty Futures- Consolidation ankNifty Futures (Index) daily
Technical analysis + sector (banking industry) fundamental overview + a learning summary for students.
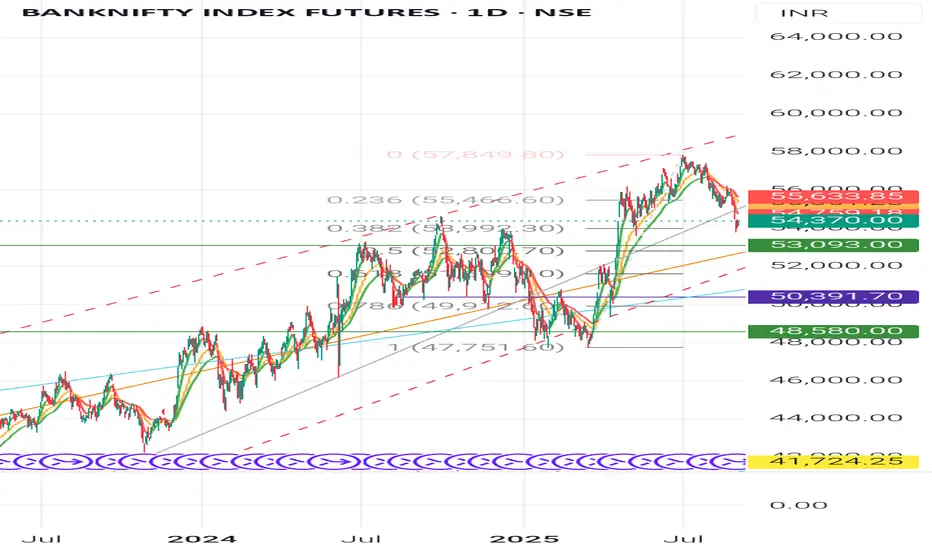
Technical Analysis (Daily Chart) Candlestick & Chart Pattern👉
Recent candles show selling pressure after the peak near 57,800 (upper trendline rejection).
Current candles look like lower highs + lower lows = possible descending channel formation.
The long wicks at support zones indicate buyers are defending near 52,800- 53,000.
Swing Analysis
Major swing high: 57,850
Swing low: 47,750
Retracement happening between 0.382 (53,992) and 0.236 (55,466) Fibonacci levels.
Pattern in Progress
Falling Wedge / Descending Channel forming- often bullish if breakout happens above resistance trendline.
👉If price breaks below 52,800, then deeper correction possible.
Key Levels
-Support
52,800 - 53,000 (critical Fib support)
50,400 - 50,500 (strong demand zone)
48,500 (swing support)
-Resistance
55,000 - 55,500 (Fib cluster + recent rejection)
57,800 (swing high, big breakout point)
60,000 psychological level
Entry Points-
For Long (Investors/Positional)
-Enter near 52,800- 53,000 with SL below 52,500.
Add more if it breaks and sustains above 55,500.
-For Short (Traders):
Below 52,800, short with target 50,400 - 48,500.
Keep SL near 53,600.
Industry Analysis (Banking Sector)
Indian banks are in a strong credit growth cycle (loan demand high, NPA ratios declining).
-RBI’s monetary policy easing in future may improve margins further.
-PSU Banks are gaining strength, but private banks (HDFC, ICICI, Kotak) still dominate.
-Key Fundamental Ratios (Peer Banks)
-ICICI Bank: RoE - 16%, NIM - 4.5%, GNPA <2%
-HDFC Bank: RoE - 15%, NIM - 4.1%, GNPA - 1.5%
-SBI: RoE - 14%, NIM - 3.6%, GNPA - 2.5%
👉 Overall, sector health is positive, but valuation of large banks is already at premium.
-Student Learnings
1. Chart Patterns:
Descending channel/falling wedge = watch for breakouts.
2. Candlestick Wicks:
Long lower shadows = hidden buying.
3. Swing + Fibonacci:
Key tool to identify retracement zones.
4. Support & Resistance:
Always mark levels - entry becomes safer.
5. Fundamentals in Sector Indices:
Index = basket - study sector & top-weight banks, not single balance sheet.
⚠️ Disclaimer
This analysis is for educational purposes only. It is not financial advice. Trading in derivatives (like BankNifty Futures) is highly risky and may lead to capital loss. Please consult your financial advisor before investing.
Follow👣 for more🚩
#BankNifty #StockMarketIndia #TechnicalAnalysis #CandlestickPatterns #SwingTrading #SupportAndResistance #InvestingBasics #BankingSector #StockMarketEducation #FinanceStudents #MarketAnalysis
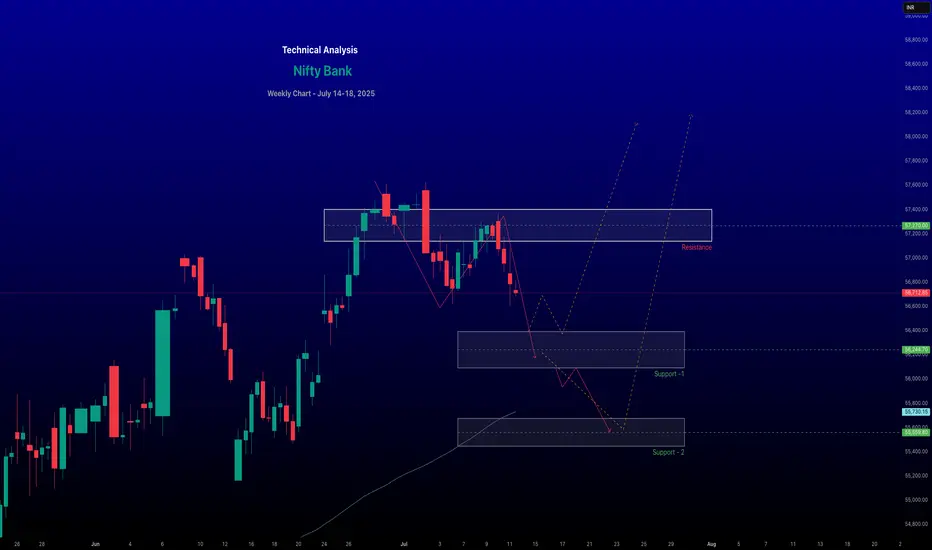
renderwithme | Bank Nifty Prediction for July 14–18, 2025
~~ Bank Nifty Current StatusClosing Price (July 11, 2025): ~~
The Bank Nifty index closed at 56,754.7, down 0.35% (201.3 points), reflecting selling pressure in key constituents like HDFC Bank (-1.16%), Canara Bank (-0.64%), and Bank of Baroda (-0.79%).
#Recent Trend:
The index has shown a bearish tilt, breaching the 20-day Exponential Moving Average (EMA) support, with a cautious market sentiment.
# Historical Context:
Despite the recent dip, Bank Nifty has a positive seasonality trend, with 11 out of 17 years showing positive returns in July.
~~ Technical Analysis ~~
# Support Levels:
Immediate support: 56,400–56,000 (key psychological and technical level).
Additional supports: 55,736 and 55,438.
Critical support: 55,000, a level noted as a potential rebound point if held.
# Resistance Levels:
Immediate resistance: 57,000–57,500 (significant open interest in call options at these strikes).
Higher resistance: 57,300–57,500, with a breakout above 57,200 potentially signaling a move toward 57,600–58,000.
Bank Nifty Prediction for July 14–18, 2025Bullish Scenario:A breakout above 57,200–57,300 could push the index toward 57,600–58,000, especially if banking heavyweights like ICICI Bank or SBI show strength.
Sustained trading above 57,000, supported by positive earnings or global cues, could reinforce the bullish trend.
Bearish Scenario:A break below 56,500 could trigger selling toward 56,000 or lower (55,540–55,000).
Negative earnings or renewed global uncertainties (e.g., trade tensions) could exacerbate declines.
Likely Range: The index is expected to trade between 56,500–57,500, with consolidation likely unless a clear breakout or breakdown occurs.
~~ Disclaimer --
This analysis is based on recent technical data and market sentiment from web sources. It is for informational purposes only and not financial advice. Trading involves high risks, and past performance does not guarantee future results. Always conduct your own research or consult a SEBI-registered advisor before trading.
#Boost and comment will be highly appreciated
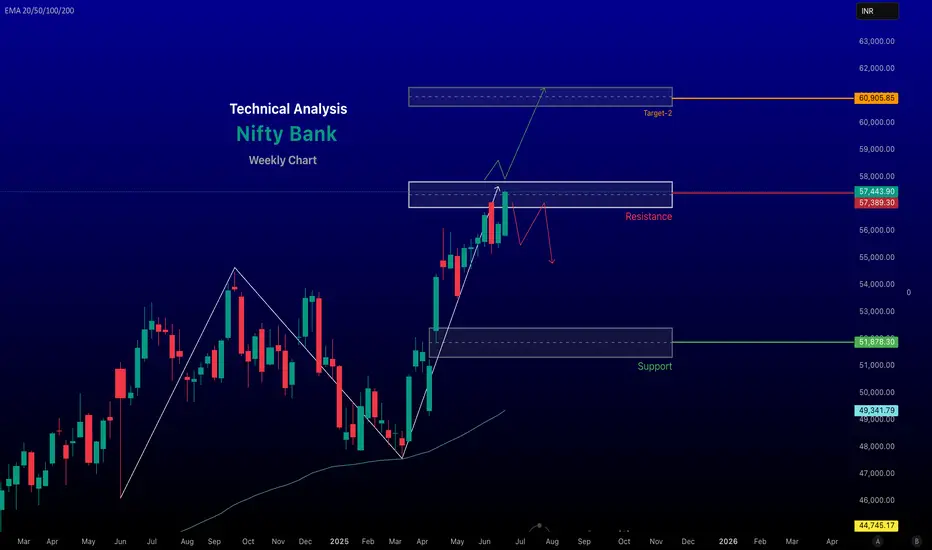
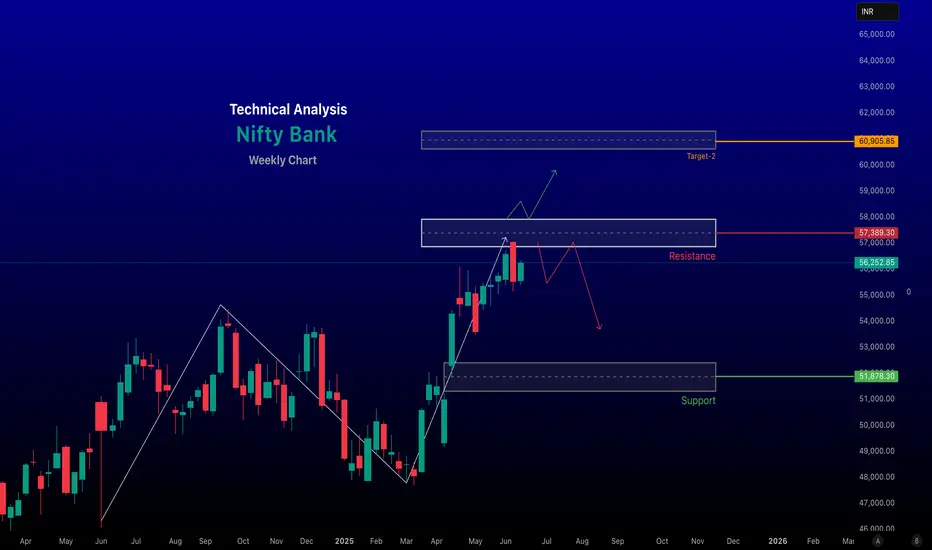
Bank Nifty Weekly Analysis for June 30, - 04, July - 2025The Bank Nifty index, as of June 28, 2025, shows a bullish outlook based on recent market data and technical analysis, though traders should remain cautious due to potential volatility and resistance levels. Here's a detailed analysis for today:
Market Performance and Sentiment
Recent Performance: The Nifty Bank index closed at 57,443.90 on June 27, 2025, with a gain of 237.20 points (+0.41%), indicating continued bullish momentum. The index has been trading near its 52-week high of 57,475.40, reflecting strong sectoral leadership. Posts on X suggest that Bank Nifty has outperformed the Nifty 50, which is 2.5% below its all-time high, with a target of 59,000.
Market Sentiment: Positive global cues, including a ceasefire between Israel and Iran, falling crude oil prices, and dovish signals from the U.S. Federal Reserve, have boosted risk appetite, supporting the banking sector's rally. Foreign Institutional Investors (FIIs) have been net buyers for four consecutive months, further fueling bullish sentiment. However, significant open interest (OI) buildup in the last two days suggests potential for abnormal volatility in the near term.
~~~ Technical Analysis ~~~
Current Levels and Trends: The index is closing at around 57,443.90, with a gain of 0.41%. The advance/decline ratio is positive at 8:4, indicating broader participation in the uptrend. The index is trading above key exponential moving averages (20-day, 50-day, and 200-day EMAs), confirming a strong upward trend on the weekly timeframe.
# Support and Resistance:
Support: Strong support is noted around 57,000, which has held well in recent sessions. A break below this could drag the index to 56,400–56,000. Additional support lies at 55,500, a critical level for maintaining bullish bias.
Resistance: Immediate resistance is at 57,500–57,800. A decisive break above 57,800 could push the index toward 58,000–58,400. Call options at 56,500 and 57,000 show significant open interest, reinforcing these as key resistance levels.
Technical Indicators: The Relative Strength Index (RSI) on the weekly timeframe is at 67.31, showing a reversal toward the upside, indicating strengthening momentum. However, a bearish divergence on the 4-hour chart remains unresolved, suggesting a potential correction toward 52,000 if the bullish structure weakens.
-- Bullish trend, next target 61,000 if we break and close above 57,800 on weekly timeframe --
Chart for reference.
- Disclaimer --
This analysis is based on recent technical data and market sentiment from web sources. It is for informational purposes only and not financial advice. Trading involves high risks, and past performance does not guarantee future results. Always conduct your own research or consult a SEBI-registered advisor before trading.
#Boost and comment will be highly appreciated
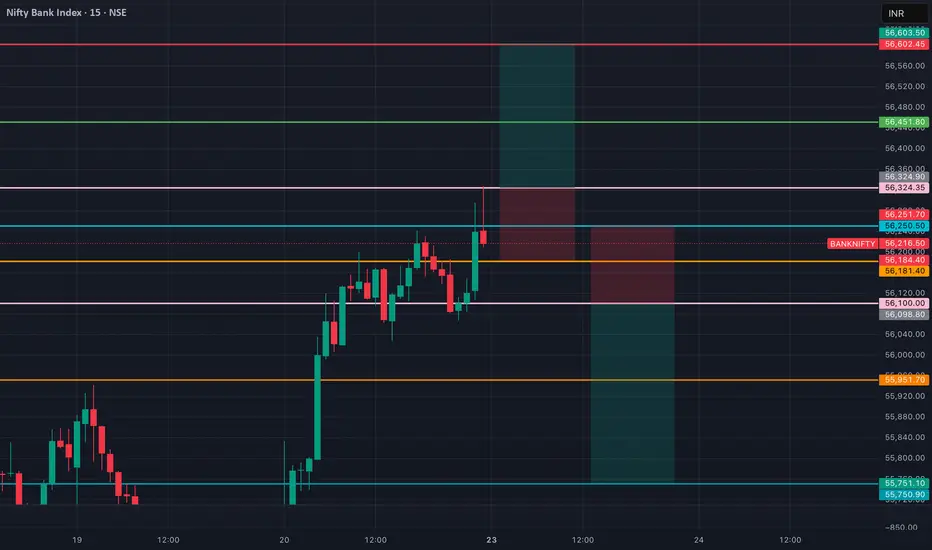
BANK NIFTY Levels for Intraday (Educational Purpose) 23/05/2025 📈 BankNifty Intraday Trade Setup – 23/06/2025 (Monday)
🕒 Timeframe: 1-Min Chart
📊 Market Sentiment: Cautiously Bullish | High Volatility Expected
🔼 Buy Above: 56,320 (sustained breakout)
🎯 Target 1: 56,420
🎯 Target 2: 56,550
🛑 Stop Loss: 56,180
⚠️ Confirm with strong volume and EMA crossover
🔽 Sell Below: 56,050 (breakdown below demand zone)
🎯 Target 1: 55,920
🎯 Target 2: 55,780
🛑 Stop Loss: 56,200
⚠️ Entry valid only after 5-min candle closes below 56,050
📍 Key Levels to Watch:
🔹 Resistance: 56,300 – 56,400
🔹 Support: 56,050 – 55,900
🔹 Demand Zone: 55,700 – 55,600
🔹 Supply Zone: 56,400 – 56,550
📌 Pro Tips for Monday:
✅ Track global cues (esp. geopolitical tensions)
✅ Use VWAP and RSI for extra confirmation
✅ No overtrading on breakout traps
Bank Nifty Weekly Analysis for June 24 –June 28 June , 2025~~ Technical Outlook ~~
Current Trend: The Nifty Bank Index is in a positive trend, with a closing value of 56,252.85 on June 20, 2025, reflecting a 1.22% gain. The index has entered a bullish phase in the last trading session, supported by strong buying in key constituents like HDFC Bank (+1.44%), ICICI Bank (+1.07%), Canara Bank (+2.25%), and Federal Bank (+1.62%).
#Support and Resistance Levels:
Support: Immediate support lies at 55,781, followed by 55,308 and 54,726. A critical long-term support is around 51,500; a break below 51,000 could signal weakness.
Resistance: Resistance is seen at 56,900, with potential upside targets at 56,600, 57,000, and a new all-time high around 57,267–57,500 if momentum sustains. the Long-term Target is around 60,500
!! Market Sentiment
Domestic and Institutional Activity: Domestic Institutional Investors (DIIs) have been strong buyers, purchasing ₹8,207 crore on June 18, while Foreign Institutional Investors (FIIs) were net buyers with ₹1,482 crore, indicating robust domestic support.
Sectoral Performance: The banking sector led gains, with 11 of 12 constituents in the green on June 20. Private banks like HDFC and ICICI Bank limited downside pressure, while public sector banks (PSU Banks) showed relative weakness, with the Nifty PSU Bank Index down 0.9% on June 16.
# Due to geopolitical tension, the market may be sideways or volatile.
-- Disclaimer --
This analysis is based on recent technical data and market sentiment from web sources. It is for informational purposes only and not financial advice. Trading involves high risks, and past performance does not guarantee future results. Always conduct your own research or consult a SEBI-registered advisor before trading.
#Boost and comment will be highly appreciated
Selling Dominates Nifty Bank: Technical Outlook for Key Stocks◉ Nifty Bank Technical Outlook NSE:BANKNIFTY
● The index has broken below its trendline support and is currently testing its immediate support zone between 48,300 and 48,600.
● If selling pressure persists, the index may plummet another 5% to find support around the 46,000 level.
◉ Key Constituents' Technical Standings
Let's dive into the technical analysis of the top Bank Nifty constituents to gauge their current standings and potential future movements.
1. HDFC Bank (Weightage - 28.11%) NSE:HDFCBANK
● As the leading component, HDFC Bank is poised to exert downward pressure on the overall index.
● The stock has broken below its trendline support and has been falling continuously for the last 6 trading sessions.
● Support level is expected somewhere between 1,600 - 1,610 level which is around 3.4% below from the current level.
2. ICICI Bank (Weightage - 24.98%) NSE:ICICIBANK
● The stock has also fallen below its trendline support and is currently hovering just above its immediate support zone.
● If this support is breached, a significant correction could drive the price down to around 1,150.
3. Kotak Mahindra Bank (Weightage - 8.80%) NSE:KOTAKBANK
● The stock has been consolidating within a range for almost 4 years.
● Recent chart patterns suggest the price may test its support zone again, around 7.7% below the current level.
4. Axis Bank (Weightage - 8.54%) NSE:AXISBANK
● Axis Bank's chart shows a bearish pattern, similar to HDFC Bank's, and is likely to experience a fall of around 6%.
5. State Bank of India (Weightage - 8.45%) NSE:SBIN
● The stock is currently positioned just above its immediate support level, suggesting a strong potential for a rebound from this point.

BankNifty NR7 on Monthly charts + Covid low Trendline ##BankNifty making NR7 on monthly charts of 4000 points 49500-53500 levels also it trading near Trend line of Covid Lows this time BankNifty may give breakdown of this TrendLine. BankNifty Components like HDFC BANK & ICICI BANK made a Shooting Star on Monthly Charts so we have to watch these two how they move with Q3 Results onboards in coming days. Q3 Results will be more important for BankNifty to give Range Breakout.
I am waiting for breakdown of Trend line & 50055-49555 levels then only I will make short position.
Target for Downtrend will be T1- 48555, T2- 46077, T3- 44144, T4- 41855, T5- 39444, T6- 37711, T7- 35655, T8- 33933, T9- 32622 with StopLoss 53355 & trailing with target achieving.
Thank You & Happy Trading

Niftybank moments for option trading 19/nov/2024Niftybank moments for option trading 19/nov/2024
follow us for more updates information.
WELCOME TO ARROWINDEX
We're dedicated to providing you the best of Finance stock market , with a focus on dependability and Investment. We're working to turn our passion for Finance stock market into a booming online.We analyze Live Market and try to Provide learning information Content. All the Live Market views and charts .We hope you enjoy our Finance stock market as much as we enjoy offering them to you.Support and offering
Effective online education modules for all segments of traders
Customized portfolio tracker Online research & trading guidance
Entry and Exit support for:-
Intraday trading,Swing trading,Scalping,Position trading
Future & Delivery trading
Technical analysis
Fundamentals analysis
Fii & Dii data and reports

Banknifty level for option trading 15/Nov/2024Arrowindex 15/Nov/2024
Banknifty level for option trading
follow for more updates and information.

BANKNIFTY Intraday Trade Setup 27 Sep 2024BANKNIFTY Intraday Trade Setup 27 Sep 2024
Bullish-Above 54500
Invalid-Below 54390
T- 54925
Bearish-Below 54000
Invalid-Above 54110
T- 53500
BANKNIFTY has closed on a positive note with 0.51% gain today. We will follow buy on dips approach till index is closing above PDL. If a daily candle closes below PDL then chances of bulls giving up will be high. Bearish sentiment likely to kick in when index will close below PDL in daily TF. 54500 and 54000 will be tomorrow's range.
Coming to Friday's trade setup, if index opens flat and a 15 Min candle closes above 54500 then we will long for the target of 54925.
For selling we need a 15 min candle close below 54000. T- 53500.
In case of a big gap up/down, wait till 10 o'clock and mark the high and low of the trading range (5MIN). Trade on this range breakout.
==========
I am Not SEBI Registered
This is my personal analysis for my personal trading. Kindly consult your financial advisor before taking any actions based on this.

BANKNIFTY - 16TH SEPTEMBER NSE:BANKNIFTY ANALYSIS FOR TOMORROW 🔺
❇️ IMPORTANT LEVELS 🚀
❇️ Support: 51750-51570-51270
❇️ Resistance : 52090-52222-52400.
👉🏻 PURPLE LINE : 51965 is a key level, above buying, Below selling.
👉🏻 @thetradeforecast 🇮🇳

BANKNIFTY IMPORTANT LEVELS FOR TOMORROW, 3RD SEPTEMBER NSE:BANKNIFTY ANALYSIS FOR TOMORROW 🔺
❇️ IMPORTANT LEVELS 🚀
❇️ Support: 51350-51250-51150- 51040.
❇️ Resistance : 51460-51570-51670-51770.
👉🏻 PURPLE LINE : 51410 is a key level, above buying, Below selling.
👉🏻 @thetradeforecast 🇮🇳

BANKNIFTY IMPORTANT LEVELS FOR TOMORROW, 2ND SEPTEMBER NSE:BANKNIFTY ANALYSIS FOR TOMORROW 🔺
❇️ IMPORTANT LEVELS 🚀
❇️ Support: 51360-51470-51550-51740 .
❇️ Resistance : 51169-50969-50790-50588.
👉🏻 PURPLE LINE : 51260 is a key level, above buying, Below selling.
👉🏻 @thetradeforecast 🇮🇳

BANKNIFTY Intraday Trade Setup For 2 Sep 2024BANKNIFTY Intraday Trade Setup For 2 Sep 2024
Bullish-Above 51470
Invalid-Below 51360
T- 51850
Bearish-Below 51250
Invalid-Above 51360
T- 50770
BANKNIFTY has closed on a slight bullish note with 0.82% gain today. After breakout of 50800 on 22 Aug , it was discussed that index is approaching 52k in the coming days. We have reached 51466 and rest can be gained this week. Overall index is volatile and sideways. Directional move with momentum is still void. 51470 and 51250 are intra levels for tomorrow.
Coming to Monday's trade setup, if index opens flat and a 15 Min candle closes above 51470 then we will long for the target of 51850.
For selling we need a 15 Min candle close below 51250. T- 50770.
In case of a big gap up/down, wait till 10 o'clock and mark the high and low of the trading range (5MIN). Trade on this range breakout.
==========
I am Not SEBI Registered
This is my personal analysis for my personal trading. Kindly consult your financial advisor before taking any actions based on this.

BANKNIFTY IMPORTANT LEVELS FOR TOMORROW, 29TH AUGUST NSE:BANKNIFTY ANALYSIS FOR TOMORROW 🔺
❇️ IMPORTANT LEVELS 🚀
❇️ Support: 51015-50890-50790-50645.
❇️ Resistance :51180-51280-51440-51540.
👉🏻 PURPLE LINE : 51015 is a key level, above buying, Below selling.
👉🏻 @thetradeforecast 🇮🇳

BANKNIFTY Intraday Trade Setup For 29 Aug 2024BANKNIFTY Intraday Trade Setup For 29 Aug 2024
Bullish-Above 51410
Invalid-Below 51300
T- 51960
Bearish-Below 50920
Invalid-Above 51030
T- 50390
BANKNIFTY has closed on a slight bearish note with 0.26% cut today. Nothing triggered as per trade setup and made an inside candle in daily TF. Inside candle is a sign of contraction and after this it is likely to give directional move. Key levels will be 51410 and 50920, high and low of the mother candle. Most likely it is going to trigger downside. In between keep non-directional approach.
Coming to Thursday's trade setup, if index opens flat and a 15 Min candle closes above 51410 then we will long for the target of 51960.
For selling we need a 15 Min candle close below 50930. T- 50390.
In case of a big gap up/down, wait till 10 o'clock and mark the high and low of the trading range (5MIN). Trade on this range breakout.
==========
I am Not SEBI Registered
This is my personal analysis for my personal trading. Kindly consult your financial advisor before taking any actions based on this.

BANKNIFTY Intraday Trade Setup For 28 Aug 2024BANKNIFTY Intraday Trade Setup For 28 Aug 2024
Bullish-Above 51410
Invalid-Below 51300
T- 51950+
Bearish-Below 50930
Invalid-Above 51040
T- 50390
BANKNIFTY has closed on a slight bullish note with 0.26% gain today. It has formed a Pinbar candle in daily TF. In the weekend we discussed that index looks sideways to bullish as it gave range breakout above 50800 last week. Since its a Pinbar candle in daily TF we can expect some bullish move above today's high tomorrow. For selling we need a key level and that seems to be 50930.
Coming to Wednesday's trade setup, if index opens flat and a 15 Min candle closes above 51410 then we will long for the target of 51950+.
For selling we need a 15 Min candle close below 50930. T- 50390.
In case of a big gap up/down, wait till 10 o'clock and mark the high and low of the trading range (5MIN). Trade on this range breakout.
==========
I am Not SEBI Registered
This is my personal analysis for my personal trading. Kindly consult your financial advisor before taking any actions based on this.

BANKNIFTY IMPORTANT LEVELS FOR TOMORROW, 27TH AUGUST NSE:BANKNIFTY ANALYSIS FOR TOMORROW 🔺
❇️ IMPORTANT LEVELS 🚀
❇️ Support: 51118-50950-50780
❇️ Resistance : 51344-51455-51620
👉🏻 PURPLE LINE : 51230 is a key level, above buying, Below selling.
👉🏻 @thetradeforecast 🇮🇳

BANKNIFTY Intraday Trade Setup For 26 Aug 2024BANKNIFTY Intraday Trade Setup For 26 Aug 2024
Bullish-Above 51120
Invalid-Below 51010
T- 51640
Bearish-Below 50850
Invalid-Above 50960
T- 50250
BANKNIFTY has closed on a mild positive note with less than 1% gain last week. Last 2 sessions were completely sideways inside 300 points range. 51120 and 50850 are key levels to watch out for breakout. Last week it gave a breakout of daily range breakout of 50700 and 49700 in the higher side. Consolidation after breakout done, now above 51120 index should start a rally of 1000 points. Below 50850 index may dive in intraday.
Coming to Monday's trade setup, if index opens flat and a 15 Min candle closes above 51120 then we will long for the target of 51640.
For selling we need a 15 Min candle close below 50850. T- 50260.
In case of a big gap up/down, wait till 10 o'clock and mark the high and low of the trading range (5MIN). Trade on this range breakout.
==========
I am Not SEBI Registered
This is my personal analysis for my personal trading. Kindly consult your financial advisor before taking any actions based on this.
