30 Minute time frame(A)Buy CE If open and sustain above 36071 for the target 35212,35435,35710
(B)Buy PE if open below 35006-71 for the target 34561
(C) May touch the bottom trendline of the parallel pattern if any negative news flashes out. most chance to take reversal from CMP.
Niftybankanalysis

BankNifty View 9 July 2021What a day it was for BankNifty today !!! :) :) :) Big SMilesss on puts for me...after breakdown of support as shown yesterday! Hope you had a great day too !!! Bless You !!!
Dow theory ! Yes, Dow theory is not bent yet!
Trend is our friend until it bends.
Applying Fib retracements from each significant Low, the reversal is coming from a 50% level.
So, expecting a reversal from the 50% level 34830 - 34960 where there is a gap too.
This gap may act as support. Or it might get partially / completely filled before resuming upward journey.
Contrary view : There is a red inclined Trendline. If it breaks, then aggressive shorting below 34630 level seems good for immediate targets of 34000.

banknifty 07 july 2021BANKNIFTY PREDICTION & ANALYSIS FOR TOMORROW 07 JULY 2021|| OPTION DATA || STRADDLE || STRANGLE
#banknifty #StockMarket #stocks #expiry #Thrusday
#indianstockmarket #OptionsTrading #NSE #sensex #bse #Prediction #analysis #nifty #nifty50 #strategy

BankNifty ViewBank Nifty saw a profit booking at the end of the session.
View : Cautiously Bullish (due to evening star formation at the end)
Support at 35000 / 35200, if
Resistance at 35700 / 35800
If breaks, 1st target 36000
View for tomorrow : if it fails to break the top of evening star might see consolidation with no break out or break down.
Although, 2nd halfs are more adventurous... ;)
Happy Trading !!!


BANKNIFTY Weekly LEVELSMagic Lines:
All supports are not for buy level. As like all resistance are not for sell levels
After long research and back testing we find which S&R is for sell level & which S&R is buy level.
In that result we give the pure intraday levels in charts.
BLUE LINE ARE BUY LEVELS (Target lines)
ORANGE LINES ARE SELL LEVELS(Target lines)
Additionally we added guiding line for entry and SL
There are 10 different pattern based on market opening for getting entry in market with this line if anyone interested please command below ..

BANK NIFTY (NIFTY BANK) Option trading analysis for 05 July 2021CALL TRADE ANALYSIS
BANK NIFTY is looking bullish, if it breaks 34897 , then wait for targets 1, 2, and 3 (34969, 35094, 35172)
PUT TRADE ANALYSIS
If the Market turns to bear side then short after 34760 for target 1 34642.
(Capture your profit timely in bearish side because market can turn and time to bullish)
Note:
Black Lines: Breakout point, If it breaks go for long, and if it breaks go for short.
BLUE LINES: Target and Resistance lines, If if breaks go for long to other green lines.
RED LINES: Target and Support lines, If if breaks go for short to other red lines.
DISCLAIMER:- I Am Not SEBI Registered Analyst or financial adviser.
All Post and Levels Posting Only For learning Purpose. Not Giving Any Recommendations For Trade. I'm Not Responsible For Your Any Kind Of Loss Or Profit. Before trading please consult with your financial advisor.
No Claim, All Rights Reserved.‼️

BANK NIFTY Analysis (05 July, 2021)Before taking any trade, always have a strategy in your mind. Which includes stop loss, target areas, capital requirements.
Never risk more than 2% of your overall capital in one trade. Be patient and wait for the levels.


BankNifty View Double Top or Inverted Head n Shoulder ?BankNifty seems to be bullish but at the resistance which was tested more than twice.
Above 35500 bullish bet
Below 34980 bearish bet

Nifty Bank weekly Analysis Forming an Inverse Head and Shoulder Pattern on hourly chart.
Supply zone tested multiple times.
If it breaks the resistance zone with higher volume
then there are chances of uptrend in next week.
Target for next week:
1st target 35888
2nd target 36258
.
.
This is my personal Opinion about NIFTY BANK .
Take it as educational purpose. I am not SEBI registered or any Stock market expert.
I am not responsible for PROFIT or LOSS.


BANKNIFTY Weekly LEVELSMagic Lines:
All supports are not for buy level. As like all resistance are not for sell levels
After long research and back testing we find which S&R is for sell level & which S&R is buy level.
In that result we give the pure intraday levels in charts.
BLUE LINE ARE BUY LEVELS (Target lines)
ORANGE LINES ARE SELL LEVELS(Target lines)
Additionally we added guiding line for entry and SL
There are 10 different pattern based on market opening for getting entry in market with this line if anyone interested please command below ..

HDFC BANK LONGHDFC BANK!
Largest Private bank in India and I personally love its stock keep this stock in your portfolio.
It is respecting its pre covid trendline!
Target and SL marked in pink


buy bankniftybuy @niftybank cmp 34320 spot
sl below 34280 spot
tgt 34380----3420 spot
@Banknifty @index


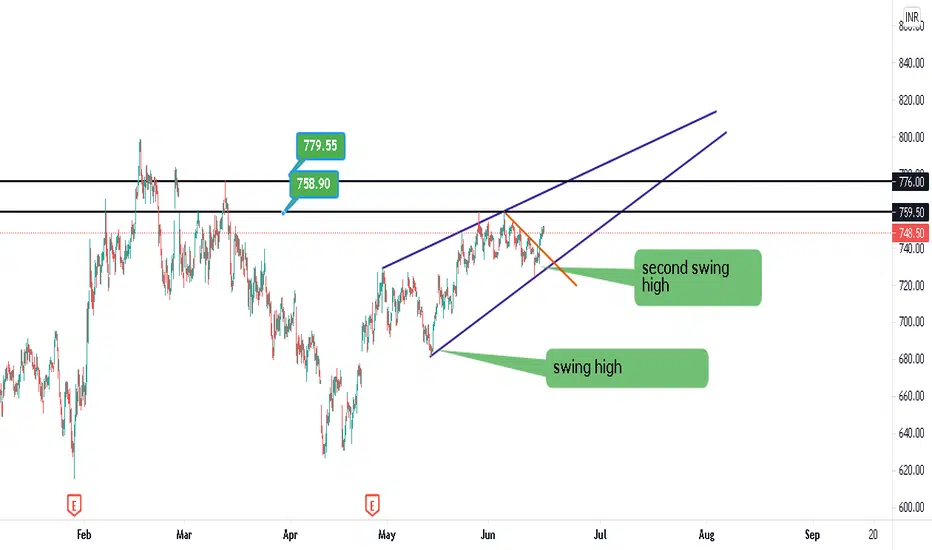
AXIS BANK ANALYSISAs per hourly price action
Axis bank is trading in Rising wedge pattern Also Axis Bank create Second lower high and bounce back from support area zone.
rsi also cross 60 level in hourly timeframe .
Buy area Above Only 753 target 1 : 760 Target 2 :766 Target 3 : 774
Stop loss : 730