Nifty spot 26328.55 by Daily Chart view - Weekly UpdateNifty spot 26328.55 by Daily Chart view - Weekly Update
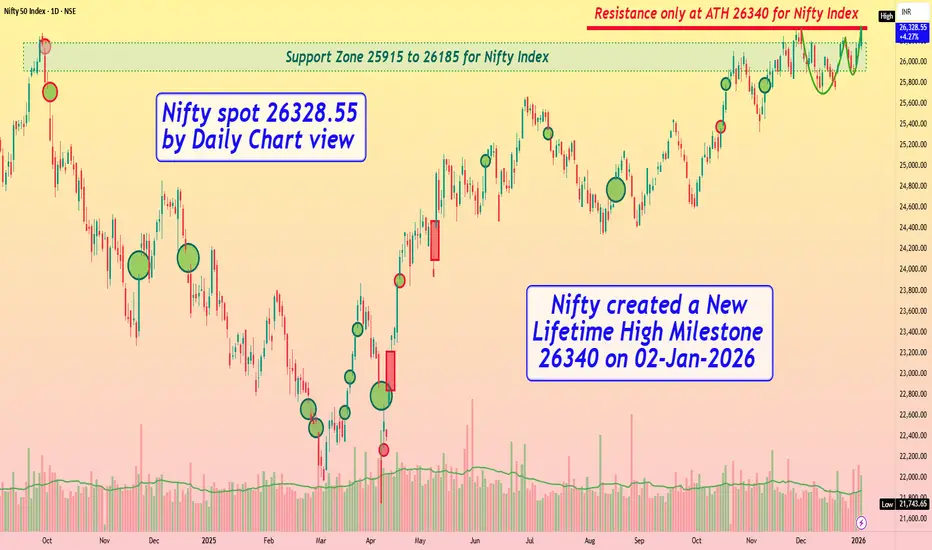
_*Nifty created a New Lifetime High Milestone 26340 on 02-Jan-2026*_
- Support Zone 25915 to 26185 for Nifty
- Resistance only at ATH 26340 for Nifty and each New ATH
- Volumes trending above avg traded quantity but with selling pressure
- Bullish Rising W formed by the neckline at previous ATH and New ATH level
- Hope to see further higher levels for the Nifty Index through the New Year 2026
Niftyindex
Nifty 50 spot 26042.30 by Daily Chart view - Weekly UpdateNifty 50 spot 26042.30 by Daily Chart view - Weekly Update
- Nifty has closed fairly above the Support Zone
- Support Zone steadfast at 25710 to 26010 for Nifty Index
- Resistance Zone grounded at 26200 to ATH 26325.80 for Nifty Index
- Volumes have fallen well below the average traded quantity thru the week
- Falling Resistance Trendline and the Resistance Zone rejection remain intact

Nifty 50 spot 25966.40 by Daily Chart view - Weekly UpdateNifty 50 spot 25966.40 by Daily Chart view - Weekly Update
- Nifty has closed within Support Zone range upper end
- Support Zone remains steady at 25710 to 26010 for Nifty Index
- Resistance Zone stands firmly at 26200 to ATH 26325.80 for Nifty Index
- Volumes synced closely with avg traded quantity over the entire past weeks
- Falling Resistance Trendline Breakout in a steady making process by weekly closure

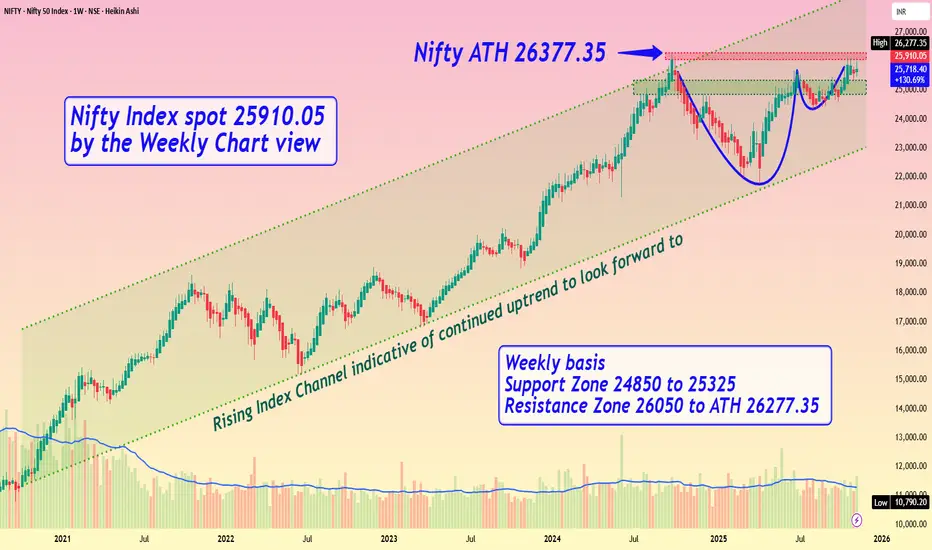
Nifty Index spot 25910.05 by the Weekly Chart viewNifty Index spot 25910.05 by the Weekly Chart view
- Weekly basis - Support Zone 24850 to 25325
- Weekly basis - Resistance Zone 26050 to ATH 26277.35
- Rising Index Channel indicative of continued uptrend to look forward to .....
- Bullish Cup and Handle pattern shows breakout expectation from Resistance Zone
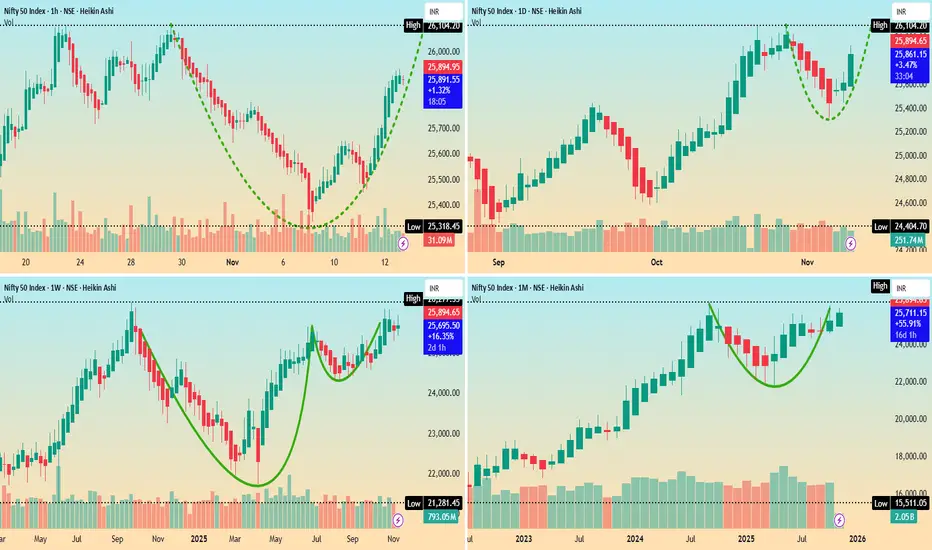
Nifty 50 Index spot 25890 Multi Timeframe viewsNifty 50 Index spot 25890 Multi Timeframe views
Major Timeframes showing Bullish Chart view by Hourly, Daily, Weekly and Monthly, so hope for the best to happen 🤞🏼😊
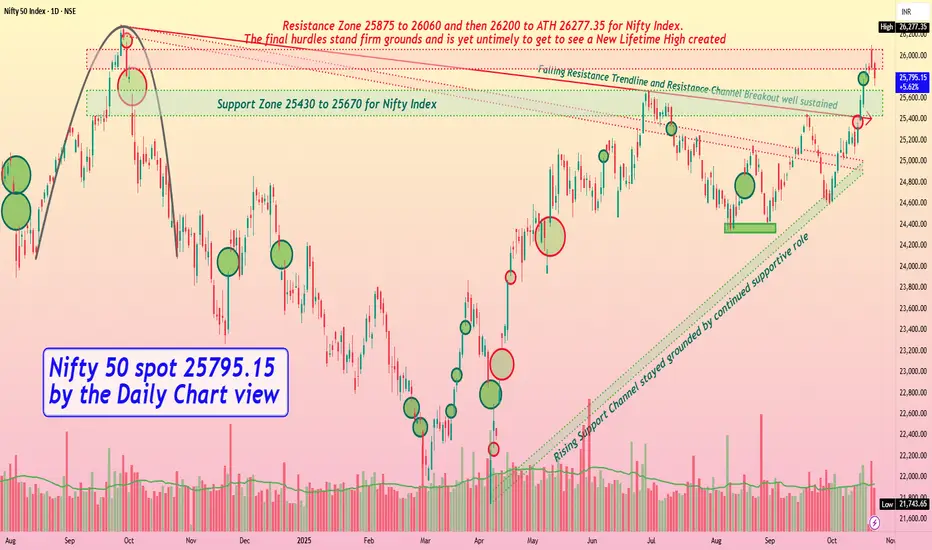
Nifty 50 spot 25795.15 by Daily Chart view - Weekly updateNifty 50 spot 25795.15 by Daily Chart view - Weekly update
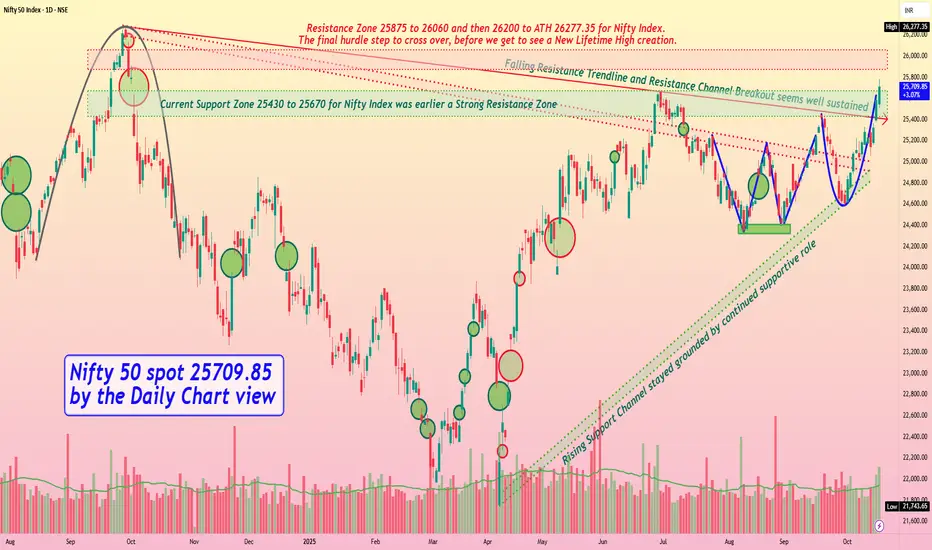
- Support Zone 25430 to 25670 for Nifty Index
- Rising Support Channel stayed grounded by continued supportive role
- Falling Resistance Trendline and Resistance Channel Breakout well sustained
- Resistance Zone 25875 to 26060 and then 26200 to ATH 26277.35 for Nifty Index
- The final hurdles stand firm grounds and is yet untimely to get to see a New Lifetime High created
- Nifty Index earlier shied away to cross the 25K level and now acting likewise to breach the ATH 26277.35 mark
Nifty 50 spot 25709.85 by the Daily Chart view - Weekly updateNifty 50 spot 25709.85 by the Daily Chart view - Weekly update
- [ b]Nifty Index now just 567.50 points away from ATH 26277.35 for creating a New Lifetime High Milestone
- Resistance Zone 25875 to 26060 and then 26200 to ATH 26277.35 for Nifty Index
- The final hurdle step to cross over before we get to see a New Lifetime High creation
- Both Falling Resistance Trendline and Resistance Channel Breakout seem well sustained
- Current Support Zone 25430 to 25670 for Nifty Index was earlier a Strong Resistance Zone
- Rising Support Channel has stayed firmly grounded by providing the continued supportive role
- Bullish Technical patterns Double Bottom "W" followed by Rounding Bottom formed by Support Zone neckline
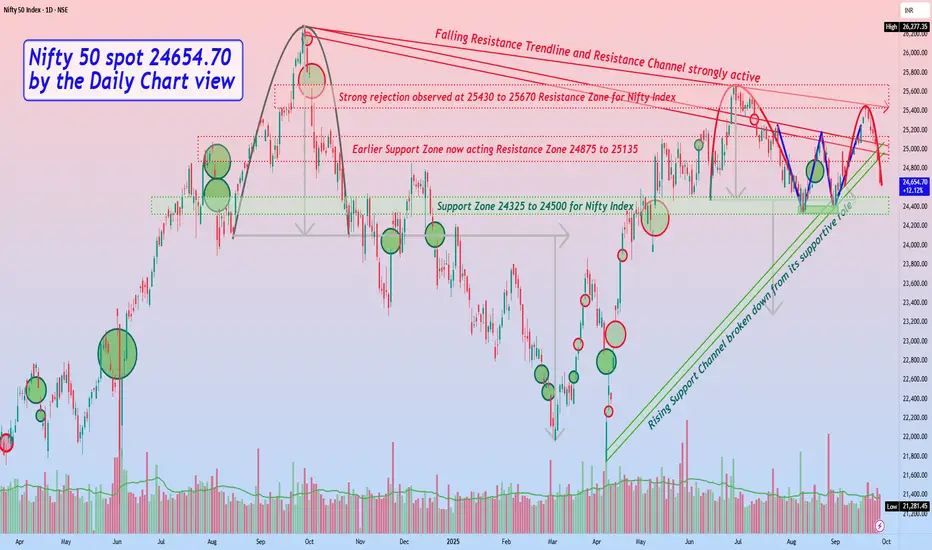
Nifty 50 spot 24654.70 by Daily Chart view - Weekly updateNifty 50 spot 24654.70 by Daily Chart view - Weekly update
- Support Zone 24325 to 24500 for Nifty Index
- Rising Support Channel broken down from its supportive role
- Earlier Support Zone now acting Resistance Zone 24875 to 25135
- Falling Resistance Trendline and Resistance Channel are strongly active
- Strong rejection observed at 25430 to 25670 Resistance Zone for Nifty Index
- Bearish Rounding Top is seen in the making process with Support Zone neckline
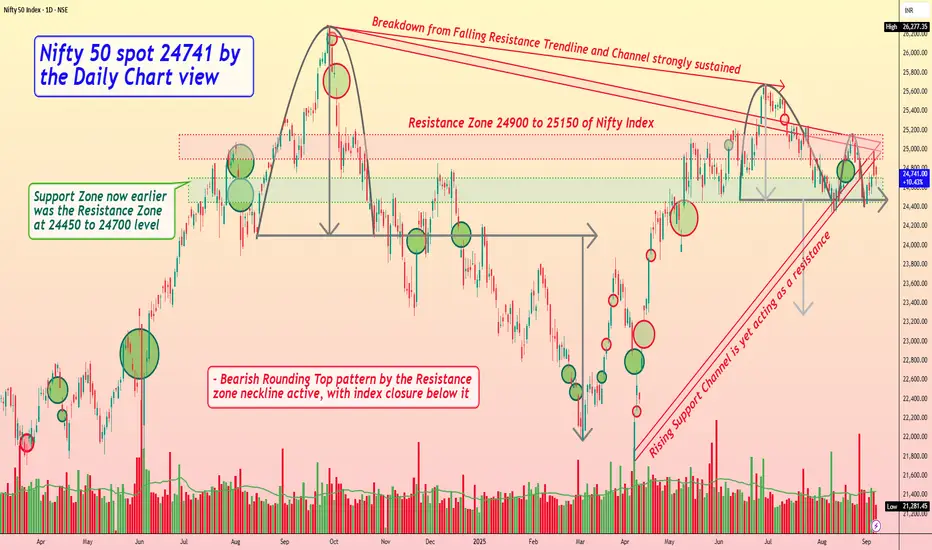
Nifty 50 spot 24741 by Daily Chart view - Weekly updateNifty 50 spot 24741 by Daily Chart view - Weekly update
- Resistance Zone 24900 to 25150 of Nifty Index
- Rising Support Channel is yet acting as a resistance
- Support Zone now earlier was the Resistance Zone at 24450 to 24700 level
- Breakdown from Falling Resistance Trendline and Channel has strongly sustained
- Bearish Rounding Top pattern by Resistance zone neckline active, with index closure below it
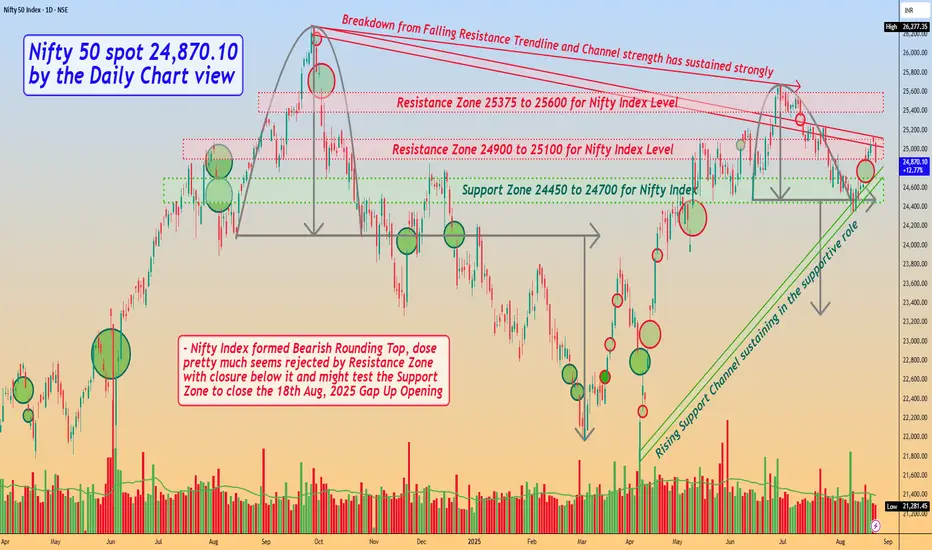
Nifty 50 spot 24,870.10 by the Daily Chart view - Weekly updateNifty 50 spot 24,870.10 by the Daily Chart view - Weekly update
- Support Zone 24450 to 24700 for Nifty Index
- Rising Support Channel sustaining in the supportive role
- Resistance Zone seen at 24900 to 25100 for Nifty Index Level
- Next Resistance Zone seen at 25375 to 25600 for Nifty Index Level
- Nifty Index formed Bearish Rounding Top, dose pretty much seems rejected by Resistance Zone with closure below it
- Basis Gap Up Opening done on 18th August, 2025, Nifty Index might just test Support Zone for closing Gap Up vacuum area
- Rest, let us HOPE FOR THE BEST TO HAPPEN, for the known fact that MARKETS ACT SUPREME ALL THE TIME, no matter what we propagate
Nifty50 Intraday Rebound-Sets Eyes For Long 🔍 Key Observations:
✅ A fresh Buy label has printed after a series of lower lows — suggesting potential momentum shift.
🔴 Previous Sell cluster accurately marked the swing high near 25,145 zone.
⚪ Price is still trading below the 200 EMA, but attempting to reclaim short-term trendlines.
🟫 Minor Liquidity Box indicates supply pressure ahead, aligning with previous structure resistance.
📊 Risk-to-reward suggests the move could extend towards 25,145.35, if price holds above 24,707.
🎯 Setup Summary:
Bias: Cautiously bullish, short-term retracement within broader downtrend
Target Zone: 25,145 – matching previous support turned resistance
Invalidation: Below 24,647 where recent demand may fail
🧠 Educational Insight:
This setup highlights a classic counter-trend bounce from oversold levels, often seen when market participants begin profit-taking or short-covering. Momentum confirmation is crucial beyond the red zone to validate follow-through.
⏱ Timeframe:
15-Minute (Intraday)

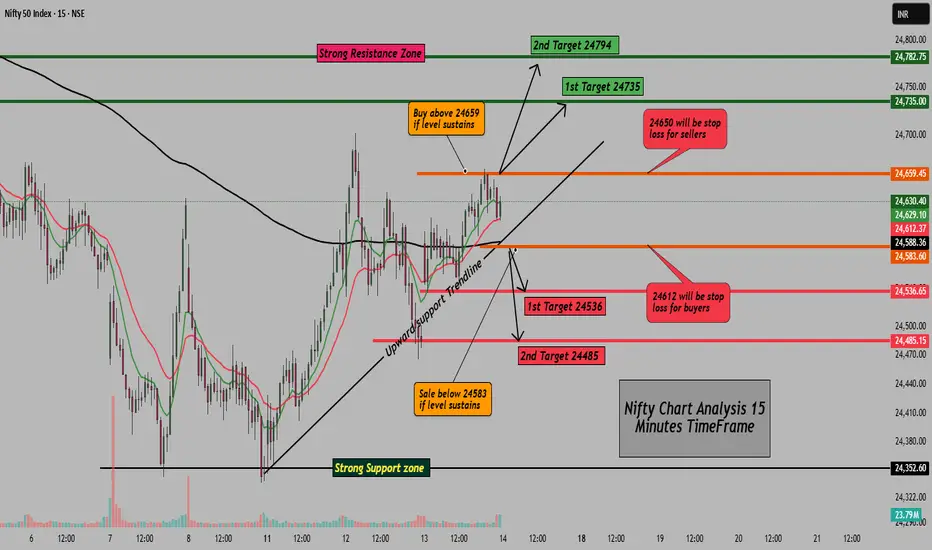
Nifty Intraday Analysis, Key Levels & Trade Plan for 14 Aug 2025Good Morning Traders,
Yesterday, Nifty maintained a bullish tone throughout the session, respecting the upward support trendline and closing near the higher levels. Price action stayed above key psychological support zones, hinting at buying interest on dips. Resistance near the 24,660 area acted as a hurdle, and today’s session will decide whether bulls can take control for higher targets or sellers will step in at resistance.
Important Levels for Nifty (15-Minutes Timeframe):
Intraday Support Zone: 24,583 – 24,536
Intraday Resistance Zone: 24,659 – 24,735
Buy Setup:
Buy above 24,659 if the level sustains for at least 15 minutes .
Targets: 24,735 / 24,794
Stop Loss: 24,612
Sell Setup:
Sell below 24,583 if the level sustains for at least 15 minutes .
Targets: 24,536 / 24,485
Stop Loss: 24,650
Trend Bias: Neutral-to-bullish above 200 EMA; bearish bias if price sustains below it .
Note: Levels are for reference. When a trade setup forms, I will update it in the live market, stay tuned .
Disclaimer: This analysis is for educational purposes only. Please do your own research or consult a financial advisor before trading .
Nifty 50 spot 24,363.30 by the Daily Chart view - Weekly updateNifty 50 spot 24,363.30 by the Daily Chart view - Weekly update
- Support Zone 23850 to 24100 for Nifty Index
- Resistance Zone 24450 to 24700 for Nifty Index earlier Support Zone
- Bearish Rounding pattern top for Nifty 50 Index from ATH 26277.35 to 24073.90 diff 2,203 points
- Nifty 50 Index took reversal from 21964.60 just tad above from expected low of 21870 by 2203 points
- Bearish Rounding Top has repeated from the recent high of 25669.35 to 24473 having a difference of 1196 points
- *Will the same downfall behavior happen and see history repeated for Nifty 50 Index going down till 23276 and then reverse upside*
- *Stock Markets Domestically and Globally, are bearing the brunt of adversely affecting and negatively playing Tariff Tantrum Trumpet*

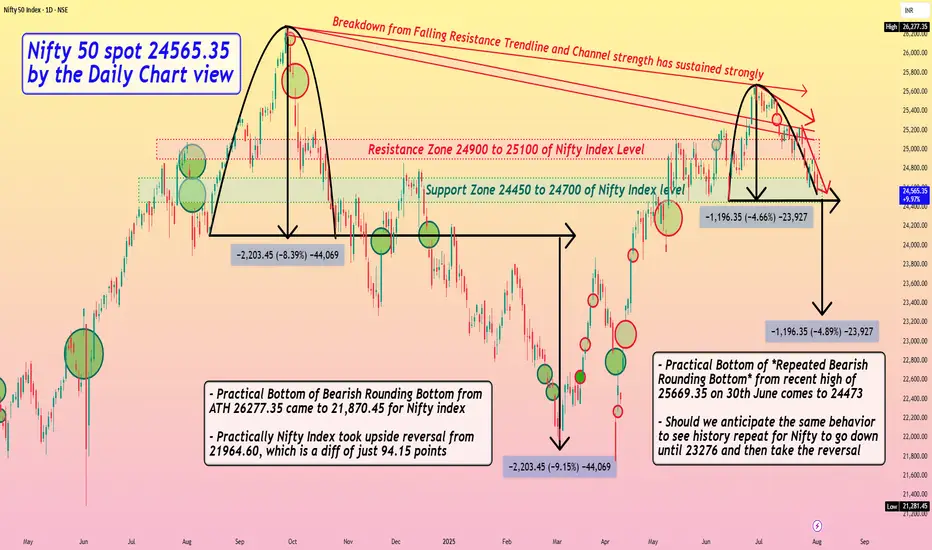
Nifty 50 spot 24565.35 by the Daily Chart view - Weekly update*Nifty 50 spot 24565.35 by the Daily Chart view - Weekly update*
- Resistance Zone 24900 to 25100 of Nifty Index Level
- Support Zone 24450 to 24700 of Nifty Index level still seen sustained
- Bearish Rounding Bottom after ATH level seen repeated at current week closure
- Practical Bottom of *Bearish Rounding Bottom* from ATH 26277.35 came to 21,870.45 for Nifty index
- Practically Nifty 50 Index later took an upside reversal from 21964.60, which is a diff of just 94.15 points
- Practical Bottom of *Repeated Bearish Rounding Bottom* from recent high of 25669.35 on 30th June comes to 24473
- Should we anticipate the same behavior to see history repeat for Nifty to go down until 23276 and then take the reversal
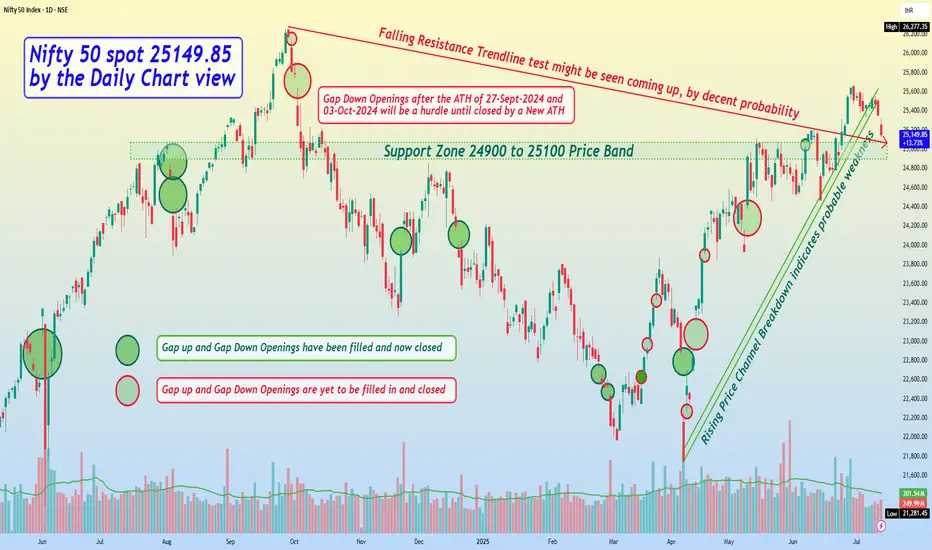
Nifty 50 spot 25149.85 by the Daily Chart view - Weekly updateNifty 50 spot 25149.85 by the Daily Chart view - Weekly update
- Support Zone 24900 to 25100 Price Band, yet sustained
- Next Support Zone seen at 24325 to 24500 of the Nifty Index
- Resistance Zone 25860 to 26035 then ATH 26277.35 of Nifty Index levels
- Rising Price Channel Breakdown indicates probable weakness to see following
- Falling Resistance Trendline test might be seen coming up, by decent probability
- Nifty Index keeping within self drawn limits and shying away at each attempt towards 26000
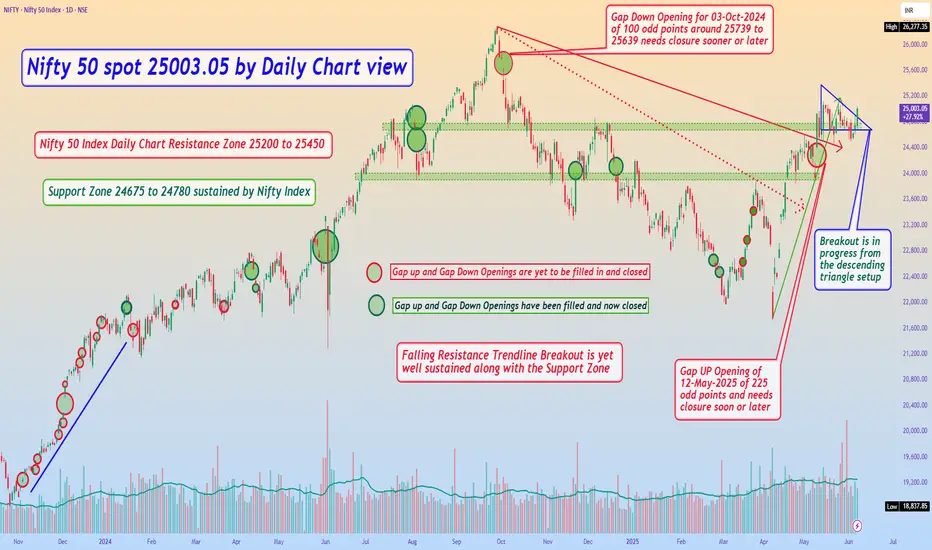
Nifty 50 spot 25003.05 by Daily Chart view - Weekly UpdateNifty 50 spot 25003.05 by Daily Chart view - Weekly Update
- Support Zone 24675 to 24780 sustained by Nifty Index
- Nifty 50 Index Daily Chart Resistance Zone 25200 to 25450
- Breakout seems in progress from the descending triangle setup
- Gap UP Opening of 12-May-2025 of 225 odd points, needs closure sooner or later
- *Nifty 50 Index yet lagging well behind to create a New ATH unlike the Bank Nifty Index*
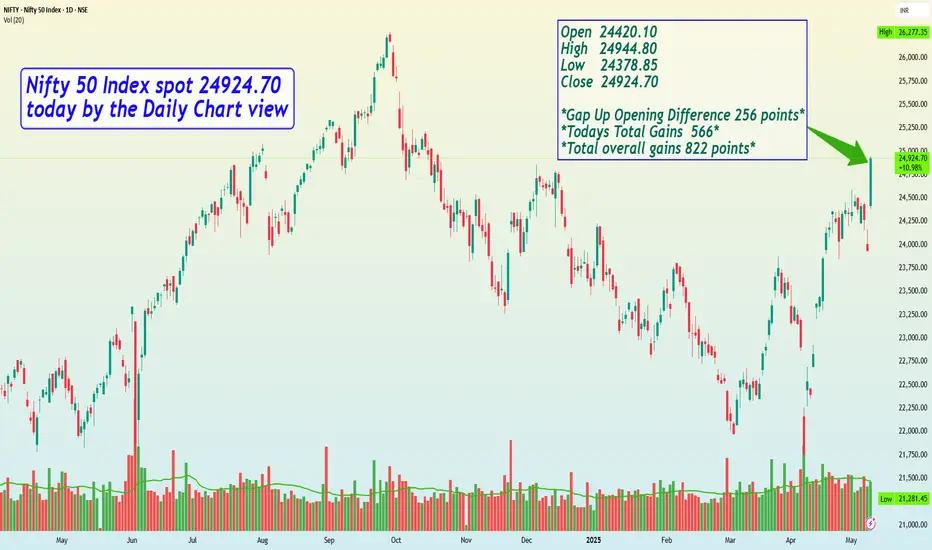
Nifty 50 Index spot 24924.70 today by the Daily Chart viewNifty 50 Index spot 24924.70 today by the Daily Chart view
Open 24420.10
High 24944.80
Low 24378.85
Close 24924.70
Gap Up Opening Difference 256 points
Todays Total Gains 565.95
Overall Total Points Gained 822 points 😃🙌🏼🤩🤝🏼😍👍🏼
* The Gap Up Opening today of 256 points will need to be closed sooner or later on for it might act as a vacuum created space to be filled in.
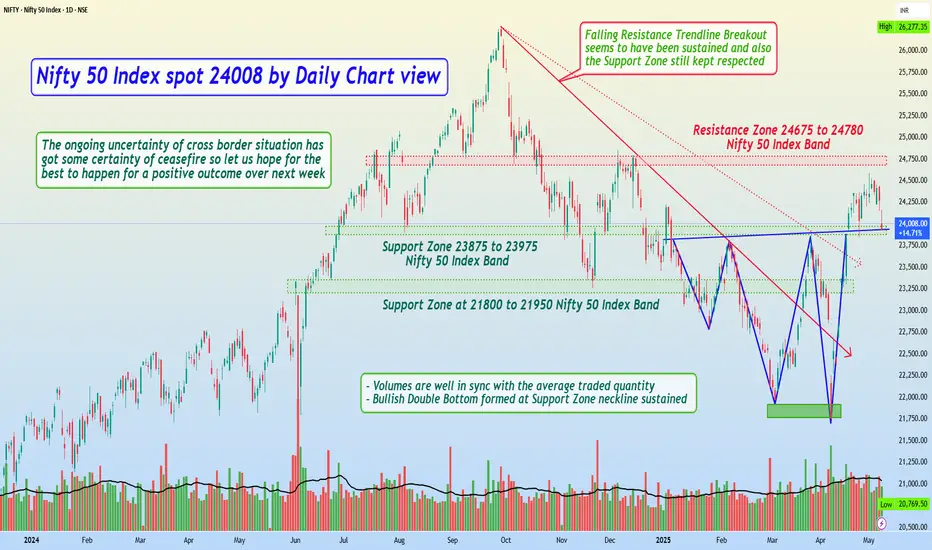
Nifty 50 Index spot 24008 by Daily Chart viewNifty 50 Index spot 24008 by Daily Chart view
- Resistance Zone 24675 to 24780 Nifty 50 Index Band
- Nifty is at Support Zone 23875 to 23975 Nifty 50 Index Band
- *Nifty having sustained above the Support Zone is bound to a bounce back by the cross border mellowed down situation*
- *The ongoing uncertainty of cross border situation has got some certainty of ceasefire so let us hope for the best to happen for a positive outcome over next week*
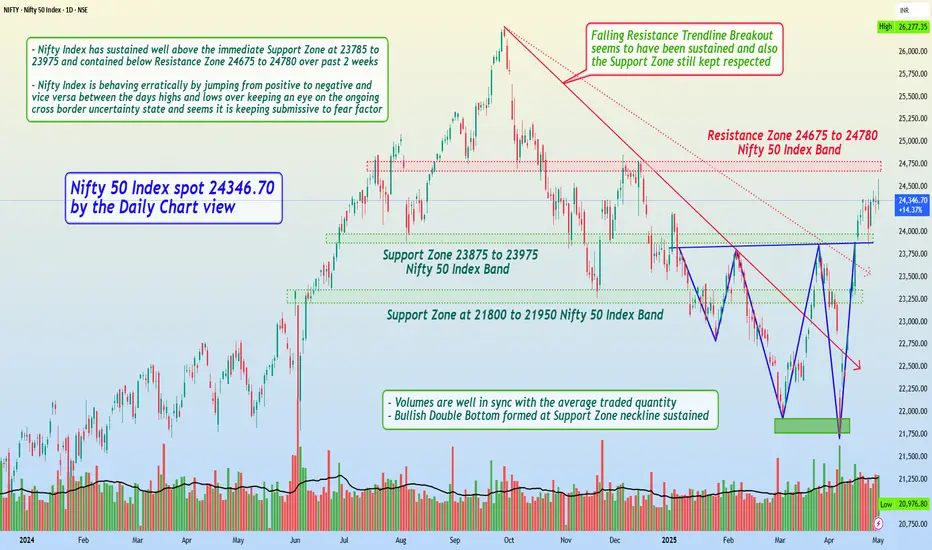
Nifty 50 Index spot 24346.70 by Daily Chart view - Weekly UpdateNifty 50 Index spot 24346.70 by the Daily Chart view
- Support Zone 23875 to 23975 Nifty 50 Index Band
- Resistance Zone 24675 to 24780 Nifty 50 Index Band
- Volumes are well in sync with the average traded quantity
- Nifty Index has sustained well above the immediate Support Zone at 23785 to 23975 and contained below Resistance Zone 24675 to 24780 over past 2 weeks
- Nifty Index is behaving erratically by jumping from positive to negative and vice versa between the days highs and lows over keeping an eye on the ongoing cross border uncertainty state and seems it is keeping submissive to fear factor
- Let us hope for the best to happen for a positive outcome over the coming days/weeks and foresee Nifty 50 Index to gradually and steadily progress towards the current ATH 26277.35 for a New ATH, in line with the Bank Nifty Index strides
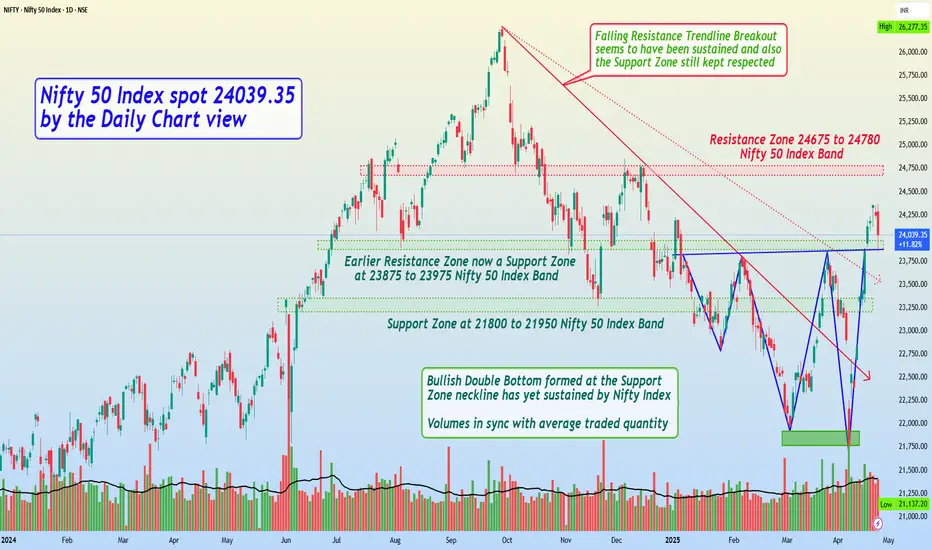
Nifty 50 Index spot 24039.35 by Daily Chart view - Weekly UpdateNifty 50 Index spot 24039.35 by the Daily Chart view - Weekly Update
- Resistance Zone 24675 to 24780 Nifty 50 Index Band
- Volumes are in good sync with the average traded quantity
- Both the Falling Resistance Trendlines have been decently maintained todate
- Earlier Resistance Zone now a Support Zone at 23875 to 23975 Nifty 50 Index Band
- Bullish Double Bottom formed at the Support Zone neckline has yet sustained by Nifty Index
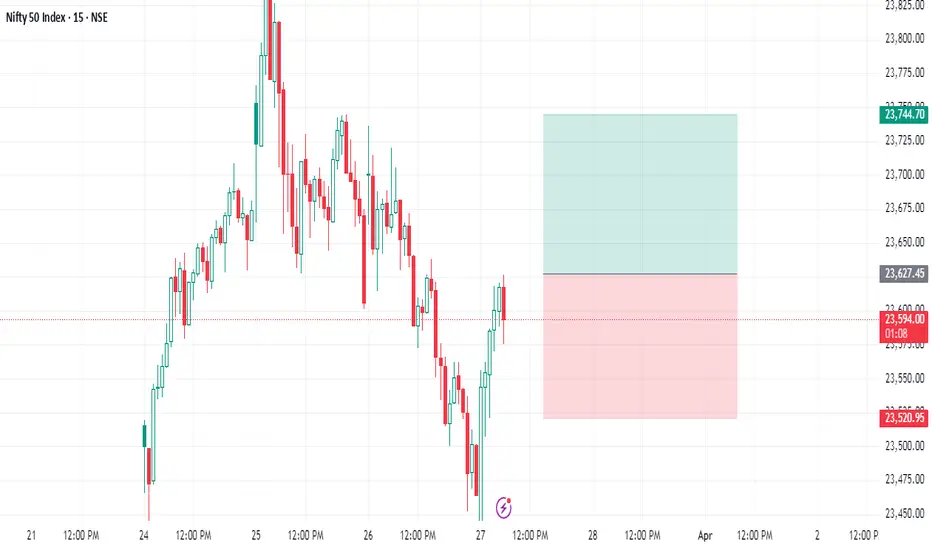
Nifty next Target 23750...112 points..SpikeNifty buy above 23627
Stoploss 23520....107 points
Target ........23740++ 112 points
Wait for active .. If active move oneside direct..check
This level only for education purpose only
Do ur own analysis
Nifty Pharma Most Beautiful & Positive ChargeIn this time market correction Nifty Pharma is one of the most Positive chart, Currecty market participant think that After donld trump This is bad news for the Pharma sector but chart say the different story. Now it is the time to long this index share.

Nifty 50 spot 24781.30 by Hourly Chart viewNifty 50 spot 24781.30 by Hourly Chart view
- Intermediate Support Zone 24475 to 24525
- Resistance Zone 24750 to 24885 Price Band may become a Support Zone
- The Next Support Zone seen at 24300 to 24375 Price Band acting as H&S neckline
- Resistance Zone 24750 to 24885 Price Band needs to be crossed, closure sustained above it for continued upwards bullish transition
