Nifty Funny Pattern and target :)Hope this doesnt happen and remains a funny forecast.
Bearish AB=CD pattern on monthly chart
Niftyindex

NIFTY : 19TH OCT#NIFTYINDEX, #NIFTY50
* NIFTY INDEX : RESISTANCE AT 17550 - STRONG SUPPORT AT 17000.
> After two day rally, Nifty may go for consolidation mode. Banking Sector rally may continue, that will make nifty to break 17600.
> Global Market seems to be in consolidation Mode or Profit Booking after huge rally for past 2 days.
* NIFTY TECHNICAL : NEUTRAL , HUGE GAP UP WILL BE DIFFICULT TO SUSTAIN UNTILL ANY POSITIVE NEWS.
AT 17500 OI : CALL - 85 L
PUT - 52 L.
* SECTOR TO WATCH : BANKING, AUTO
DAILY CHART : RESISTANCE AT 17550 .
STOCKS TO WATCH : #TATAPOWER, #CANBK, #SBIN #AUBANK, #FEDERALBANK.
Canara bank and Sbi both made huge rally, with expecting positive report from q2 result. After result, profit booking may happen.

Long with a flag pattern in NIFTYFlag Pattern in Nifty 15 Mins Chart, seems a good movement towards target of 17600 in the coming week.
I may be wrong, consult your finance advisor before any investing or trading.

Simple Trade Setup | NIFTY | 07-02-2022 [INTRADAY]NSE:NIFTY
Trade Setup for 07-02-2022
1) Don't Jump in to trade at the beginning of the market. Let it get settle for 15-20min first and judge the price action.
2) Everything is mentioned on the chart. I hope it is easy to understand.
3) All the levels will work as support, resistance, entry and exit w.r.t price action near that level.
4) Avoid gap up or gap down chase. Wait and trade between levels.
Please refer below chart for levels.
Hope I made it easy to understand it.
Do comment your doubt or suggestion.
Note: Trade with Strict SL. It may or may not hit all the levels. So one can book profit / loss at respective level considering how price action works near that level.

NIFTY INTRADAY (NEO WAVE FORECAST)Hi
i am just updating the status for previous forecast. In yesterday forecast i said that the formation of ABC will form.
So we are in last stage of finalizing the A degree.
after that there will be B degree start.
how you trade is upto you
thank you

nifty 50 analysis (20-09-21)nifty 50 falls today about 188 points
the main pressure is from metal index which is fall today 374.85 points (6.6%)
Support level 17350 and after that strong support is 17250


NIFTY CHART ANALYSED FOR UPCOMING TRADING SESSIONS The channel is getting narrower and nifty being in this channel since last month indicates big move upcoming in few days keep watch everyone

Is it time to be cautious on NIFTY?Some conflicting signals:
India VIX has been closing below 20(good sign), occasionally giving a spike scare then abating within the session.
Not much buying seen from FIIs/DIIs. In fact the FIIs sold 660Cr and DIIs bought only 112Cr. Yet market closed marginally in green. Is the market being kept afloat for a while?
The RSI divergence can be easily noticed on the charts.
The NIFTY Futures relative strength against NIFTY has been in a constant decline for four sessions.
Nifty is forming a Rounding bottom pattern, but the volumes have been on a continuous decline. (Ideally the volumes should expand while the price approaches the breakout point.)
The leading sectors (Metals, Pharma, IT) are not really moving (market breadth wise).
We are seeing a lot of failed breakouts. A hard penny environment. The NIFTY looks like a stronger index vis-a-vis S&P500 on Relative Strength. But are we really seeing strength in the broader market?

NIFTY CHART ANALYSED FOR 6th MAY ( expiry special levels )Had been in range through the day
Making it much likely to give unidirectional move
Important levels mentioned in chart must take note of ✅

NIFTY CHART ANALYSED FOR 27th APRIL As we discussed it Broke the trendline in the very first half and gave good 120++ points in one go
Currently forming FLAG- POLE pattern which is also a bullish continuation pattern!!
We should not go LONG aggressively unless our levels breaches
And let the chart speak the next ✅

Nifty Playing very well as predicted, it will fall to 13,787.60
Nifty played very well as predicted.
Next move:- If it gives one more push up to 14,545.50, take a swing short till 13,787.60. Then from 13,787.60, take a swing long till 15,446. Trail your stop loss during the drop and rally.

Nifty at Support?Nifty has definitely respected this level. There has been no decisive breakdown here. Let's see where it holds onto ultimately. Please remember, this is a correction and not a crash! The lines drawn are my levels, Bull Markets generally respect support levels (one level here or there is normal) while Bear Markets make you respect the resistance levels.


Nifty trend linesPs: Am just learning not a pro If you are good at analysing charts correct my mistake.
I will appreciate that :)

Be cautious at these NIFTY levelsNIFTY has tried thrice to break the levels already and still has not managed to. Go longs only above this level.

NIFTY 50 INDEX ELLIOTT WAVE ANALYSIS 11 October 2020Nifty is unfolding in a five wave advance from the lows of 10790 where it completed wave4 , within this five waves of the fifth wave it is currently in the third wave of one lower degree and its projected target comes around 12060-70 odd levels which will be 1.618 times wave one of the same degree. Support is placed at the lower end of the channel around 11800 - 11750 levels. The dashed green lower channel is the guiding factor for reversal in near term.

Warning: Nifty50 above a dangerous levelWarning: Nifty50 above a dangerous level
A long Legged Doji, very basics of technical analysis. The long-legged doji suggests that the forces of supply and demand are nearing equilibrium and that a trend reversal may occur!!!!
Also, the steep rise can be dangerous, corrections is very much required.
24 Sep = 10800 Levels and 8 Oct = 11900, around 1100 points gain in 10 trading session.
You should Trade Safely in this market.
.
If you like, just hit thumbs up button
or comment.
.
Updated on : 8-Oct-2020 - 7.10pm
Disclaimer: Only for learning purpose.
- Nse Intraday Stock Trends and Stock Market Tips
for more on stock trends and stock market learning

Shorted Nifty for minimum target of 10990good Location to short the index
seen good quality of selling
in distribution zone

NiftyRunning in a parallel channel.
If breaks the low line, then small sell-side possible.
Overall - market looks bullish.

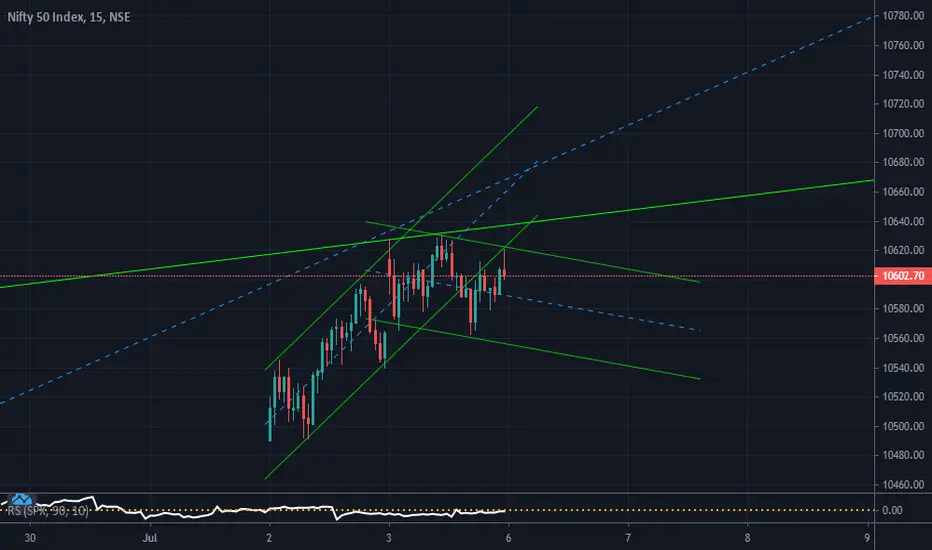
Nifty - Resistance at 10600Note: This is for educational purpose only.
There seems to be a strong resistance at 10600 for Nifty. If this is broken convincingly, there would be further up-move. There is a possibility of sideways movement too for sometime. My overall sentiment is bullish but not expecting any sudden up move.