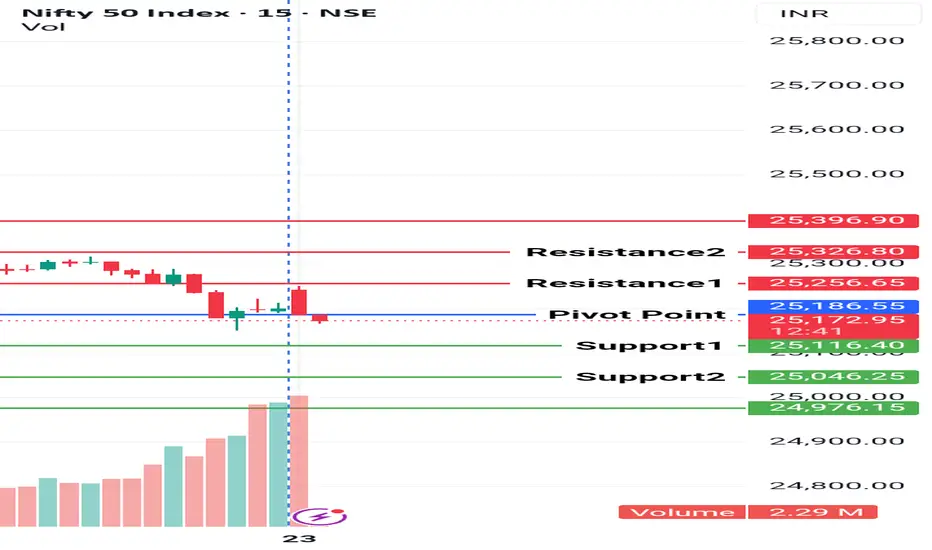
Nifty key levels for 23.09.2025NIFTY KEY LEVELS FOR 23.09.2025
RTF: 3 Minutes
If the candle stays above the pivot point, it is considered a bullish bias; if it remains below, it indicates a bearish bias. Price may reverse near Resistance 1 or Support 1. If it moves further, the next potential reversal zone is near Resistance 2 or Support 2. If these levels are also broken, we can expect the trend.
When a support or resistance level is broken, it often reverses its role; a broken resistance becomes the new support, and a broken support becomes the new resistance.
If the range (R2-S2) is narrow, the market may become volatile or trend strongly. If the range is wide, the market is more likely to remain sideways.
please like and share my idea if you find it helpful
Disclaimer
The idea is for educational purpose only..
Niftyindia
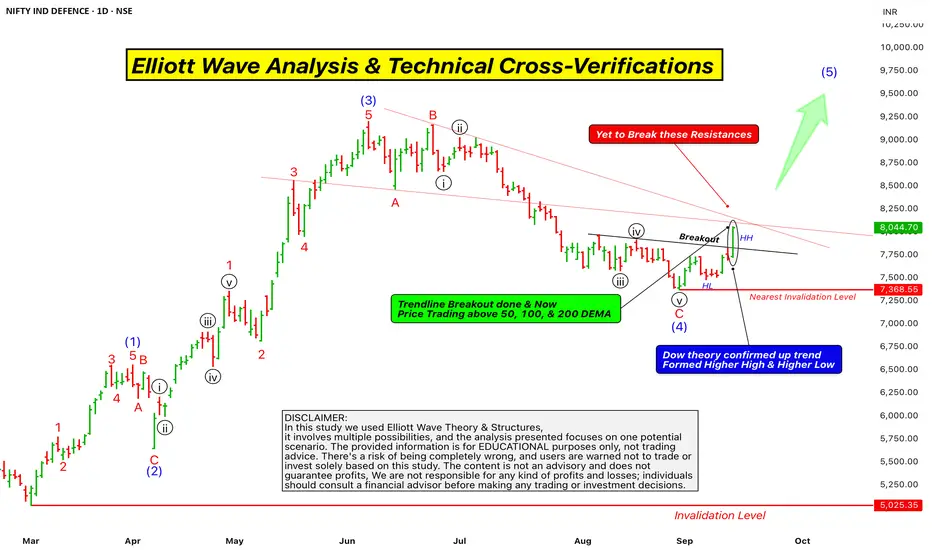
Elliott Wave Analysis & Technical Cross-VerificationsHello Friends, Welcome to RK_Chaarts,
Today, we're going to learn how to validate our Elliott Wave analysis by identifying additional factors that support our directional bias. Once we've plotted our Elliott Wave counts and identified a direction, we want to confirm whether other technical indicators and patterns align with our analysis. This helps strengthen our conviction in our directional bias and provides additional confidence in our trading decisions. Today, we'll explore some key points, including Elliott Wave theory, Exponential moving averages, Trend line breakouts, and Invalidation levels, as well as projected targets. And please note that this post is shared solely for educational purposes. It is not a trading idea, tip, or advisory. This is purely an Educational post.
Elliott Wave Theory structure & wave Counts
Here chart we are using Nifty India Defence sector, which is an index chart. We are analyzing it using Elliott Wave theory. It's very clear that from the March 2025 bottom, we've identified a clear Wave (1) Wave (2) Wave (3) and Wave (4) and now we've started Wave (5) of Intermediate degree in Blue.
Projections of wave (5)
According to the theory, the projected target for Wave (5) is typically between 123% to 161.8% of the length of Wave (4). So, we can at least assume that the price will reach 123% of Wave (4)’s length, and the price will move higher from here.
Trendline Breakout
The trend line breakout also confirms this. Since Wave (4) moved downwards, Wave (5) should move upwards, indicating a potential upward movement in price. This is a positive signal and a possibility.
Dow Theory confirmation of Trend changed
Additionally, we can see that in the daily time frame, the price has recently completed Wave (4) and formed a higher high, followed by a higher low, and then another higher high, along with a trend line breakout, which we've marked with a rounded ellipse on candle on the chart.
According to Dow theory, this formation of higher highs and higher lows, along with the trend line breakout, indicates that the index has the strength to break through resistance. These two factors strongly support our Elliott Wave projection, which suggests that the price will move upwards. The chart is looking bullish, indicating that a swing has been activated upwards from here.
Exponential Moving Averages
Furthermore, we can see that the price is trading above the 50-day exponential moving average (EMA) in the daily time frame, as well as above the 100-day EMA and the 200-day EMA. These three EMAs are major indicators, and the price is sustaining above all of them. This is also a very good positive sign that supports our view and this scenario.
Supporting Indicators
MACD
RSI
Some Hurdles to cross yet
Finally, we can see that the Zero B trend line, which is coming down from the top, has not been crossed by the price yet, and there has been no breakout. Additionally, we have drawn a trend line connecting the high of the third wave and the low of the fourth wave, which initially acted as resistance and later as support. This trend line is also approaching the same level as the Zero B trend line. So, we have two resistances converging at the same point, which the price has yet to break out of.
This could potentially be a hurdle, and it's possible that according to the Elliott Wave count, Wave (5) will arrive with five sub-divisions, which could lead to a retest of the previous trend line or a Retracement before moving further upwards.
Invalidation Level
According to Elliott Wave theory, the nearest invalidation level is the low of Wave (4), which is currently at 7368, and this level should not be breached. If it is, it will lead to a lower low, which would be an invalidation of the Elliott Wave count.
Overall, the chart of this index looks very promising and bullish. As we all know, the market can be unpredictable, but if this invalidation level is not triggered and the price doesn't break down, then the chart may move upwards with strength. This entire analysis that we discussed is for the Nifty India Defense index chart. Please note that this is not a trading tip or advice, but rather an educational perspective that we shared. Also, keep in mind that the Nifty Defense index is not tradable, but it does provide insight into the market's direction.
This post is shared purely for educational purpose & it’s Not a trading advice.
I am not Sebi registered analyst.
My studies are for educational purpose only.
Please Consult your financial advisor before trading or investing.
I am not responsible for any kinds of your profits and your losses.
Most investors treat trading as a hobby because they have a full-time job doing something else.
However, If you treat trading like a business, it will pay you like a business.
If you treat like a hobby, hobbies don't pay, they cost you...!
Hope this post is helpful to community
Thanks
RK💕
Disclaimer and Risk Warning.
The analysis and discussion provided on in.tradingview.com is intended for educational purposes only and should not be relied upon for trading decisions. RK_Chaarts is not an investment adviser and the information provided here should not be taken as professional investment advice. Before buying or selling any investments, securities, or precious metals, it is recommended that you conduct your own due diligence. RK_Chaarts does not share in your profits and will not take responsibility for any losses you may incur. So Please Consult your financial advisor before trading or investing.
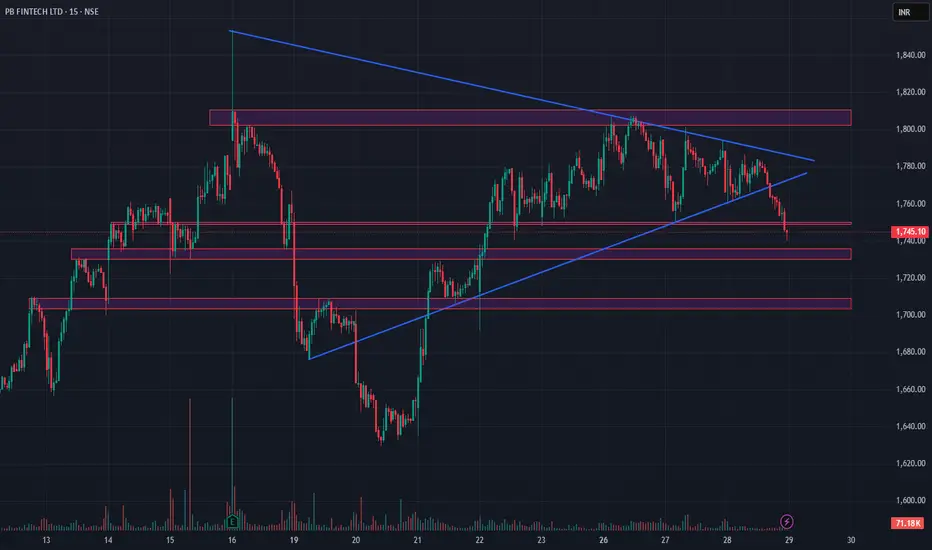
POLICYBZR — Triangle Breakdown + OI Clues = Short Bias?🧠 Breakdown: Symmetrical Triangle Breach + OI Data
PB Fintech has broken down from a well-formed symmetrical triangle, signaling a likely continuation of the bearish trend that started post-₹1,820 rejection.
🔻 Breakdown below trendline support confirms sellers are in control short term.
📐 Chart Structure Recap
Price formed a symmetrical triangle since mid-May.
Multiple support rejections along an ascending trendline.
Today, price convincingly broke down below ₹1,750–₹1,740, with volume spike confirmation.
Now trading near crucial support clusters, visible from past demand zones.
📊 OI Zones (Monthly Expiry)
🔺 Resistance:
₹1,780–₹1,800: Major call writing zone.
₹1,760: Added call writers post-breakdown.
🟢 Support:
₹1,740–₹1,720: Price hovering here — must hold.
₹1,700–₹1,680: Next significant put OI base.
₹1,660–₹1,620: Last buyer defense zone.
📌 Trade Plan (Short-Term View)
🔻 Bearish Setup (Short Bias):
• Entry: On breakdown retest near ₹1,745–₹1,750
• Stop Loss: Above ₹1,765
• Targets: ₹1,720 → ₹1,700
🔺 Bullish Setup (Reversal Possibility):
• Entry: On strong reclaim and hold above ₹1,760
• Stop Loss: Below ₹1,740
• Targets: ₹1,780 → ₹1,800
🎯 Summary
With both price action (triangle breakdown) and OI shifts (fresh calls at highs) aligning, PB Fintech may see further downside if it fails to reclaim the ₹1,745–₹1,750 zone quickly.
This is a great confluence case for intraday or short-swing setups. Patience for either a retest-reject or a reclaim-confirm will be key.
#NIFTY Intraday Support and Resistance Levels -29/07/2024Nifty will be gap up opening in today's session. After opening nifty sustain above 24890 level and then possible upside rally up to 25010 level in today's session. in case nifty trades below 24830 level then the downside target can go up to the 24710 level.

#NIFTY Intraday Support and Resistance Levels -23/07/2024Nifty will be gap up opening in today's session. After opening nifty sustain above 24550 level and then possible upside rally up to 24670 level in today's session. in case nifty trades below 24480 level then the downside target can go up to the 24360 level.

#NIFTY Intraday Support and Resistance Levels -24/06/2024Nifty will be gap down opening in today's session. After opening nifty start trading Below 23430 level and then possible downside rally up to 23310 in today's session. in case nifty trades Above 23480 level then the upside target can go up to the 23600 level.

#NIFTY Intraday Support and Resistance Levels -18/06/2024Nifty will be gap up opening in today's session. After opening nifty sustain above 23480 level and then possible upside rally up to 23600 level in today's session. in case nifty trades below 23430 level then the downside target can go up to the 23310 level.

#NIFTY Intraday Support and Resistance Levels -11/06/2024Nifty will be gap up opening in today's session. After opening nifty sustain above 23260 level and then possible upside rally up to 23380 level in today's session. in case nifty trades below 23200 level then the downside target can go up to the 23080 level.

#NIFTY Intraday Support and Resistance Levels -07/06/2024Nifty will be gap up opening in today's session. After opening nifty sustain above 22900 level and then possible upside rally up to 223020 level in today's session. in case nifty trades below 22830 level then the downside target can go up to the 22710 level.

#NIFTY Intraday Support and Resistance Levels -14/05/2024Nifty will be gap up opening in today's session. After opening nifty sustain above 22130 level and then possible upside rally up to 22250 level in today's session. in case nifty trades below 22090 level then the downside target can go up to the 21970 level.

#NIFTY Intraday Support and Resistance Levels -08/05/2024Nifty will be gap up opening in today's session. After opening nifty sustain above 22320 level and then possible upside rally up to 22440 level in today's session. in case nifty trades below 22280 level then the downside target can go up to the 22160 level.

#NIFTY Intraday Support and Resistance Levels -24/04/2024Nifty will be gap up opening in today's session. After opening nifty sustain above 22390 level and then possible upside rally up to 22510 level in today's session. in case nifty trades below 22330 level then the downside target can go up to the 22210 level.

#NIFTY Intraday Support and Resistance Levels -23/04/2024Nifty will be gap up opening in today's session. After opening nifty sustain above 22400 level and then possible upside rally up to 22530 level in today's session. in case nifty trades below 22330 level then the downside target can go up to the 22210 level.

Wipro New run is startingWipro is at cloud support on monthly charts & this could be taken as a great support for a big move. Can keel stop loss near 388 levels for target of 470 -540 & further new highs in long term.

Nifty Cup And Handle 2hIf Nifty breaks out of the neckline then we might see a rally till 20500-20800 but if there is a heavy rejection from the resistance area then there are supports(trendlines) drawn till where it may bleed to.
You may short or long it as the price action develops and a trendline in broken.
*Not a financial advice only for educational purposes*

#NIFTY Intraday Support and Resistance Levels -22/09/2023Nifty will be gap up opening in today's session. After opening nifty sustain above 19760 level and then possible upside rally up to 19880 in today's session. in case nifty trades below 19720 level then the downside target can go up to the 19600 level.

#NIFTY Intraday Support and Resistance Levels - 18/09/2023Nifty will be gap up opening in today's session. After opening nifty sustain above 20200 level and then possible upside rally up to 20320 in today's session. in case nifty trades below 20160 level then the downside target can go up to the 20040 level.

3 White Soldiers bullish breakout - ATH Chart Patterns,
1. Ascending Triangles - Weekly time frame ( March'22 to till date)
3. Retest Previous ATH Level, highlight with yellow color
4. 3 White Soldiers - Weekly time frame, depicts high bullish sentiment.
Nifty to reach 23k in next 12 months.

#NIFTY Intraday Support and Resistance Levels - 11/09/2023Nifty will be gap up opening in today's session. After opening nifty sustain above 19840 level and then possible upside rally up to 19960 in today's session. in case nifty trades below 19800 level then the downside target can go up to the 19680 level.

#NIFTY Intraday Support and Resistance Levels - 30/08/2023Nifty will be gap up opening in today's session. After opening nifty sustain above 19360 level and then possible upside rally up to 19480 in today's session. in case nifty trades below 19340 level then the downside target can go up to the 19220 level.

Nifty daily analysis for 30/08/23.Nifty is not taking the benefit of the gap up opening and is coming for selling from the very first candle. Though, the market recovered after falling and closed 36 points above, still there is sideway to volatile market.
Option sellers market is on as the volatility is taking away the premiums benefitting the sellers.
On the hourly charts, it took support multiple times from the 20 ema and has closed between both the moving averages.
Nifty today has traded in a range of 50 points and has formed a box consolidation. The market is giving less intraday opportunities. It will be good to let market decide the trend and trade accordingly.
On 15 minute time frame, it has closed between both the moving averages and regained 40 points in the last two candles.
Support :- 19310, 19250
Resistance :- 19350-380, 19480
Wait for the price action near the levels before entering the market.

Nifty daily analysis for 29/08/23.Nifty is still forming doji after doji. The market on the daily time frame is still below the moving average and in sideways mood.
On the hourly charts, market tested the support zone and tried to move up but took resistance from the 20 ema and gave a retracement after touch the levels. There is also an evening star pattern there.
Market slow tried to move upper but couldn't give some conviction as there was a rejection from 20 ema (60 minute) and 38.2% levels.
On 15 minute charts, nifty has closed below both the moving averages and is taking support around 19300 levels.
The market are showing some negative sentiments as it is taking resistance from the key levels.
Support :- 19250, 19180, 19000
Resistance :- 19380, 19480
Wait for the price action near the levels before entering the market.

Nifty weekly analysis for 21/08/23.Nifty of consecutive four weeks have been forming a red candle and is making a support zone around 19250-300 levels.
Market has tested another low this week but there is some buying happening around 19250 levels and it has been tested twice this week.
On daily charts, market has formed another doji which signifies a confusion in the markets. Nifty has been trading below 20 ema.
Nifty is around a crucial levels, if the support zone of 19250 is also breached then there are chances of market going to 18900-19000 levels as there is no support near by.
On the hourly charts, there is a bearish moving averages cross over and market is taking serious rejection from 200 and 20 EMAs.
Market is being volatile to sideways and there are chance of a trending market as it has been trading in a very small range.
Support :- 19260, 19180, 19000
Resistance :- 19360, 19460
Gap up and gap down are limiting opportunities for an intraday trader. Watch markets carefully and let market decide the trend.
Wait for the price action near the levels before entering the market.
