NIFTY – Detailed Intraday Trading Plan | 28 JAN 2026📊
Timeframe: 15-Min
Instrument: NIFTY (Index)
Gap Considered: 100+ Points
🔍 MARKET CONTEXT & STRUCTURE
NIFTY has shown volatile price action with sharp intraday swings, indicating active participation from both buyers and sellers.
The current structure suggests the market is transitioning from panic selling to selective buying, making key levels extremely important for the next session.
This plan is reaction-based, not prediction-based — we trade how price behaves at levels, not assumptions.
📌 IMPORTANT LEVELS FOR THE DAY
Opening Support Zone: 25,177 – 25,234
Opening Resistance: 25,327
Major Resistance / Profit Booking Zone: 25,469 – 25,508
Last Intraday Support: 25,030
🔼 SCENARIO 1: GAP UP OPENING (100+ POINTS) 🚀
A gap-up open signals short-covering or global support, but sustainability is key.
🟢 Bullish Continuation Plan
Price opens above 25,327
15-min candle closes above resistance
Retest of 25,327 holds as support
Upside targets: 25,469 → 25,508
🔴 Gap-Fill / Rejection Plan
Failure to sustain above 25,327
Long upper wicks / weak follow-through
Expect pullback towards 25,234
🧠 Trading Psychology:
Gap-up moves often trap late buyers near resistance. Acceptance above resistance confirms institutional participation.
➡️ SCENARIO 2: FLAT / NEUTRAL OPENING ⚖️
A flat open usually indicates indecision, leading to range-bound price action initially.
🟢 Upside Breakout Plan
Sustained price above 25,327
Volume expansion on breakout
Targets: 25,400 → 25,469
🔴 Downside Breakdown Plan
Breakdown below 25,177
Strong bearish 15-min candle
Targets: 25,100 → 25,030
🧠 Trading Psychology:
Flat opens create fake moves. Waiting for a 15-min confirmation avoids emotional entries and whipsaws.
🔽 SCENARIO 3: GAP DOWN OPENING (100+ POINTS) 📉
A gap-down open tests buyer strength immediately.
🟢 Support Hold / Pullback Buy
Price reacts positively from 25,177 – 25,234
Long lower wicks / higher-low structure
Bounce targets: 25,300 → 25,327
🔴 Breakdown Continuation
Acceptance below 25,177
Selling pressure increases
Targets: 25,030 → 24,950
🧠 Trading Psychology:
If key demand zones fail, sellers gain confidence and momentum accelerates.
🧠 OPTIONS TRADING STRATEGY (EDUCATIONAL)
Near resistance → Prefer Bull Call Spread, avoid naked CE buying
Inside range → Iron Condor / Short Strangle (low momentum)
Breakdown confirmed → Bear Put Spread
🛡 RISK MANAGEMENT RULES 🔐
Trade only after confirmation
Risk maximum 1–2% capital per trade
Avoid overtrading inside no-trade zones
Book partial profits near key levels
One setup = one trade
🧾 SUMMARY & CONCLUSION ✍️
25,177 – 25,234 is the most critical decision zone
Above 25,327 → buyers regain control
Below 25,177 → sellers dominate
Let price confirm direction — patience is the edge
Trade what you see, not what you feel 📊
⚠️ DISCLAIMER
This analysis is for educational purposes only.
I am not a SEBI registered analyst.
Markets involve risk — trade responsibly.
Niftyintradaylevels

NIFTY - Trading levels and Plan for 29-Jan-2026📊 NIFTY Trading Plan for 29-Jan-2026
(Educational & Level-Based | For Index Options Traders)
Market Principle to Remember:
Price reacts at zones where maximum traders are trapped, hedged, or emotionally committed.
Our job is not prediction — it is structured reaction 🧠📈
🟢 Scenario 1: GAP UP Opening (100+ Points) 🚀
Market Psychology:
A big gap-up often comes from overnight short covering or positive global cues. Retail traders chase breakouts emotionally, while smart money waits to sell premium or buy only after acceptance.
📌 Trading Plan:
🔹 Avoid buying immediately at market open
🔹 Let the first 15–30 minutes define direction
🔹 Mark opening range high & VWAP
🔹 Bullish bias only if price sustains above VWAP
🔹 Look for pullback + hold before Call buying
🔹 Prefer Bull Call Spread if IV is elevated
🔹 If price shows rejection near resistance, expect gap-fill or consolidation
🔹 Consider Bear Call Spread near strong resistance
🔍 Educational Insight:
Gap-up buyers are usually emotional. If price fails to sustain, institutions sell into strength, leading to sharp reversals.
🟡 Scenario 2: FLAT / RANGE Opening 😐
Market Psychology:
A flat open signals indecision. Big players wait for retail participation before initiating the real move.
📌 Trading Plan:
🔹 Mark Previous Day High (PDH) & Low (PDL)
🔹 First 30 minutes define the battle zone
🔹 Breakout with volume suggests directional move
🔹 Weak breakout often turns into a false trap
🔹 Use Straddle / Strangle near range boundaries
🔹 Deploy Iron Condor if price stays range-bound
🔹 Enter directional trade only after close + retest
🔍 Educational Insight:
Markets punish impatience. Flat opens reward traders who wait for confirmation, not anticipation.
🔴 Scenario 3: GAP DOWN Opening (100+ Points) 📉
Market Psychology:
Gap-down opens trigger panic selling. Weak hands exit early, while smart money waits for selling exhaustion.
📌 Trading Plan:
🔹 Do not sell Puts immediately at open
🔹 Observe opening candle size and volume spike
🔹 Watch how price behaves near key support zones
🔹 If support holds, expect a pullback or bounce
🔹 Buy Calls only after higher-low formation
🔹 If support breaks with volume, expect trend day down
🔹 Buy Puts on pullback toward resistance
🔹 Prefer Bear Put Spread for controlled risk
🔹 Use Call Credit Spread near resistance
🔍 Educational Insight:
Most gap-down moves start with fear but continue only when institutional selling confirms.
⚠️ Risk Management Tips for Options Traders 🛡️
🔹 Risk only 1–2% of total capital per trade
🔹 Avoid revenge trading after stop-loss hits
🔹 No fresh trades after 2:30 PM
🔹 Avoid naked option selling on event-driven days
🔹 Always check IV, Theta decay, and liquidity
🔹 Maintain minimum risk–reward of 1:2
🔹 Journal every trade — process > profits
🧠 Summary & Conclusion ✨
🔹 Gap openings offer opportunity but demand discipline
🔹 Structured trading beats emotional decisions
🔹 Price acceptance matters more than candle color
🔹 Options trading is a probability game, not prediction
🔹 Consistency comes from process, patience, and risk control
Trade like a risk manager first, trader second 💼📊
📜 Disclaimer ⚠️
This trading plan is shared strictly for educational purposes only.
I am not a SEBI registered analyst.
Trading in the stock market involves risk.
Please consult a certified financial advisor before taking any trades.

NIFTY Faces Pressure: Can 24,300 Hold?NIFTY has turned weak after falling around 2.5% on the weekly chart. The index has made a double top near 26,250, which usually means the market is finding it hard to move higher from that area.
On the weekly chart, the candles look bearish. NIFTY is currently holding near an important support around 25,000 (50 EMA). If this level breaks, the market may move lower towards 24,300 and even 23,900.
On the daily chart, NIFTY is trading below all major moving averages (20, 50, 100 & 200 EMA). In the past, whenever NIFTY stayed below these averages, it usually corrected further. Right now, there is no strong support before 24,600.
On the monthly chart, a double top is visible again, showing weakness at higher levels. However, there is decent support near 24,300–24,240, which is also close to the monthly 20 EMA.
Momentum is also weakening. RSI is showing bearish divergence on weekly and monthly charts, which suggests upside strength is fading.
Resistance Levels :- 25,200 – 25,300, 25,500, 26,250
Support Levels :- 24,987, 24,600, 24,300 – 24,240, 23,900
Overall View
As long as NIFTY stays below 25,500, the trend remains weak. Market direction will become clearer near the 24,300 support zone.

NIFTY : Trading levels and Plan for 20-Jan📘 NIFTY Trading Plan – 20 Jan 2026
Timeframe: 15-minute
Gap Criteria Considered: 100+ points
Market Structure: Short-term corrective phase after rejection from upper range, base formation near intraday support
🔼 SCENARIO 1: GAP UP OPENING (100+ points) 🚀
If NIFTY opens above 25,667, it signals bullish intent with short-covering momentum.
Immediate resistance zone lies at 25,667 – 25,682 (Opening / Last Resistance).
Sustained price acceptance above 25,682 on a 15-min close can trigger upside continuation.
Upside targets to watch:
• 25,740
• 25,791
Expect minor pullbacks near resistance; fresh longs only on pullback + hold above broken levels.
Avoid chasing gap-up candles without retest confirmation.
📌 Options Strategy (Gap Up):
• Bull Call Spread (ATM Buy + OTM Sell)
• Avoid naked CE buying near resistance
• Trail profits aggressively as volatility expands 📈
➡️ SCENARIO 2: FLAT / RANGE OPENING ⚖️
If NIFTY opens within 25,529 – 25,568, market enters a balance / no-trade zone.
This zone acts as Opening Support Zone for flat markets.
Expect whipsaws and fake breakouts initially.
Upside trade activates only above 25,682.
Downside pressure increases below 25,529.
Best environment for patience and structure-based entries.
📌 Options Strategy (Flat Market):
• Short Strangle / Iron Condor (only for experienced traders)
• Focus on theta decay ⏳
• Keep strict SL on breakout from range
🔽 SCENARIO 3: GAP DOWN OPENING (100+ points) 📉
If NIFTY opens below 25,529, bears gain control early.
First support zone is 25,422 – 25,364 (Intraday Demand Zone).
Expect a technical bounce, but trend remains weak below resistance.
Breakdown below 25,364 can open deeper downside.
Avoid bottom fishing until strong bullish reversal candle appears.
📌 Options Strategy (Gap Down):
• Bear Put Spread preferred
• Avoid aggressive PE selling in trending markets
• Quick scalps only, book fast 📉
🧠 Risk Management Tips for Options Trading 🛡️
Risk only 1–2% of capital per trade.
Expiry week = faster premium decay & sharp moves.
Prefer spreads over naked option buying.
No revenge trading after SL hits.
Always wait for 15-min structure confirmation before entry.
📌 Summary & Conclusion ✨
NIFTY is currently trading near a short-term balance zone.
📍 25,529 – 25,568 is the key decision-making area.
📍 Sustained move above 25,682 may revive bullish momentum.
📍 Below 25,529, downside risk increases sharply toward 25,422.
Trade light, respect levels, and let price confirm direction.
⚠️ Disclaimer
This content is for educational purposes only.
I am not a SEBI registered analyst.
Markets are uncertain, and I can be wrong.
Please consult your financial advisor before trading.

NIFTY : Trading levels and Plan for 08-Jan-2026NIFTY Trading Plan for 8-Jan-2026
(Timeframe: 15-min | Gap criteria: 100+ points)
🔑 Key Reference Levels (from chart)
Upper Resistance / Extension: 26,412 – 26,415
Last Intraday Resistance: 26,308
Opening Resistance / No-Trade Zone: 26,184 – 26,220
Immediate Pivot (CMP area): ~26,143
Opening Support: 26,080
Last Intraday Support: 26,042
Buyer’s Support Zone: 25,904 – 25,931
🧠 Market context: After a strong up-move, NIFTY corrected and is now trading below a major resistance band (26,184–26,220). This zone is crucial—expect choppy price action unless there is a clean acceptance above or rejection below.
🟢 1. GAP-UP OPENING (100+ Points)
If NIFTY opens above 26,220, bulls appear strong but face immediate supply.
🎓 Educational View
Gap-ups near resistance often trap late buyers. Sustainable upside needs holding above resistance, not just a spike.
Plan of Action
Avoid first 10–15 minutes; observe price behavior.
Sustain above 26,220 → move toward 26,308.
Acceptance above 26,308 opens path to 26,412–26,415.
Repeated rejection near 26,308 → expect pullback to 26,220 → 26,184.
Options idea: Bull Call Spread (ATM Buy + OTM Sell) to control theta.
🟡 2. FLAT OPENING
If NIFTY opens between 26,080 – 26,220, expect range-bound & whipsaw moves.
🎓 Educational View
Flat opens near a supply zone reflect indecision. Direction comes only after range expansion + volume.
Plan of Action
Above 26,220 → bullish bias toward 26,308.
Failure near 26,220 keeps market rotating inside the range.
Break & sustain below 26,080 → weakness toward 26,042.
Avoid over-trading inside the no-trade zone.
Options idea: Iron Fly / Narrow Strangle (small size) if range persists.
🔴 3. GAP-DOWN OPENING (100+ Points)
If NIFTY opens below 26,080, sentiment turns cautious.
🎓 Educational View
Gap-downs into support zones can trigger panic selling, followed by either short covering or continuation—confirmation is key.
Plan of Action
First support to watch: 26,042.
Break & hold below 26,042 → decline toward 25,931 → 25,904.
Strong bullish rejection from 26,042–26,080 may offer bounce trades.
Avoid aggressive shorts directly at buyer’s zone.
Options idea: Bear Put Spread instead of naked puts.
🛡️ Risk Management Tips (Options Trading)
Risk only 1–2% of capital per trade.
Prefer spreads near resistance/support to manage theta decay.
Use time-based exits if premium stagnates for 15–20 mins.
Book partial profits early; trail the rest 📉📈
One bad trade ≠ revenge trading 🚫
🧾 Summary & Conclusion
Above 26,220: Bulls regain control → 26,308 → 26,412
26,080–26,220: Choppy zone → patience is key
Below 26,080: Weakness toward 26,042 → 25,931
Trade price reaction at levels, not predictions 🎯
⚠️ Disclaimer
I am not a SEBI-registered analyst. This analysis is strictly for educational purposes only. Markets involve risk—please consult a certified financial advisor before trading.

NIFTY : Trading levels and Plan for 24-Dec-2025NIFTY Trading Plan for 24-Dec-2025
(Chart reference: 15-min | Gap criteria considered: 100+ points)
Key Levels to Track (from chart)
Opening Resistance: 26,266
Last Intraday Resistance: 26,341
Major Upside Resistance: 26,426
Opening Support / Resistance (Pivot): 26,165
Opening Support (Gap-down reference): 26,098
Last Intraday Support: 26,030
Lower Support: 25,919.85
🟢 1. GAP-UP OPENING (100+ Points)
If NIFTY opens above 26,266, price starts the session near a known supply zone.
🎓 Educational Explanation:
A gap-up above resistance shows bullish sentiment, but supply zones attract profit booking. Professional traders wait for acceptance above resistance or a retest before entering. Chasing price at the open often gives poor risk-reward.
Plan of Action:
If price sustains above 26,266 for 10–15 minutes, look for pullback-based long entries.
First upside target is 26,341 (last intraday resistance).
Acceptance above 26,341 can extend the move toward 26,426.
Rejection or exhaustion near 26,341–26,426 may lead to a pullback toward 26,266.
Option buyers should prefer ATM / ITM Calls only after confirmation, not on opening spikes.
🟡 2. FLAT OPENING
A flat open around 26,140–26,200 keeps NIFTY near the opening pivot (26,165).
🎓 Educational Explanation:
Flat opens indicate balance between buyers and sellers. Direction usually emerges only after the opening range is broken. Trading inside this zone without confirmation often results in whipsaws.
Plan of Action:
Sustaining above 26,165 keeps bullish bias intact, targeting 26,266 → 26,341.
Failure to hold 26,165 increases downside risk toward 26,098.
Bullish rejection near 26,098 offers a low-risk bounce trade back to 26,165.
Breakdown and acceptance below 26,098 shifts momentum toward 26,030.
🔴 3. GAP-DOWN OPENING (100+ Points)
If NIFTY opens below 26,098, early sentiment turns cautious to bearish.
🎓 Educational Explanation:
Gap-down openings are often driven by fear. However, strong demand zones attract short-covering and positional buying. Selling blindly into support increases the probability of getting trapped.
Plan of Action:
First support to watch is 26,030 — observe candle structure and volume.
Breakdown below 26,030 opens the downside toward 25,919.85.
Strong bullish reversal signals near 25,919.85 may lead to a sharp intraday bounce.
Any pullback toward 26,098 after a breakdown can be used as a selling-on-rise opportunity.
⚙️ Risk Management Tips for Options Traders 🛡️
Avoid trading in the first 5–10 minutes during gap openings.
Do not buy options at resistance or sell at support without confirmation.
Use time-based stop-loss (15–20 minutes) if premium doesn’t move.
Risk only 1–2% of capital per trade.
Prefer ATM options or defined-risk spreads to control theta decay.
Book partial profits near key resistance/support levels.
🧾 Summary & Conclusion
Above 26,266: Bulls remain active; targets 26,341 → 26,426.
Between 26,098–26,266: Market remains balanced; patience is essential.
Below 26,098: Sellers gain control unless buyers defend 26,030 / 25,919.85.
Focus on price behaviour at predefined levels, not prediction.
Consistency comes from discipline, confirmation, and risk control.
⚠️ Disclaimer
I am not a SEBI-registered analyst. This trading plan is for educational purposes only and should not be considered financial or investment advice. Please consult your financial advisor before taking any trades.

NIFTY : Trading levels and Plan for 22-Dec-2025NIFTY Trading Plan for 22-Dec-2025
(Chart reference: 15-min | Gap criteria considered: 100+ points)
Key Levels from Chart
Opening Pivot (Support / Resistance): 25,985
Opening Support Zone: 25,858 – 25,891
Last Intraday Support: 25,808
Buyer’s Support Zone: 25,640 – 25,672
Last Intraday Resistance: 26,100 – 26,137
🟢 1. GAP-UP OPENING (100+ Points)
If NIFTY opens above 25,985, price enters a positive momentum structure but near overhead supply.
🎓 Educational Explanation:
A gap-up above a key pivot reflects bullish overnight sentiment. However, markets often pause near prior resistance zones as early longs book profits. A sustained move above resistance is healthier than a straight vertical rally.
Plan of Action:
If price sustains above 25,985 for 10–15 minutes, look for pullback-based long entries.
Upside momentum can extend toward 26,100 – 26,137, a strong supply zone.
Acceptance above 26,137 may trigger trend continuation; manage trades with trailing SL.
Rejection from 26,100 – 26,137 can lead to a pullback toward 25,985.
Option buyers should avoid chasing CE at the open; enter only after retest confirmation.
🟡 2. FLAT OPENING
A flat open near 25,940 – 25,980 keeps NIFTY inside the balance zone.
🎓 Educational Explanation:
Flat opens indicate equilibrium between buyers and sellers. Direction emerges only after a breakout or breakdown of the opening range. Trading without confirmation in such conditions often leads to whipsaws.
Plan of Action:
Sustaining above 25,985 turns sentiment bullish, targeting 26,100 – 26,137.
Failure to hold 25,985 keeps price vulnerable to a decline toward 25,891 – 25,858.
Strong bullish rejection near 25,858 – 25,891 offers low-risk bounce trades.
Breakdown below 25,858 shifts control to sellers for a move toward 25,808.
🔴 3. GAP-DOWN OPENING (100+ Points)
If NIFTY opens below 25,858, early sentiment turns weak.
🎓 Educational Explanation:
Gap-down openings often trigger emotional selling. However, strong demand zones frequently attract buyers and short-covering. Selling blindly into support increases risk.
Plan of Action:
First support to watch is 25,808 — observe price behaviour closely.
A breakdown below 25,808 exposes the Buyer’s Support Zone: 25,640 – 25,672.
Bullish reversal patterns in 25,640 – 25,672 can lead to a recovery toward 25,858.
Any pullback toward 25,858 after breakdown becomes a selling-on-rise opportunity.
⚙️ Risk Management Tips for Options Traders 🛡️
Avoid trading the first 5–10 minutes during gap days.
Do not buy options near resistance or sell near support without confirmation.
Use time-based stop loss (15–20 minutes) if the premium doesn’t move.
Risk only 1–2% of capital per trade.
Prefer ATM options or spreads to reduce theta decay.
Book partial profits near marked resistance/support zones.
🧾 Summary & Conclusion
Above 25,985: Bulls stay active; targets 26,100 – 26,137.
Between 25,858 – 25,985: Market remains range-bound; patience is key.
Below 25,858: Sellers gain control unless buyers defend 25,808 / 25,640–25,672.
Focus on price behaviour at levels, not prediction.
Consistency comes from discipline, not over-trading.
⚠️ Disclaimer
I am not a SEBI-registered analyst. This trading plan is for educational purposes only and should not be considered financial or investment advice. Please consult your financial advisor before taking any trades.

NIFTY : Trading levels and Plan for 18-Dec-2025📘 NIFTY Trading Plan for 18-Dec-2025
(Timeframe reference: 15-min | Gap criteria: 100+ points)
Key Levels to Track (from chart):
Opening Resistance: 25,876
Last Intraday Resistance: 25,969 – 25,994
Higher Supply Zone: 26,080 – 26,140
Opening Support: 25,748 – 25,768
Last Intraday Support (Buyer’s Zone): 25,594 – 25,647
🟢 1. GAP-UP OPENING (100+ Points)
If NIFTY opens above 25,876, price directly enters the short-term resistance structure.
🎓 Educational Explanation:
A gap-up above resistance indicates overnight bullish sentiment, but such openings often attract profit booking by early buyers. Markets usually attempt to retest breakout zones before deciding continuation or reversal. Chasing price without confirmation increases risk.
Plan of Action:
If price sustains above 25,876 for 10–15 minutes, look for pullback-based long entries.
Upside targets remain 25,969–25,994, where supply is expected.
Strong breakout and acceptance above 25,994 can open the path toward 26,080–26,140.
Rejection or exhaustion candle near 25,994 may trigger a pullback toward 25,876.
Option buyers should prefer ATM/ITM calls only after retest confirmation, not at the opening spike.
🟡 2. FLAT OPENING
A flat open near 25,800–25,830 keeps NIFTY inside a balance zone.
🎓 Educational Explanation:
Flat opens are decision-making zones. Direction emerges only after buyers or sellers show commitment. The first 30 minutes form the intraday structure, and trading without confirmation leads to whipsaws.
Plan of Action:
Sustaining above 25,876 turns sentiment bullish, targeting 25,969–25,994.
Failure to cross 25,876 keeps price range-bound and vulnerable to pullbacks.
Breakdown below 25,768 shifts control to sellers, opening downside toward 25,647–25,594.
Bullish reversal patterns near 25,748–25,768 can offer low-risk long setups.
🔴 3. GAP-DOWN OPENING (100+ Points)
If NIFTY opens below 25,748, market sentiment turns cautious.
🎓 Educational Explanation:
Gap-downs are often emotion-driven. Initial selling pressure may look strong, but strong demand zones attract positional buyers. Smart traders wait for price behaviour at support instead of selling into panic.
Plan of Action:
First reaction zone: 25,594 – 25,647 (Buyer’s must-try zone).
Look for strong rejection candles or bullish divergence for bounce trades.
If price sustains below 25,594, weakness may extend further—avoid aggressive longs.
Any pullback toward 25,748–25,768 after breakdown becomes a selling-on-rise opportunity.
⚙️ Risk Management Tips for Options Traders 🛡️
Avoid trading in the first 5–10 minutes during gap openings.
Do not buy options at resistance or sell at support—wait for confirmation.
Use time-based stop loss (15–20 minutes) if premium doesn’t move.
Risk only 1–2% of capital per trade.
Prefer spreads or ATM options during high IV sessions.
Protect profits aggressively near resistance zones.
🧾 Summary & Conclusion
Above 25,876: Bulls stay active, targets 25,994 and above.
Between 25,768–25,876: Market remains indecisive—patience required.
Below 25,748: Sellers gain control unless strong demand emerges at 25,594.
Focus on structure, confirmation, and disciplined risk, not prediction.
Best trades come from waiting, not reacting emotionally.
⚠️ Disclaimer
I am not a SEBI-registered analyst. This trading plan is purely for educational purposes and should not be considered as financial or investment advice. Please consult your financial advisor before taking any trades.

NIFTY : Trading levels and Plan for 04-Dec-2025📊 NIFTY TRADING PLAN — 04 DEC 2025
Current market context:
Price is hovering near 25,981, sitting just below key intraday levels. The index showed a late recovery on 3rd Dec, but still remains inside a broader corrective structure. Tomorrow’s opening reaction near the Opening Support (25,953) and Opening Resistance (26,020) will set the tone for the session.
Below is the complete trading plan based only on the marked levels in your chart.
🚀 1. GAP-UP OPENING (100+ points)
A strong gap-up above 26,020 indicates early bullish strength and short-covering. However, note that price will immediately approach the Last Intraday Resistance Zone: 26,094–26,119, which has been a major rejection zone earlier.
1. Opening above 26,020 → Look for Retest Entry
• Avoid chasing a gap-up candle.
• Wait for price to retest 26,020, show wicks / bullish engulfing / CHoCH reversal.
• If retest holds → Upside targets toward 26,160 → 26,224.
• This is safest because it confirms buyer presence.
2. If gap-up directly opens inside 26,094–26,119 (resistance box)
• Avoid long entries.
• Expect sellers to react.
• Look for rejection wicks & bearish structure shift.
• Short trades are only valid if price breaks below 26,020 after rejection.
3. Bullish Continuation Above 26,119
• If the resistance box breaks with strong momentum → Trend continuation.
• Next immediate upside: 26,160 → 26,224 (chart-projected path).
📌 Educational Note:
Gap-up openings often trap late buyers. A retest is safe because it confirms that the gap is being accepted by the market.
⚖ 2. FLAT OPENING (±50 points around 25,980)
Flat opens near Opening Support (25,953) or Opening Resistance (26,020) offer the best price-action trades.
1. If price holds 25,953 and forms higher-lows
• Buyers defending strongly.
• Look for bullish structure → Target 26,020 → 26,094.
• Sustained breakout above 26,020 gives a clean intraday long.
2. If price rejects 26,020
• Watch for bearish engulfing / rejection wicks.
• First downside target: 25,953
• Break below this → Trend may shift bearish for the day.
3. Range Day Setup
If price stays between 25,953–26,020, trade only extremes:
• Buy near 25,953 (only on confirmation).
• Sell near 26,020 (only on confirmation).
📌 Educational Note:
Flat opens are the most reliable for retail traders because structure is clearer and volatility is normal.
📉 3. GAP-DOWN OPENING (100+ points)
A gap-down into the Last Intraday Buyer Support (25,732–25,798) signals fear, stop-run liquidity, and possible reversal zones.
1. If price opens inside 25,732–25,798
• DO NOT short the open.
• This zone is where buyers previously defended.
• Look for reversal: hammer candle, divergence, or CHoCH.
• If reversal signs appear → Long trade targeting 25,953 → 26,020.
2. If price breaks below 25,732
• This is bearish continuation.
• Only short on retest of the broken zone.
• Downside targets: 25,680 → 25,640 (chart-projected bearish path).
3. If price recovers quickly from the gap-down
• V-shape reversals are common in strong markets.
• Once above 25,798, bullish continuation toward 25,953 → 26,020.
📌 Educational Note:
Gap-downs often sweep liquidity and reverse sharply. Confirmation is crucial before entering any trade.
🛡 RISK MANAGEMENT TIPS FOR OPTIONS TRADERS
1. Avoid buying options in the first 5–10 minutes after a gap opening. Volatility crush can hurt premiums.
2. Always define your stop-loss based on price levels, not premium. Price levels are more stable.
3. Avoid trading against major zones (resistance/support).
4. Use position sizing:
Never risk more than 1–2% of your trading capital on a single trade.
5. If IV is high → Prefer selling strategies.
If IV is low → Buying options becomes more efficient.
6. Don’t revenge trade. If levels break unexpectedly, step aside and re-plan.
📌 SUMMARY & CONCLUSION
• Bullish bias only above 26,020 → 26,094
• Range-bound between 25,953–26,020
• Strong reversal zone at 25,732–25,798 on gap-down
• Gap openings must always be traded with retests, not predictions
• Focus on market structure and reactions at these marked levels
Trade with discipline, follow levels, and avoid over-positioning during high volatility.
⚠ DISCLAIMER
I am not a SEBI-registered analyst.
This trading plan is for educational purposes only and not investment advice.
Market conditions can change rapidly—always use your own judgment and risk management.

NIFTY : Trading levels and Plan for 24-Nov-2025📊 NIFTY TRADING PLAN — 24 NOV 2025
(Reference: 15-min chart structure & mapped intraday levels)
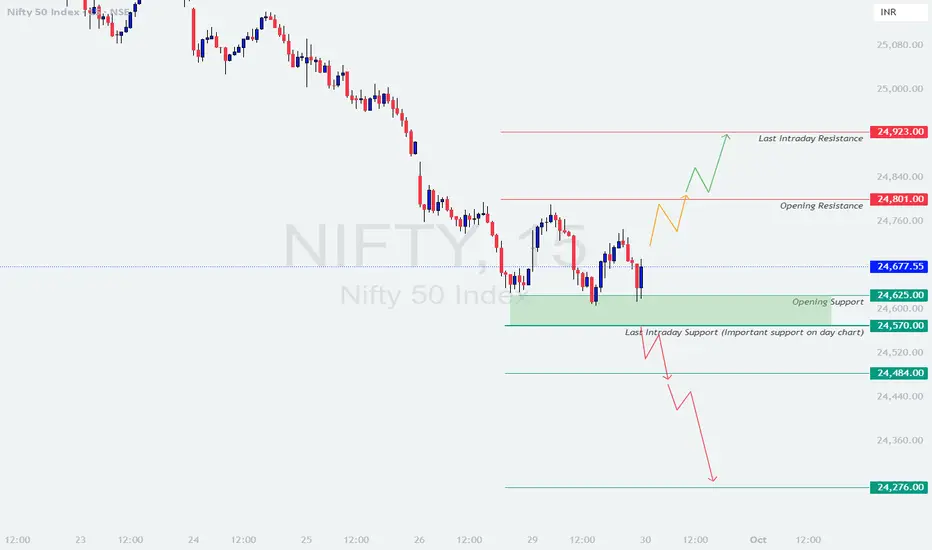
Nifty closed near 26,064, sitting just below the Opening Support / Resistance Zone (26,097–26,108).
The recent fall has brought price into a critical region where buyers and sellers will fight for control, making tomorrow’s open highly important.
🔑 Key Levels
🟥 Last Intraday Resistance: 26,195
🟥 Major Resistance: 26,307
🟧 Opening S/R Zone: 26,097 – 26,108
🟩 Opening Support Zone (Gap-Down Case): 25,973 – 25,992
🟩 Last Intraday Support: 25,940
🟩 Deep Support: 25,813
Below is the complete scenario-wise actionable plan 👇
🟢 SCENARIO 1 — GAP-UP OPENING (100+ points)
If Nifty opens around 26,160–26,210, price immediately tests the Last Intraday Resistance (26,195).
If price sustains above 26,195 for 10–20 mins with strong green candles →
🎯 Upside targets → 26,240 → 26,275 → 26,307
If price rejects 26,195 with long wicks →
Expect correction toward 26,120 → 26,097
A bullish retest at 26,097–26,108 can offer a low-risk long entry.
Avoid chasing the breakout candle—gap-ups near resistance often create bull traps.
📘 Educational Note:
Gap-up trades work best when price forms higher lows immediately after opening. A sideways or weak first 5–15 mins signals exhaustion.
🟧 SCENARIO 2 — FLAT OPENING (Near 26,050–26,100)
This puts price directly inside the Opening S/R Zone (26,097–26,108) — a decision-making region.
A clean breakout above 26,108 with a retest →
🎯 Targets → 26,150 → 26,195
On breakdown below 26,050, expect a drop toward:
➡️ 25,992 → 25,973
Avoid trading inside 26,050–26,108 zone initially; wait for direction clarity.
Best trend trades will come from:
— Breakout → Retest → Continuation
— Support bounce from 25,973–25,992
💡 Educational Tip:
Flat opens often give clean directional plays once the first 15-min candle closes. Patience pays.
🔻 SCENARIO 3 — GAP-DOWN OPENING (100+ points)
A gap-down into 25,973–25,992 brings price directly into strong support.
If 25,973–25,992 holds with bullish wick rejection →
🎯 Upside targets → 26,020 → 26,063 → 26,108
If price breaks below 25,973, next strong support is:
➡️ 25,940 (Last Intraday Support)
If 25,940 also fails → expect deeper fall toward 25,813
A sharp V-shaped reversal from 25,813 can become the best long trade of the day.
📘 Educational Note:
Gap-downs into major supports often produce intraday reversals—but only after confirming rejection with strong candles.
💼 RISK MANAGEMENT TIPS FOR OPTION TRADERS 💡
Avoid trading the first 5–10 minutes after open.
Prefer ATM/ITM options for directional moves.
Always predefine your SL—don’t widen it emotionally.
Never average losing trades.
When VIX is low → option buying works better.
When VIX is high → use spreads or hedged selling.
Book profits in parts to lock in gains during reversals.
⚠️ Golden Rule:
Protect capital first—opportunities come every day.
📌 SUMMARY
Bullish above → 26,108
🎯 Targets → 26,150 → 26,195 → 26,240 → 26,307
Bearish below → 25,992
🎯 Targets → 25,973 → 25,940 → 25,813
No-Trade Zones:
— 26,050–26,108 (choppy decision zone)
— 26,175–26,195 (high-risk supply zone)
🧾 CONCLUSION
Nifty sits near a sensitive reversal region.
Tomorrow’s trend depends entirely on how price reacts to:
✔️ 26,108 breakout
✔️ 25,973 support
The safest and highest-quality trades will come from retests, not impulsive entries.
Let the market reveal direction before you act.
⚠️ DISCLAIMER
I am not a SEBI-registered analyst.
This analysis is purely for educational purposes.
Please consult a certified financial advisor before trading or investing.
NIFTY - Trading levels and Plan for 19-Nov-2025📊 NIFTY TRADING PLAN — 19 NOV 2025
(Reference: 15-Minute Chart)
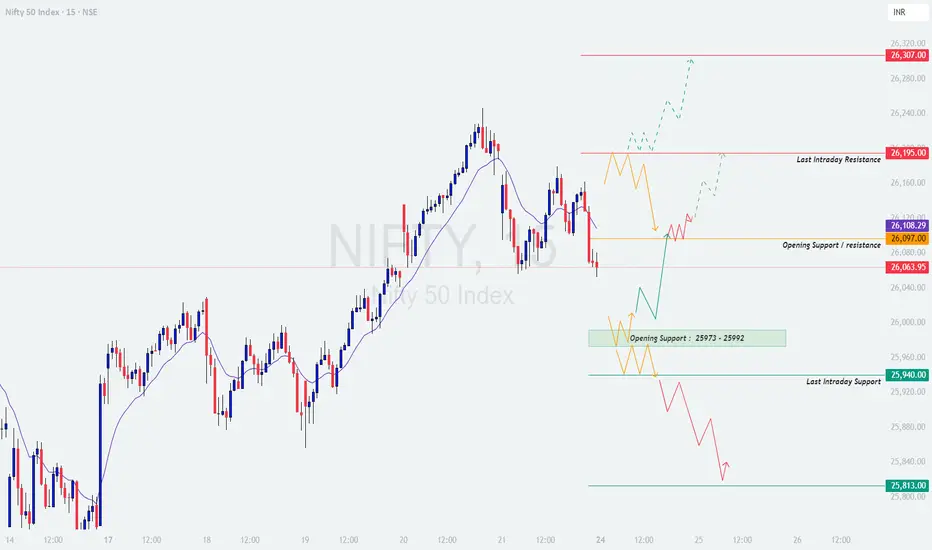
Nifty closed near 25,894 with a clear rejection from higher levels and is now sitting just above the crucial Opening Resistance (25,933) . The short-term trend remains mixed, and the market is positioned between two critical zones:
🟩 Opening Support Zone: 25,838 – 25,811
🟩 Last Intraday Support: 25,663 – 25,704
🟥 Opening Resistance: 25,933
🟥 Gap-up Opening Resistance: 26,062
🟥 Major Resistance: 26,194
This structure indicates that Nifty could either attempt a recovery toward 26,050+ or continue a pullback toward 25,700 levels depending on opening behavior.
Below is a detailed plan for all three opening scenarios 👇
---
🟢 SCENARIO 1: GAP-UP OPENING (100+ Points)
If Nifty opens above 26,000 – 26,050 , it will immediately test the Gap-Up Opening Resistance (26,062) , which is a highly reactive supply zone.
If price sustains above 26,062 for 15–20 minutes with good volume, a breakout is confirmed → Target zone:
➡️ 26,120 → 26,194
If price rejects from 26,062, expect a pullback to the Opening Resistance (25,933) .
A retest of 25,933 followed by a bullish candle offers a safe long entry.
Avoid buying immediately at open — gap-up near resistance often traps traders.
🧠 Educational Note:
Gap-ups work well only when follow-through volume confirms strength. If candles are small-bodied or wicks are long at resistance, it indicates exhaustion rather than continuation.
---
🟧 SCENARIO 2: FLAT OPENING (Near 25,880 – 25,930)
A flat opening keeps Nifty exactly at the Opening Resistance (25,933) , turning this level into a decision zone.
A break and sustained close above 25,933 → Targets:
➡️ 26,000 → 26,062 → 26,120
If Nifty fails to cross 25,933 and strongly reverses, expect a dip into the Opening Support (25,838–25,811) .
Only buy after a clean breakout or strong bullish reversal from the support zone.
Avoid trading inside the 25,880–25,930 congestion area in the first 15–20 minutes.
💡 Educational Tip:
Flat openings allow the market to “choose a side.” The best trades come after the breakout of the first 15-min range — not before it.
---
🔴 SCENARIO 3: GAP-DOWN OPENING (100+ Points)
A gap-down near 25,820 – 25,780 pushes Nifty directly into the Opening Support (25,838–25,811) or possibly the Last Intraday Support (25,663–25,704) .
If price holds 25,811 and forms a bullish reversal pattern → Target recovery toward:
➡️ 25,900 → 25,933 → 26,000
If price breaks below 25,811, next support zone is:
➡️ 25,663 – 25,704
A bounce from this zone can offer an excellent low-risk long entry.
If 25,663 breaks decisively with volume → Trend may turn bearish for the day toward 25,580 – 25,520 .
📘 Educational Insight:
Gap-downs near major supports usually give the best reversal trades of the day — but only after confirmation. Never buy blindly expecting a bounce.
---
💼 RISK MANAGEMENT TIPS FOR OPTION TRADERS 💡
Never trade the first 5–10 minutes — wait for trend clarity.
Use ITM or ATM options for directional trades; avoid far OTM unless trend is strong.
Always place a strict stop-loss (15–25 points for options).
Book partial profits after the trade moves 40–50 points in your favor.
Do not average losing trades — exit and re-enter only with confirmation.
When VIX is high → prefer option selling with hedges.
When VIX is low → prefer buying options; avoid selling naked premium.
⚠️ Golden Rule:
Protect your capital. A missed opportunity is better than a forced loss.
---
📈 SUMMARY
Above 25,933 → Bullish toward 26,062 → 26,120 → 26,194
Below 25,838 → Weakness toward 25,811 → 25,704 → 25,663
Major trend level for the day:
➡️ Bullish above 25,933
➡️ Bearish below 25,811
No-trade zones:
➡️ 25,880–25,930 (Flat opening congestion)
---
📚 CONCLUSION
Nifty is positioned at a critical pivot ahead of 19th November. A move above 25,933 can revive bullish momentum, while rejection here may drag it toward the support zones.
The best trades will come from:
✔️ Breakout–retest setups
✔️ Confirmed reversals from marked support zones
✔️ Avoiding early trades in congestion
Trade the reaction, not the prediction. Let the market show you its intention before you commit.
---
⚠️ DISCLAIMER
I am not a SEBI-registered analyst . This analysis is purely for educational purposes . Please consult a certified financial advisor before trading or investing.
NIFTY : Trading levels and Plan for 18-Nov-2025📊 NIFTY TRADING PLAN — 18 NOV 2025
(Timeframe Reference: 15-Min Chart)
Chart Summary:
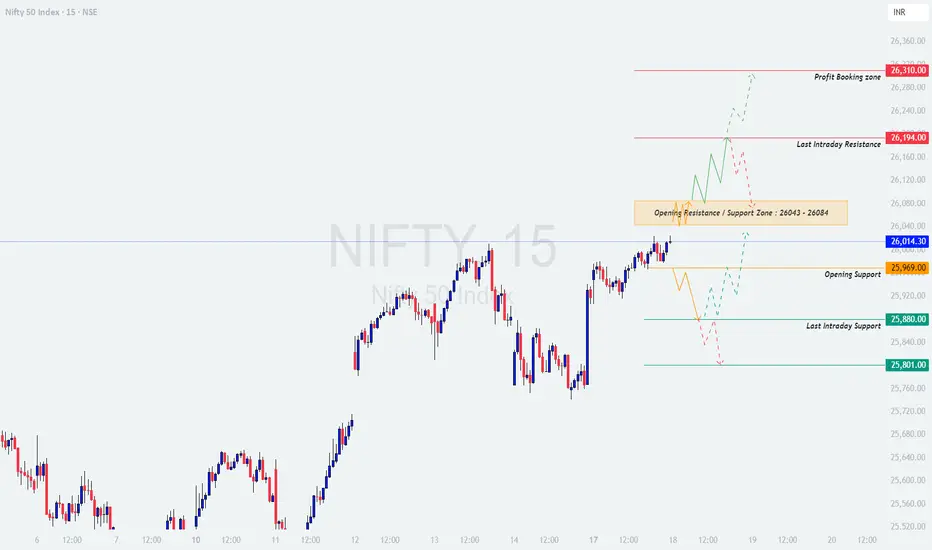
Nifty closed near 26,014 , maintaining a strong recovery momentum with higher highs formation. The index is currently hovering just below the Opening Resistance / Support Zone (26,043 – 26,084) , suggesting that 18th November could be a pivotal session for short-term trend continuation or reversal.
Immediate resistance is visible at 26,194 (Last Intraday Resistance) and a Profit Booking Zone near 26,310 . On the downside, the nearest supports are located at 25,969 (Opening Support) and 25,880 – 25,801 (Last Intraday Support Zone) .
The structure favors a bullish bias as long as price sustains above 25,969 , but traders should remain cautious around higher resistances where profit-taking may emerge.
Key Zones to Watch:
🟩 Supports: 25,969 / 25,880 / 25,801
🟥 Resistances: 26,084 / 26,194 / 26,310
⚖️ Bias: Bullish above 26,084 | Bearish below 25,969
🟢 Scenario 1: GAP-UP Opening (100+ Points)
If Nifty opens around 26,120 – 26,180 , it will start near the Last Intraday Resistance (26,194) . Such openings near resistance often cause early hesitation or consolidation before direction becomes clear.
If price sustains above 26,194 for 15–20 minutes with strong volume, expect a quick move toward the Profit Booking Zone (26,310) .
A breakout above 26,194 followed by a successful retest offers a low-risk buying opportunity for 26,270–26,310 targets.
If rejection candles (like upper wicks or bearish engulfing) appear near 26,194 – 26,310 , expect a short-term pullback toward 26,084 – 26,000 .
Avoid chasing the initial gap-up rally; instead, wait for price to confirm strength or provide a retest entry.
💡 Educational Insight:
Gap-up openings near resistance zones test trader psychology. Retail traders often buy impulsively at highs — professionals wait for confirmation of sustained strength. Always let price action validate breakout continuation before committing capital.
🟧 Scenario 2: FLAT Opening (Around 26,000 – 26,040 Zone)
A flat opening near 26,014 keeps Nifty right within the Opening Resistance / Support Zone (26,043 – 26,084) . This zone acts as a decision point — a breakout could continue bullish momentum, while rejection could trigger short-term correction.
If the index sustains above 26,084 , expect bullish continuation toward 26,194 – 26,310 .
If the index faces rejection and falls below 25,969 , a short-term retracement toward 25,880 – 25,801 is likely.
Avoid taking trades inside 26,000 – 26,080 initially — this zone may witness indecision.
Wait for a strong directional candle close outside the range for trade confirmation.
🧠 Educational Tip:
Flat openings are common near key inflection zones. Avoid being the first to act — let the first 15 minutes set the tone. Volume-backed breakouts from such zones often lead to sustained moves.
🔴 Scenario 3: GAP-DOWN Opening (100+ Points)
If Nifty opens around 25,900 – 25,850 , it will open below the Opening Support (25,969) and closer to the Last Intraday Support Zone (25,880 – 25,801) . This area will be critical to watch for either a quick reversal or extended weakness.
If reversal candles (hammer or bullish engulfing) appear near 25,880 – 25,801 , expect a recovery toward 26,000 – 26,043 .
If the price fails to sustain above 25,880 , bearish momentum may drag Nifty toward 25,700 – 25,600 .
Avoid panic shorting after gap-downs — let the market test supports first.
Watch for volume divergence: if selling volume declines near support, it signals exhaustion and possible intraday reversal.
📘 Educational Note:
Gap-down openings are emotional traps for retail participants. Professionals focus on reaction, not the gap itself. A strong bounce from support zones often provides safer and more rewarding opportunities than chasing fear-driven momentum.
💼 RISK MANAGEMENT TIPS FOR OPTIONS TRADERS:
Avoid trading during the first 15 minutes of market open — volatility is highest and direction unclear.
Never risk more than 1–2% of your capital per trade .
Use ATM or slightly ITM options for directional trades — they move more effectively with price.
Trail stop-loss once the position gains 30–40 points in your favor — protect profits.
Book partial profits at intermediate zones (like 26,084 / 26,194) and hold the rest with SL.
Avoid averaging losing trades — discipline is key.
When in doubt or volatility spikes unexpectedly, step aside; missing a trade is better than forcing one.
⚠️ Golden Rule:
Focus on capital protection over profit chasing . Consistency builds wealth — not aggression.
📈 SUMMARY:
🟩 Key Supports: 25,969 / 25,880 / 25,801
🟥 Key Resistances: 26,084 / 26,194 / 26,310
⚖️ Bias: Bullish above 26,084 | Bearish below 25,969
🎯 Intraday Levels to Watch:
- Breakout above 26,084 → Target 26,194 → 26,310
- Breakdown below 25,969 → Target 25,880 → 25,801
📚 CONCLUSION:
Nifty stands at a critical juncture, oscillating just below major resistance. A breakout above 26,084 can open the path toward 26,310 , while a breakdown below 25,969 may trigger intraday profit booking toward 25,880 – 25,801 .
For 18th November, the key lies in the opening reaction — whether the market builds on momentum or witnesses short-term exhaustion. Stay disciplined, trade only post-confirmation, and align your direction with trend and volume.
📊 Trading success lies not in predicting the move, but in reacting wisely to what unfolds.
⚠️ DISCLAIMER:
I am not a SEBI-registered analyst . The views shared here are purely for educational and informational purposes . Please conduct your own analysis or consult a certified financial advisor before making any trading or investment decisions.
NIFTY : Trading levels and Plan for 17-Nov-2025📊 NIFTY TRADING PLAN — 17 NOV 2025
(Timeframe Reference: 15-Min Chart)
Chart Summary:
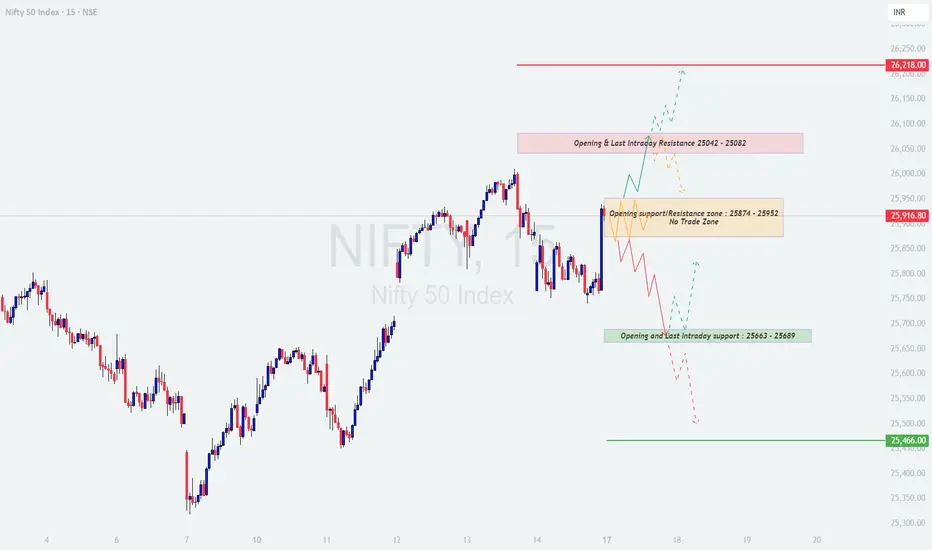
Nifty closed around 25,916 , maintaining a balanced but cautious structure ahead of the new trading week. The index currently trades near the Opening Support / Resistance Zone (25,874 – 25,952) , which is a key “no-trade” area as highlighted on the chart.
Immediate resistance lies at 26,042 – 26,082 (Opening & Last Intraday Resistance Zone) , while strong support exists near 25,663 – 25,689 (Opening & Last Intraday Support Zone) .
The index currently shows a neutral-to-slightly bullish undertone as long as price sustains above 25,874 . A breakout above 25,952 can trigger an upmove toward 26,082 – 26,218 , while a breakdown below 25,874 may lead to short-term weakness toward 25,680 – 25,466 .
Key Zones to Watch:
🟩 Support Levels: 25,689 / 25,466
🟥 Resistance Levels: 25,952 / 26,082 / 26,218
⚖️ No Trade Zone: 25,874 – 25,952 (avoid trading until breakout confirmation)
---
🟢 Scenario 1: GAP-UP Opening (100+ Points)
If Nifty opens around or above 26,020 – 26,050 , it will directly test the Last Intraday Resistance Zone (26,042 – 26,082) . A strong gap-up near resistance often attracts early profit booking or sideways consolidation before directional clarity emerges.
If the price sustains above 26,082 with a strong bullish candle and volume confirmation, upside targets open toward 26,180 – 26,218 .
If price faces rejection at 26,082 (long upper wicks or doji patterns), expect a pullback toward 25,952 – 25,874 .
Traders should avoid buying calls immediately after a gap-up; instead, wait for a retest of the 26,042 zone for better confirmation.
Sustained momentum beyond 26,100 will confirm strength and can lead to intraday trend continuation.
💡 Educational Note:
Gap-ups near major resistance zones often trap impulsive traders. The best approach is to let the market test and confirm whether the breakout is genuine or just a liquidity trap. Watch for rising volume with closing candles above the breakout level for confirmation.
---
🟧 Scenario 2: FLAT Opening (Around 25,880 – 25,920 Zone)
A flat opening within the No Trade Zone (25,874 – 25,952) indicates indecision. The price may spend the first 15–30 minutes moving sideways as buyers and sellers battle for control.
Avoid trading inside this range — it’s a “neutral zone” with no clear edge.
If price breaks and sustains above 25,952 , bullish continuation can take Nifty toward 26,082 – 26,218 .
If price breaks below 25,874 , weakness may extend toward 25,689 – 25,466 .
Wait for a strong 15-min candle close beyond the range for confirmation — don’t pre-empt the breakout.
🧠 Educational Tip:
Flat openings near key levels require patience. Most false breakouts occur when traders enter without confirmation. Wait for candle structure and volume validation before committing. Strong moves often follow after consolidations — let the direction emerge naturally.
---
🔴 Scenario 3: GAP-DOWN Opening (100+ Points)
If Nifty opens around 25,700 – 25,750 , it will directly test the Opening & Last Intraday Support Zone (25,663 – 25,689) . This zone will be critical for bulls to defend — a breakdown below could open room for deeper correction.
If reversal patterns (hammer, bullish engulfing) appear around 25,680 , expect a bounce toward 25,874 – 25,952 .
If the price fails to hold 25,663 , next support lies near 25,466 — which can act as a short-term target zone for sellers.
Avoid chasing short trades at the open; instead, wait for a pullback toward 25,850 – 25,880 to initiate low-risk entries.
Volume divergence (falling volume with declining price) near support is often a sign of selling exhaustion — watch closely for reversals.
📘 Educational Insight:
Gap-down openings are often ruled by emotions — panic selling and fear dominate. Experienced traders look for structure, not emotion. Reversal signals near major supports usually offer high reward-to-risk setups once panic subsides.
---
💼 RISK MANAGEMENT TIPS FOR OPTIONS TRADERS:
Avoid entering trades in the first 15 minutes of market open — IV spikes and volatility whipsaws can distort option prices.
Use only 1–2% of total trading capital per position. Focus on longevity, not short-term aggression.
Prefer ATM or slightly ITM options for better delta exposure and lower time decay impact.
Always set a stop-loss — trail it once the trade moves 30–40 points in your favor.
Book partial profits at nearby supports/resistances — protect gains and avoid greed traps.
Do not average losing positions; instead, accept small losses and preserve capital for better setups.
⚠️ Golden Rule: Avoid overtrading in choppy or low-volume conditions — professional traders focus on quality, not quantity.
---
📈 SUMMARY:
🟧 No Trade Zone: 25,874 – 25,952
🟥 Resistance Zones: 26,082 / 26,218
🟩 Support Zones: 25,689 / 25,466
⚖️ Bias: Bullish above 25,952 | Bearish below 25,874
---
📚 CONCLUSION:
Nifty remains at a decisive inflection point near 25,900 . The day’s directional tone will depend on how price reacts around the No Trade Zone (25,874 – 25,952) . Sustained breakout above 25,952 could trigger a move toward 26,218 , whereas a breakdown below 25,874 may pull the index toward 25,680 – 25,466 .
For intraday traders, patience will be the most valuable skill on 17 Nov. Let price confirm before execution — impulsive entries near range zones often lead to losses.
📊 Remember: Markets reward patience and discipline — clarity always follows confirmation.
---
⚠️ DISCLAIMER:
I am not a SEBI-registered analyst . The analysis shared here is purely for educational and informational purposes . Please do your own research or consult a certified financial advisor before making any trading or investment decisions.
NIFTY : Trading levels and Plan for 13-Nov-2025📊 NIFTY TRADING PLAN — 13 NOV 2025
(Timeframe Reference: 15-Min Chart)
Chart Summary:
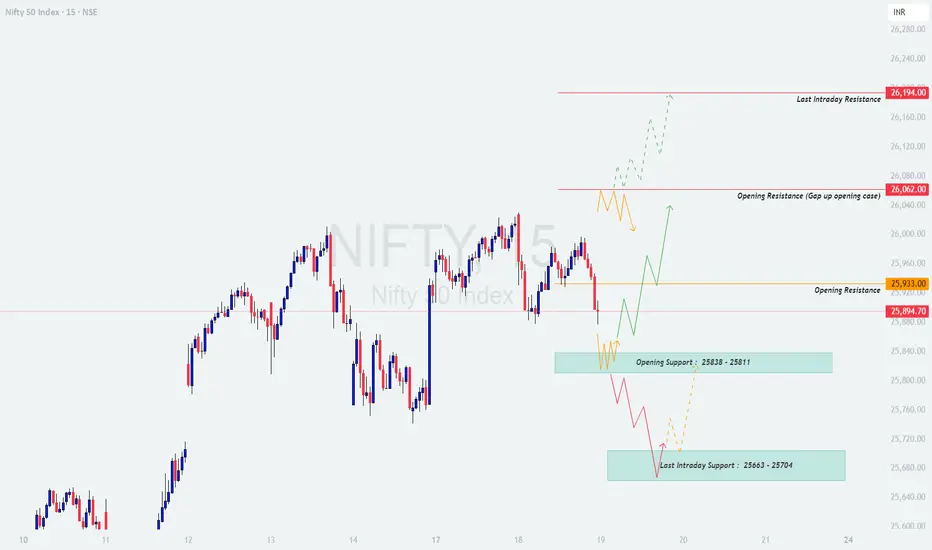
Nifty closed near 25,874 , positioned within a tight No-Trade Zone (25,863 – 25,935) , reflecting indecision and a short-term pause after a strong rally. The index is facing an immediate Opening Resistance Zone near 26,004 , while its Opening Support Zone lies at 25,745 – 25,765 .
The price structure suggests that momentum players are waiting for confirmation — either a breakout above 25,935 to push toward 26,193, or a breakdown below 25,745 to retest lower supports. Volatility could remain high due to positional adjustments ahead of the weekend.
Key Levels to Watch:
🟩 Supports: 25,765 / 25,745 / 25,664
🟥 Resistances: 25,935 / 26,004 / 26,193
⚖️ Bias Zone: Between 25,863 – 25,935 (No-Trade Zone)
🟢 Scenario 1: GAP-UP Opening (100+ Points)
If Nifty opens above 25,950 – 26,000 , it will directly enter the Opening Resistance Zone . Bulls must sustain the gap for continuation toward higher levels.
If price sustains above 26,004 with strong bullish candles and increasing volume, a move toward 26,120 – 26,193 is likely.
However, if the index opens higher but fails to hold above 26,004 , a pullback toward 25,935 – 25,874 may occur.
Ideal plan: Wait for the first 15–30 minutes to confirm whether buyers can sustain above 26,004 . Enter long positions only after a successful retest with proper confirmation.
If rejection appears near 26,120 – 26,193 , partial profit booking or trailing stops is advised.
💡 Educational Note:
Gap-ups near resistance often trap early buyers. Strong conviction comes not from the open itself but from whether the price holds above breakout levels after initial volatility. Let price show you control — strength confirmed through retest and volume is far more reliable than the first impulse.
🟧 Scenario 2: FLAT Opening (Within 25,863 – 25,935 Zone)
A flat opening inside the No-Trade Zone suggests early choppiness. Traders should avoid getting caught in this indecision range until a clear breakout occurs.
Avoid taking trades inside 25,863 – 25,935 as whipsaws are common.
If the index breaks and sustains above 25,935 , upside targets open toward 26,004 – 26,193 .
If price breaks below 25,863 , it could trigger weakness toward 25,765 – 25,745 .
Focus on the breakout candle — confirmation with strong body and volume gives confidence in the move’s sustainability.
🧠 Educational Tip:
Flat openings require traders to be patient and disciplined. Most false signals occur when traders predict rather than react. Waiting for the range to break provides a statistical edge — successful trades come from confirmation, not anticipation.
🔴 Scenario 3: GAP-DOWN Opening (100+ Points)
If Nifty opens below 25,770 – 25,740 , it will test the Opening Support Zone . This area will decide whether bulls defend the recent uptrend or allow bears to take over.
If a reversal pattern forms near 25,745 – 25,765 (hammer or bullish engulfing), expect a short-covering rally back toward 25,874 – 25,935 .
If price breaks and sustains below 25,745 , weakness may extend toward 25,664 and possibly 25,502 .
Avoid shorting immediately after a deep gap-down — wait for a retracement toward 25,745 – 25,800 for better risk-reward.
Volume near support zones will indicate whether selling is continuing or exhausting. Falling volume often hints at reversal setups.
📘 Educational Insight:
Gap-downs tend to amplify emotional trading. Many participants panic-sell into support zones, providing opportunities for disciplined traders who wait for reversals. The key is to let the first few candles reveal intent — a steady base near support usually signals potential bounce setups.
💼 RISK MANAGEMENT TIPS FOR OPTIONS TRADERS:
Avoid trading options in the first 15–20 minutes — high Implied Volatility (IV) inflates premiums and causes quick time decay as the market stabilizes.
Define your risk before entry — limit exposure to 1–2% of total capital per trade.
Prefer ITM or ATM options for directional plays; avoid far OTM options unless volatility breakout is confirmed.
Use stop-loss orders and trail them as positions move in your favor by 30–40 points to protect profits.
Avoid overtrading after multiple stop-outs — conserving capital is more important than chasing missed moves.
Always book partial profits at major resistance/support levels to lock in gains.
📈 SUMMARY:
🟧 No-Trade Zone: 25,863 – 25,935
🟥 Resistance Zones: 26,004 / 26,193
🟩 Support Zones: 25,765 / 25,745 / 25,664
⚖️ Bias: Neutral-to-Bullish above 25,935 | Weakness below 25,863
📚 CONCLUSION:
Nifty sits at a key decision point — 25,863 – 25,935 defines the immediate battleground. A breakout above 25,935 could fuel a bullish continuation toward 26,193 , while a drop below 25,863 may invite selling pressure toward 25,745 – 25,664 .
Patience is essential — avoid early entries within the no-trade zone and trade only when confirmation aligns with volume strength. Trade the trend, not the noise.
📊 Remember: Markets reward clarity and discipline — every avoided bad trade is a hidden profit.
⚠️ DISCLAIMER:
I am not a SEBI-registered analyst . The above analysis and levels are shared purely for educational purposes . Please conduct your own research or consult a certified financial advisor before making any trading or investment decisions.

NIFTY : Trading levels and Plan for 11-Nov-2025📊 NIFTY TRADING PLAN — 11 NOV 2025
(Timeframe Reference: 15-Min Chart)
Chart Summary:
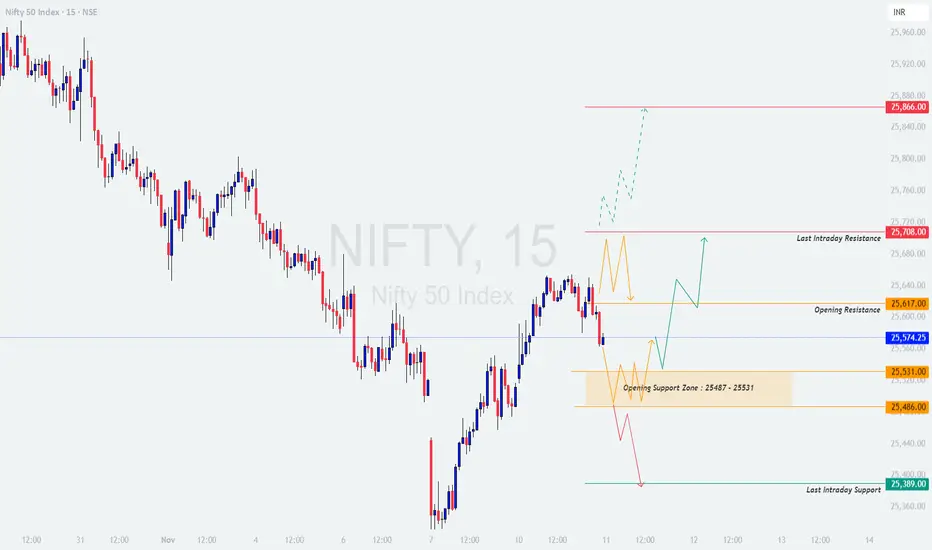
Nifty is currently trading near 25,574 , positioned just below the Opening Resistance (25,617) and slightly above the Opening Support Zone (25,487 – 25,531) . The index continues to consolidate in a tight range after a short-term rebound, suggesting that a breakout is imminent.
The structure indicates that the market is at a decision point — a sustained move above 25,617 may invite further upside momentum, while slipping below 25,487 could expose the lower support near 25,389 .
Volatility may increase as traders position ahead of the weekend and key economic data.
Key Levels to Watch:
🟢 Supports: 25,531 / 25,487 / 25,389
🟥 Resistances: 25,617 / 25,708 / 25,866
⚖️ Bias Zone: 25,487 – 25,617 (Opening Range)
🟢 Scenario 1: GAP-UP Opening (100+ Points)
If Nifty opens above 25,670 – 25,700 , it will be opening close to the Last Intraday Resistance (25,708) . Bulls will need to sustain above this zone to extend momentum toward 25,866 .
If price sustains above 25,708 with strong bullish candles and rising volume, a move toward 25,820 – 25,866 is likely.
However, if Nifty opens higher but fails to hold above 25,708 , it may trigger profit booking back toward 25,617 – 25,574 .
Traders should avoid emotional long entries at the open — instead, wait for a retest of 25,617 to confirm support before going long.
Use trailing stops once the price moves 30–40 points in your favor to secure profits in case of sharp reversals.
💡 Educational Note:
Gap-up openings can often be deceptive — they excite traders into premature entries without confirming strength. True momentum is validated only when the market holds above resistance zones with rising volume and strong candle closes. Always let the first few candles define control between bulls and bears.
🟧 Scenario 2: FLAT Opening (Within 25,487 – 25,617)
A flat opening around the current range will likely lead to a period of early consolidation and directionless moves. The first half-hour will be crucial to identify whether the breakout happens upward or downward.
If price sustains above 25,617 with volume expansion, expect an upside continuation toward 25,708 – 25,866 .
If price breaks below 25,487 , weakness may extend toward 25,389 .
Avoid trading within this range — it’s a “no-clear-edge” zone that traps both sides. Wait for the breakout retest confirmation before entering.
Scalpers can focus on rejection wicks or engulfing patterns near extremes for quick intraday setups.
🧠 Educational Tip:
Flat openings require traders to be patient and disciplined. Most of the false moves occur within the first 30 minutes when traders try to predict direction instead of reacting to it. The best opportunities come once a breakout confirms and retests with volume-backed follow-through.
🔴 Scenario 3: GAP-DOWN Opening (100+ Points)
If Nifty opens below 25,470 or near 25,430 – 25,400 , it will test the Opening Support Zone (25,487 – 25,531) and potentially move toward Last Intraday Support (25,389) .
If a reversal candle (hammer, bullish engulfing) appears near 25,389 , buyers may attempt a short-covering move toward 25,531 – 25,574 .
However, a sustained break below 25,389 with strong red candles and volume can extend weakness toward 25,320 – 25,280 .
Avoid shorting immediately on a deep gap-down — instead, wait for a pullback toward resistance zones like 25,487 – 25,531 for better risk-reward.
Volume analysis near the support zone will help confirm whether selling pressure is continuing or exhausting.
📘 Educational Insight:
Gap-downs are driven by overnight panic, and traders often overreact during the first few minutes. Smart money usually waits for sellers to exhaust before entering for reversals. Watching the candle structure and volume at key supports gives clues to whether it’s a continuation or reversal day.
💼 RISK MANAGEMENT TIPS FOR OPTIONS TRADERS:
Avoid buying options during the first 15 minutes after market open — early IV spikes inflate premiums and reduce your edge.
Always define your risk before entering; limit your exposure to 1–2% of total capital per trade .
Prefer ITM options for directional conviction, as they are less affected by time decay.
If using OTM options, exit quickly after 20–30 points in your favor — don’t let greed turn into decay.
Trail stop-losses as soon as your position gains momentum, and never remove stop-losses hoping for a bounce.
Remember: Consistency in managing risk is what keeps traders in the game, not catching every move.
📈 SUMMARY:
🟧 Opening Range Zone: 25,487 – 25,617
🟥 Resistance Levels: 25,708 / 25,866
🟩 Support Levels: 25,531 / 25,487 / 25,389
⚖️ Bias: Neutral-to-Bullish above 25,617 | Weakness below 25,487
📚 CONCLUSION:
Nifty is currently at a tight consolidation zone, preparing for a decisive breakout. A move above 25,617 could attract bullish continuation toward 25,708 – 25,866 , while slipping below 25,487 might tilt control toward bears with potential tests of 25,389 or lower.
Tomorrow’s session will reward patient traders who wait for breakout confirmation and avoid early traps.
Stay objective, respect the levels, and let price action lead the way.
📊 The best trades come not from prediction but from preparation and disciplined execution.
⚠️ DISCLAIMER:
I am not a SEBI-registered analyst . The views and analysis shared above are solely for educational purposes . Please do your own research or consult a certified financial advisor before making any trading or investment decisions.
NIFTY : Trading levels and Plan for 04-Nov-2025🔹 NIFTY Trading Plan for 04-Nov-2025
(Based on psychological correction behavior and intraday structure)
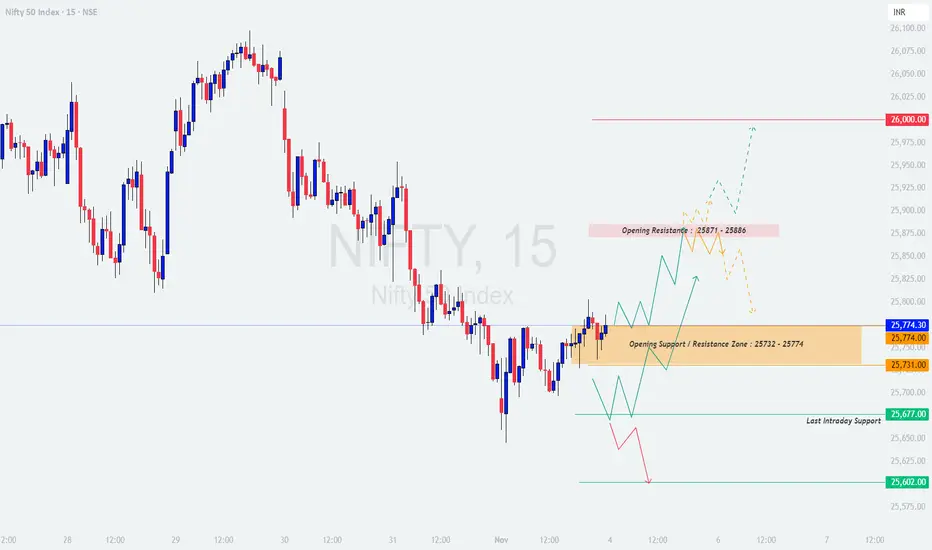
Chart Reference Levels:
🟧 Opening Support / Resistance Zone: 25,732 – 25,774
🟥 Opening Resistance: 25,871 – 25,886
🟩 Last Intraday Support: 25,677
🩵 Extended Support Zone: 25,602
❤️ Upside Psychological Target: 26,000
🟢 Scenario 1: Gap-Up Opening (100+ points above previous close)
If Nifty opens above 25,860, it enters near the Opening Resistance zone (25,871 – 25,886). Monitor how price behaves here — early candles showing rejection or long upper wicks could signal exhaustion and a potential pullback.
Only if Nifty sustains above 25,886 with strong momentum and closes a 15-minute candle above it, bulls could take control for a move towards the psychological mark of 26,000.
In case of a false breakout, prices could retrace back to the 25,774 zone, which may act as re-entry support for dip buyers.
📘 Educational Note: Gap-up days tend to trap retail traders who buy impulsively at the open. Always let the market prove its strength with a confirmed candle close before entering directional trades.
🟠 Scenario 2: Flat Opening (±50 points from previous close around 25,730)
Flat openings near 25,732 – 25,774 indicate equilibrium between bulls and bears. The first half-hour will decide whether this zone acts as support or resistance.
If Nifty sustains above 25,774, it can climb towards 25,871, where sellers might emerge again. Watch for a decisive breakout or rejection at that level.
A breakdown below 25,732 would expose the index to 25,677 (Last Intraday Support). Sustained weakness below that level could extend toward 25,602.
📘 Educational Note: Flat openings allow clear structure formation — ideal for observing whether large players are accumulating or distributing. Avoid rushing; let trend direction confirm itself.
🔴 Scenario 3: Gap-Down Opening (100+ points below previous close)
A gap-down below 25,650 brings price action directly near Last Intraday Support (25,677) or the Extended Support Zone (25,602). Watch closely for reversal candles or volume divergence in this region.
If Nifty fails to reclaim 25,677, it could extend weakness further, making 25,602 the next critical level where buyers may attempt to defend.
A recovery back above 25,732 after testing these supports may indicate a short-covering opportunity for intraday traders.
📘 Educational Note: Gap-downs are emotional openings. Avoid panic selling; instead, analyze whether the drop is driven by emotion or genuine momentum. Patience during the first 15–30 minutes often saves capital and improves entries.
💡 Tips for Risk Management in Options Trading
Never risk more than 1–2% of total trading capital per position.
Use hourly candle close-based stop-losses to minimize whipsaws in volatile moves.
Avoid chasing far OTM options post 11:00 AM — theta decay accelerates quickly.
If implied volatility (IV) is high, prefer spreads (Bull Call / Bear Put) over naked options.
Always pre-define your exit plan — entry is optional, exit is mandatory.
📊 Summary & Conclusion:
Above 25,886 → Bulls likely to extend toward 26,000.
Between 25,732 – 25,774 → Neutral consolidation zone; trade cautiously.
Below 25,677 → Bearish bias may continue toward 25,602.
In essence, 04-Nov-2025 could be a decision-making day for Nifty — either to confirm strength above the resistance band or to retest lower supports. Let the first 30 minutes establish the tone, then trade with discipline and risk control.
⚠️ Disclaimer:
I am not a SEBI-registered analyst . This analysis is shared purely for educational and informational purposes. Traders should conduct their own technical and psychological assessment or consult with a certified financial advisor before executing any trade.
#nifty view Nifty opened today at 25,863.8 after an initial upside move to 25,955.75, reflecting early bullish momentum. However, the index faced resistance at these higher levels and saw a reversal, dropping to a low near 25,800 during the session. This downside move highlights renewed selling pressure, making 25,800 a decisive support zone for the day.
If Nifty fails to sustain above 25,800, further downside risk remains, and additional selling could intensify, potentially accelerating the decline. Therefore, traders should monitor 25,800 closely—holding above it may invite a recovery, while a clear breach signals the possibility of deeper corrections.
#nifty50 #stockmarket #niftyanalysis #stockmarketindia #investing

NIFTY : Trading levels and Plan for 30-Oct-2025NIFTY TRADING PLAN – 30-Oct-2025
📊 Prepared by LiveTradingBox | Based on 15-min chart structure & key intraday reference zones
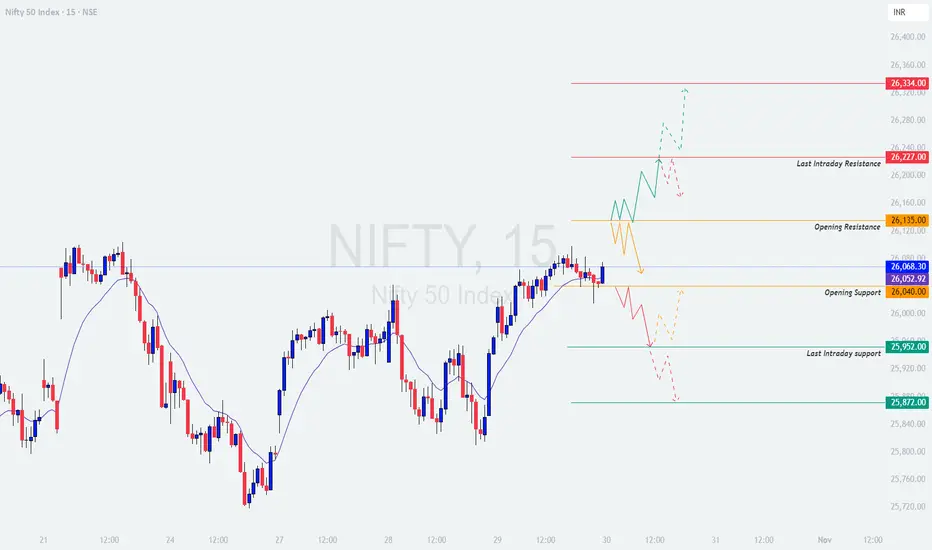
🔍 Key Levels to Watch:
🟥 Last Intraday Resistance: 26,227
🟥 Next Resistance Extension: 26,334
🟧 Opening Resistance: 26,135
🟦 Opening Support: 26,040
🟩 Last Intraday Support: 25,952
🟢 Major Support Zone: 25,872
🟢 1. Gap-Up Opening (Above 26,135 – 100+ points)
If Nifty opens with a Gap-Up above 26,135 , it enters the higher resistance zone. The immediate focus will shift to whether it can sustain above this level. Sustained price action above 26,135 may trigger momentum buying toward 26,227 and possibly 26,334 if strength continues.
Plan of Action:
Wait for the first 15-minute candle to close. Avoid chasing the initial spike.
If price sustains above 26,135, consider entering long positions targeting 26,227–26,334 zone.
Keep a strict stop loss below 26,040 on a closing basis.
If rejection occurs near 26,227, book profits partially and trail your stop to cost.
If Nifty fails to sustain above 26,135 and slips below 26,040, avoid longs and prepare for a pullback toward 25,952.
📘 Educational Insight:
A strong gap-up requires confirmation. Many traders jump in early, but waiting for price to hold above the opening resistance helps avoid fake breakouts.
🟦 2. Flat Opening (Around 26,040 ±50 points)
A flat start near 26,040 suggests balanced sentiment between buyers and sellers. Directional clarity will emerge once either the resistance or support levels are broken.
Plan of Action:
Allow the first 30 minutes for market stabilization.
A sustained move above 26,135 with volume indicates strength — target 26,227 with a stop loss below 26,040.
If Nifty stays range-bound between 26,135–26,040, expect sideways movement — best avoided for options trading.
Breakdown below 26,040 will open short opportunities targeting 25,952–25,872 zones.
For option buyers, avoid overtrading in sideways phases to reduce premium decay.
📘 Educational Insight:
Flat openings are often “wait-and-watch” setups. Avoid predicting direction; instead, react once key levels confirm strength or weakness.
🔻 3. Gap-Down Opening (Below 25,952 – 100+ points)
If Nifty opens below 25,952, it reflects weak sentiment and profit booking pressure. The index will test demand near 25,872, which serves as the final intraday support zone.
Plan of Action:
Monitor price reaction near 25,872 — if it holds and rebounds, expect a short-covering rally toward 26,040.
If Nifty remains below 25,952 without recovery, maintain a bearish stance with a target of 25,820 (psychological level).
Place a stop loss above 26,040 on an hourly close.
Avoid bottom fishing; wait for confirmation candles before considering reversals.
📘 Educational Insight:
Gap-down setups usually trigger panic trades. Professionals wait for stabilization before entering, while retail traders often get trapped during early volatility.
🧠 Risk Management Tips for Options Traders:
Always define your risk — use stop-loss orders and don’t hold losing trades beyond your comfort zone.
Avoid trading both sides of the market; pick one directional bias.
Stick to ATM or slightly ITM options to manage time decay efficiently.
Avoid aggressive trades during the first 15–30 minutes after the market opens.
Maintain proper position sizing — never risk more than 2–3% of your trading capital in a single trade.
📈 Summary & Conclusion:
Above 26,135, the bias remains bullish — expect an extension toward 26,227–26,334.
Between 26,040–26,135, expect choppy consolidation — best to wait for breakout confirmation.
Below 25,952, weakness may extend toward 25,872 or lower if support fails.
Stick to a disciplined approach — react to price, don’t predict it.
⚠️ Disclaimer:
I am not a SEBI-registered analyst . The above analysis is purely for educational and informational purposes. Traders should do their own analysis or consult a financial advisor before taking any positions.
NIFTY : Trading levels and Plan for 15-Oct-2025NIFTY 50 – Professional Trading Plan for 15-Oct-2025 (educational)
Market context and key levels
Nifty closed near 25,145 on 14-Oct after a mild decline, with immediate supports at 25,089/25,060 and deeper demand around 24,950–24,924. Sentiment is balanced; expect two-way moves early. 🙂
Overhead resistances are 25,185 (opening pivot), 25,255–25,268 (last intraday barrier), 25,326, and the supply/profit zone at 25,340–25,450.
Bias roadmap: Momentum unlocks only on acceptance beyond 25,326; bearish momentum strengthens below 25,060 toward 24,950 and 24,924–24,948.
GAP UP OPEN (≥ +100 pts)
Educational logic: Gaps higher can trap shorts; wait for acceptance above resistance rather than chasing the first spike.
If open ≥ 25,245–25,260 and first 5–15 min high holds above VWAP, plan a momentum buy toward 25,300 → 25,326, scale partials into 25,340–25,360; trail for 25,422 if strength persists.
If open directly inside 25,340–25,450 supply, avoid chasing; wait for a pullback to 25,300–25,326. Go long only on a higher low plus reclaim of 25,340 with stop below the retest low.
Failure short: Bearish rejection wicks in 25,340–25,450 followed by a 15‑min close back below 25,300. Short to 25,255/25,268 and 25,200–25,185; exit if 25,326 is reclaimed with strength.
FLAT OPEN (±0–50 pts)
Educational logic: Neutral opens favor range trading around nearby pivots until a confirmed breakout with volume. ⚖️
Range buy: Look for reversal signals near 25,100–25,150 aiming for 25,255 then 25,268/25,326; keep stops tight under the reversal low.
Breakout buy: Sustained 15‑min close above 25,326 with rising volume/market breadth opens 25,340–25,450; scale out inside that zone, trail below last swing low.
Breakdown short: Loss of 25,060 with acceptance below on retest targets 24,950; extension possible to 24,924–24,948 buyer zone. Cover partials into these supports and trail.
GAP DOWN OPEN (≤ −100 pts)
Educational logic: Negative gaps near support can either trend down (“gap-and-go”) or reverse sharply if buyers defend key zones. 📉
Gap-and-go short: Open around 25,030–25,060 and failure to reclaim 25,060 on retest → short toward 24,950; manage risk by trailing as price approaches 24,924–24,948.
Reversal long: Strong rejection from 24,924–24,948 (bullish engulfing/inside-bar break) → long back to 25,060 then 25,185; move stop to breakeven once 25,060 is accepted.
Bias flip: If price re-enters and sustains above 25,185 intraday, switch to long bias for 25,255/25,268 → 25,326; avoid fighting a reclaim day.
Execution checklist
Plan the open : Define your initial scenario, invalidation level, and first target before the bell.
Map accept/reject: Treat 25,060, 25,185, 25,255–25,268, 25,326, and 25,340–25,450 as decision points; act only on acceptance or rejection, not touches.
Use structure: Place stops beyond the structure that invalidates your idea (last swing or the other side of the zone).
Scale management: Take partials at the next pivot; trail stops bar-by-bar or below/above last swing to lock gains.
Options risk management tips
Define risk upfront : Prefer debit spreads (bull call above 25,326, bear put below 25,060) to cap tail risk on volatile opens.
Size by volatility: Wider stops need smaller size; don’t oversize just because options look “cheap.”
Choose liquidity: Trade near-ATM, same-week options for intraday; avoid illiquid deep OTMs that decay fast in ranges.
Time entries: Enter after acceptance (15‑min close or retest hold) to reduce false breaks.
Manage winners: Scale at first target; convert naked options into spreads if IV expands in your favor.
Event watch: Stay alert to midday global cues; if structure flips (e.g., reclaim of 25,185), exit losers decisively instead of hedging passively.
Summary
Inside day plan favors responsive trades between 25,060–25,326. Upside expansion requires acceptance above 25,326 toward 25,340–25,450; downside momentum strengthens below 25,060 toward 24,950 and 24,924–24,948.
Trade level-to-level, let acceptance guide direction, and prioritize defined-risk option structures with disciplined scaling. 🚦
Conclusion
Prepare three plays: momentum continuation above 25,326, range trades around 25,185/25,255, and breakdowns below 25,060. Respect invalidations, scale responsibly, and adapt if the market reclaims key pivots. 📊
Disclaimer: This is an educational plan, not investment advice or a trade recommendation; I am not a SEBI registered analyst .
NIFTY : Trading levels and plan for 10-10-2025💼 NIFTY TRADING PLAN – 10-Oct-2025
📊 Chart Timeframe: 15-min
📍 Last Close: 25,170.30 | 🔻 Change: -7.40 pts (-0.03%)
📅 Analysis Based on Psychological & Technical Levels
🔍 Key Technical Zones
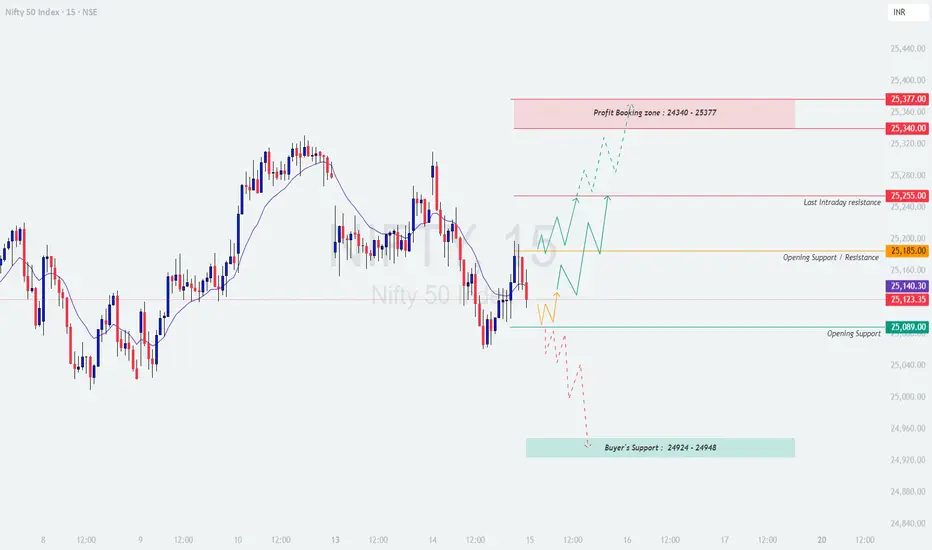
🟧 Opening Support / Resistance: 25,259
🟥 Last Intraday Resistance: 25,426
🟩 Opening Support: 25,114
🟢 Last Intraday Support: 25,048
💚 Buyer’s Support Zone: 24,959 – 24,981
🚀 Scenario 1 – Gap Up Opening (100+ pts above 25,270)
If Nifty opens near or above 25,270, it will directly approach the opening resistance zone.
A sustained move above 25,259 with strong green candles could trigger momentum buying toward 25,426, which is the last intraday resistance.
Avoid chasing the first 15 minutes — wait for a minor pullback to 25,259–25,280 and look for support confirmation before going long.
If Nifty fails to sustain above 25,259, expect short-term profit booking that can drag prices toward 25,170 or even 25,114.
Fresh shorts should be avoided until there’s a confirmed reversal candle near 25,400–25,426, as this area may trigger volatility and fake breakouts.]
🧠 Educational Insight:
Gap-up openings near resistance often create a “trap zone.” Patience is key — let the price test and confirm breakout strength before entering directional trades.
⚖️ Scenario 2 – Flat Opening (Around 25,150 ± 50 pts)
A flat start indicates market indecision and provides both long and short opportunities based on level reactions.
If the index sustains above 25,170–25,200, buyers may attempt to push prices toward 25,259 → 25,426. Watch for volume expansion to confirm momentum.
If Nifty rejects 25,259, expect a dip toward 25,114–25,048, which will act as short-term intraday supports.
Buyers can look for reversal confirmation from 25,048–25,114 zone for potential bounce trades.
A decisive hourly close below 25,048 may shift intraday trend bearish toward 24,981–24,959 (Buyer’s Support Zone).]
💡 Educational Note:
Flat openings favor disciplined traders who react to confirmation rather than prediction. Combining 15-min chart patterns with volume clues gives higher probability entries.
📉 Scenario 3 – Gap Down Opening (100+ pts below 25,060)
If Nifty opens around or below 25,060, it enters the support testing zone.
Monitor early reactions near 25,048–25,020. A quick recovery from this area can lead to a short-covering rally back toward 25,114–25,170.
If the index sustains below 25,020, expect a gradual slide toward the Buyer’s Support Zone (24,959–24,981) — a critical area where bulls might attempt to defend.
Failure to hold 24,959 could invite further downside toward 24,880–24,840, so avoid catching a falling knife without confirmation.
Intraday traders should prefer trading only on sustained 15-min candle closes below key levels to avoid whipsaws.]
🧠 Educational Insight:
Gap-down openings can trigger emotional decisions — let the first 30 minutes unfold before entering trades. Reversal setups are only valid with clear rejection wicks or bullish engulfing candles near key supports.
🛡️ Risk Management Tips for Options Traders
Limit trade exposure to 2–3% of total capital per trade.
Always use a stop loss based on 15-min candle close to avoid fake breakouts.
Prefer ATM or slightly ITM options for better delta and reduced time decay.
Avoid holding losing positions after 2:45 PM, as premium decay accelerates.
When volatility rises, use spreads (Bull Call / Bear Put) to manage theta and vega risk.
Never average losing trades — protect capital before chasing profit. 💎
📊 Summary & Conclusion
Nifty remains in a neutral-to-bullish structure, as long as it sustains above 25,048.
Upside momentum may resume only above 25,259, targeting 25,426.
A breakdown below 25,048 could shift control to sellers, pulling prices toward 24,981–24,959.
Traders should watch 15-min closing confirmations and volume expansion before taking directional positions.]
🎯 Focus Zone for 10-Oct-2025:
🟩 25,048 → 24,959 (Buyers’ Defensive Zone)
🟥 25,259 → 25,426 (Sellers’ Dominance Zone)
📢 Disclaimer:
I am not a SEBI-registered analyst . This analysis is purely for educational and informational purposes. Traders should perform their own due diligence or consult with a financial advisor before making trading decisions.
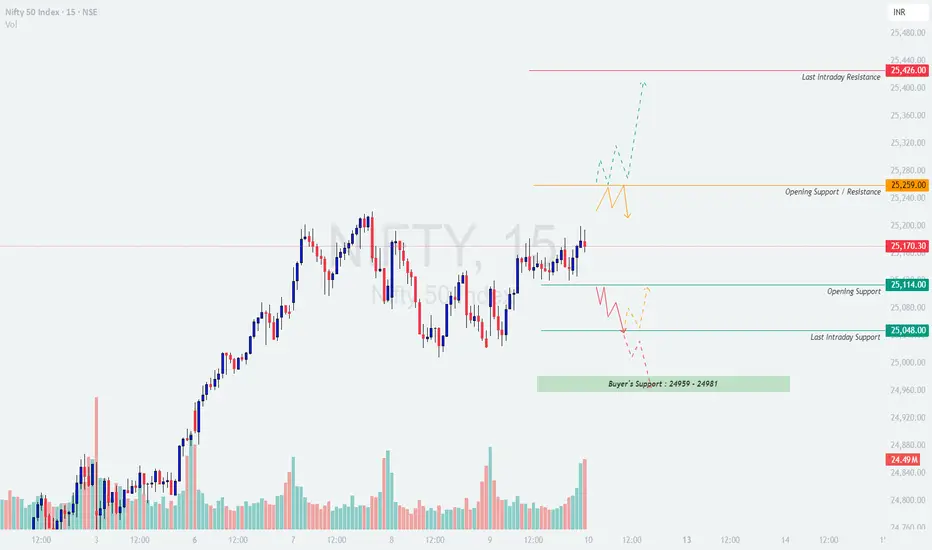
NIFTY : Trading levels and Plan for 08-Oct-2025📊 NIFTY TRADING PLAN – 08-Oct-2025
💼 Levels to Watch:
• Opening / Last Intraday Resistance: 25,260 – 25,324
• Opening Support: 25,016
• Last Intraday Support Zone: 24,904 – 24,927
• Next Major Support: 24,721
• Previous Close: 25,079
🟢 1️⃣ GAP-UP OPENING (Above 25,180 – around 100+ points from previous close)
If Nifty opens with a gap-up near the 25,180–25,220 zone, it will quickly approach the 25,260 resistance, which also acted as the last intraday ceiling. This area will decide whether the bullish momentum can continue or if early selling pressure comes in.
✅ Plan of Action:
Wait for the first 30-minute candle to confirm whether Nifty sustains above 25,260. If it holds, expect a move towards 25,324 and potentially 25,400.
If the price fails to hold above 25,260 and shows rejection, avoid chasing longs — a pullback toward 25,016–25,050 can occur as bulls try to regain strength.
Avoid aggressive buying immediately on the gap-up; instead, let the market confirm direction.
When the market opens with strength, it’s vital to wait for confirmation rather than reacting to the initial sentiment. This helps in avoiding false breakouts during the first 30 minutes of volatility.
🟧 2️⃣ FLAT OPENING (Around 25,050 ±100 points)
A flat opening near 25,050–25,100 creates an interesting zone between the Opening Support (25,016) and Resistance (25,260). This is where the market often consolidates before a directional move begins.
✅ Plan of Action:
A clear hourly candle close above 25,260 will confirm strength and likely push Nifty toward 25,324–25,400.
If Nifty fails to break 25,260 and slips below 25,016, then weakness could expand toward 24,927 and even 24,721.
Use this range to observe whether institutions are accumulating or distributing — strong volume spikes often confirm the next trend.
Flat openings require patience — let the structure develop and price show its hand. Following confirmation keeps you aligned with the actual market bias rather than the expectation.
🔻 3️⃣ GAP-DOWN OPENING (Below 24,980 – around 100+ points from previous close)
If Nifty opens below 24,980, it will immediately challenge the 24,904–24,927 support zone. This region is critical — a bounce can attract short-covering, but a breakdown can accelerate the downside momentum.
✅ Plan of Action:
If price shows reversal signals (like a hammer or bullish engulfing candle) near 24,904–24,927, a short-covering move toward 25,016 may occur.
If 24,904 fails to hold and price sustains below, expect further decline toward 24,721 — this can trigger panic selling or momentum shorts.
Avoid bottom-fishing on a large gap-down; instead, trade only after a proper price confirmation.
Gap-downs often come with emotional panic — being calm and waiting for a structured setup keeps you on the right side of the trade.
💡 RISK MANAGEMENT & OPTIONS TRADING TIPS
Avoid trading the first 15–30 minutes after a gap-up or gap-down — let volatility cool.
Always confirm trend with hourly candle closing before entering positional trades.
If the direction is uncertain, use spread strategies (Bull Call or Bear Put) to manage theta decay.
Avoid deep OTM options — pick strikes within the next 100–150 points for better delta and liquidity.
Stick to 1–2% capital risk per trade to maintain consistency and avoid emotional losses.
📘 SUMMARY & CONCLUSION
The level 25,016 remains the crucial line for directional confirmation. Sustaining above it favors bulls, with 25,260–25,324 acting as resistance zones. However, weakness below 24,927 can push Nifty into a bearish phase toward 24,721.
The market is showing signs of short-term correction after a strong recovery, so patience and discipline will be key. Let the market confirm before acting — don’t anticipate, react wisely.
⚠️ Disclaimer:
I am not a SEBI-registered analyst. This analysis is purely for educational and informational purposes only. Please conduct your own research or consult a financial advisor before taking any position.
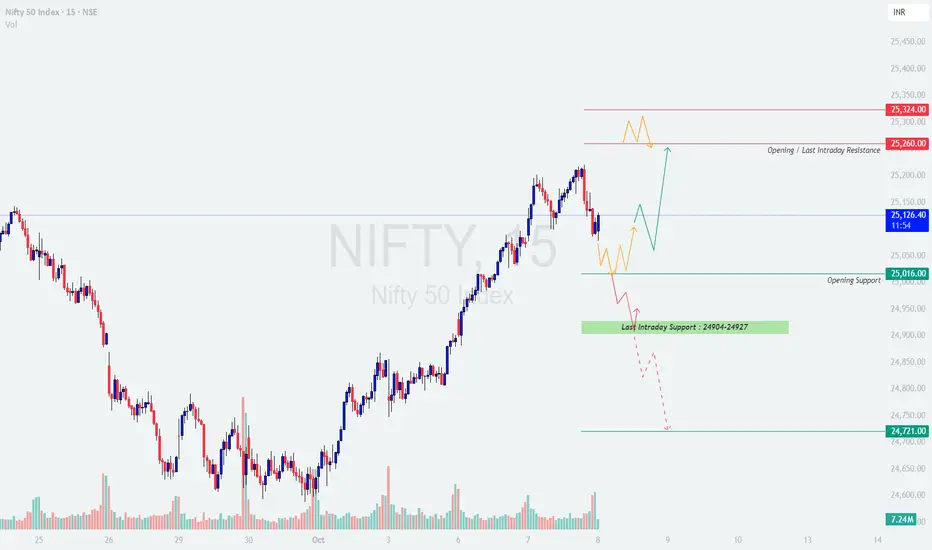
NIFTY : Trading levels and plan for 06-Oct-2025NIFTY TRADING PLAN – 06-Oct-2025
Nifty closed at 24,895, showing strong recovery momentum but still trading near crucial resistance and support levels. Tomorrow’s opening and follow-up price action will be key in determining short-term direction.
📌 Key Levels to Watch:
Opening Support Zone: 24,814 – 24,895
Opening Resistance / Support: 24,923
Last Intraday Resistance: 25,015 – 25,049
Last Intraday Support: 24,720 & 24,646
🚀 Scenario 1: Gap Up Opening (100+ points)
If Nifty opens above 25,000, it will be very close to Last Intraday Resistance (25,015 – 25,049) .
Sustained price action above 25,049 could trigger further momentum towards 25,100 – 25,150 levels.
However, if rejection occurs around resistance, expect profit booking back towards 24,950 – 24,923.
Traders should avoid chasing the gap-up and instead look for either a breakout confirmation or rejection signals to enter.
👉 Educational Note: Gap-ups near resistance zones often trap late buyers. Always wait for a retest before committing to a trade.
⚖️ Scenario 2: Flat Opening (within ±100 points)
A flat start near 24,850 – 24,900 will keep Nifty inside the Opening Support Zone (24,814 – 24,895) and just below 24,923 Resistance .
A breakout above 24,923 can fuel a rally towards 25,015 – 25,049, with further extension possible if momentum is strong.
On the downside, failure to hold above 24,814 may pull prices back to 24,720 or even 24,646.
Traders should adopt a wait-and-watch approach until the range between 24,814 – 24,923 is broken.
👉 Educational Note: Flat openings usually create range-bound trades early in the session. Focus on range breakouts to avoid getting chopped in sideways action.
📉 Scenario 3: Gap Down Opening (100+ points)
If Nifty opens near or below 24,750 – 24,720, the Last Intraday Support (24,720) will be tested immediately.
A breakdown below 24,720 could extend weakness towards 24,646 – 24,600.
However, if support holds at 24,720 – 24,646, a sharp short-covering rally back towards 24,850 – 24,900 is possible.
Patience will be key – wait for confirmation whether support sustains or breaks before taking positions.
👉 Educational Note: Gap-downs often trigger panic selling, but they can also present excellent reversal opportunities if support holds firmly.
🛡️ Risk Management Tips for Options Traders
⏳ Avoid taking aggressive positions in the first 15–30 minutes; let volatility settle.
🛑 Place stop losses based on 15-min or hourly candle closes , not just wicks.
🎯 Use option spreads (Bull Call, Bear Put) to manage premium decay.
📉 Always maintain at least a 1:2 Risk-Reward ratio .
💰 Book partial profits at key levels to protect capital.
🧘 Never risk more than 2–3% of capital on a single trade.
📌 Summary & Conclusion
Bullish Bias: Above 24,923, targets 25,015 → 25,049 → 25,100+.
Neutral Zone: Between 24,814 – 24,923, expect consolidation.
Bearish Bias: Below 24,720, weakness towards 24,646 – 24,600.
📊 Nifty is currently at a decision-making level. Breakout above resistance can extend bullish momentum, while breakdown below support may invite selling pressure. The best approach is to stay patient, follow confirmation signals, and manage risk with discipline.
⚠️ Disclaimer: This analysis is purely for educational purposes. I am not a SEBI-registered analyst. Please do your own research or consult with a financial advisor before making trading decisions.
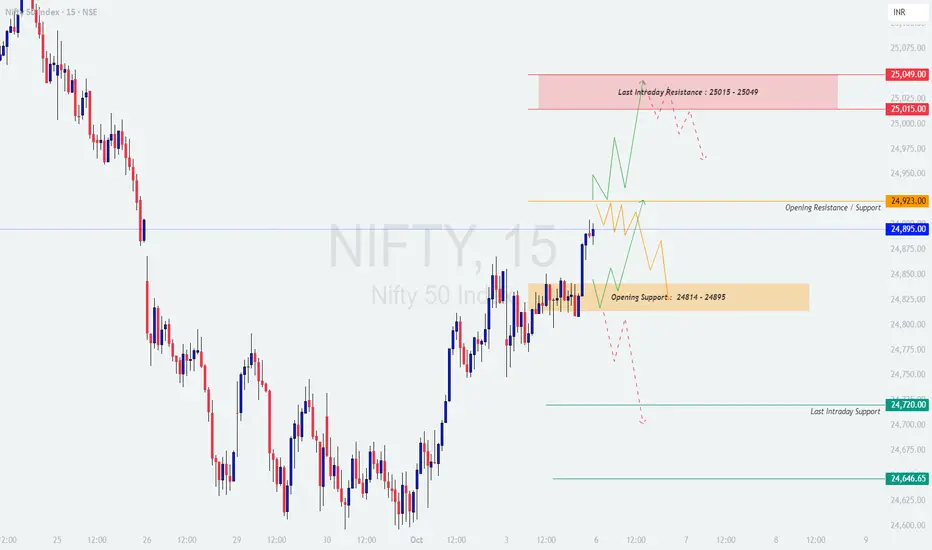
NIFTY : Trading levels and Plan for 30-09-2025NIFTY TRADING PLAN – 30-Sep-2025
Nifty closed at 24,677.55, recovering slightly after testing crucial supports. For tomorrow’s session, the index is positioned between 24,801 (Opening Resistance) and 24,570 (Last Intraday Support). These levels will be pivotal in shaping intraday moves.
📌 Key Levels to Watch:
Last Intraday Resistance: 24,923
Opening Resistance: 24,801
Current Market Level (CMP): 24,677
Opening Support: 24,625
Last Intraday Support (Crucial on daily chart): 24,570
Extended Support Levels: 24,484 → 24,276
🚀 Scenario 1: Gap Up Opening (100+ points)
If Nifty opens near 24,780 – 24,850, it will be very close to the Opening Resistance at 24,801 .
Sustained move above 24,801 may trigger bullish momentum, leading towards 24,923.
A breakout above 24,923 could extend gains towards 25,000+ zones, but traders must confirm strength with follow-up buying.
However, rejection around 24,801 – 24,923 may attract intraday profit booking, dragging Nifty back towards 24,700 – 24,625.
👉 Educational Note: Gap-ups tend to trap aggressive buyers if resistance zones are not broken decisively. Always wait for an hourly close above resistance before committing to fresh longs.
⚖️ Scenario 2: Flat Opening (within ±100 points)
A flat opening near 24,650 – 24,700 will likely keep Nifty in a consolidation phase.
On the upside, a push towards 24,801 needs to be watched closely. If crossed, 24,923 becomes the immediate target.
On the downside, failure to hold 24,625 will invite pressure towards 24,570.
Sustained weakness below 24,570 will likely lead to an extended decline towards 24,484 → 24,276.
👉 Educational Note: Flat openings usually indicate indecision. Such days often turn into range-bound markets until a breakout confirms direction.
📉 Scenario 3: Gap Down Opening (100+ points)
If Nifty opens around 24,550 – 24,500, it will be close to the Last Intraday Support at 24,570 .
A breakdown below 24,570 may extend the decline to 24,484, and if that fails to hold, next support lies at 24,276.
If 24,570 holds firmly, expect a rebound towards 24,625 → 24,700, driven by short covering.
Hourly close below 24,570 is the confirmation for a bearish continuation.
👉 Educational Note: Gap-downs often trigger panic selling in the first hour. Smart traders wait for support to be tested before entering trades to avoid false breakdowns.
🛡️ Risk Management Tips for Options Traders
⏳ Avoid aggressive trades in the first 15–30 mins; let the market settle.
🛑 Always place stop losses on a closing basis (15-min/hourly candle) .
🎯 Use option spreads (Bull Call / Bear Put) to minimize time decay.
⚖️ Stick to a 1:2 or higher risk-reward ratio .
💰 Book partial profits at key levels instead of waiting for extremes.
🧘 Maintain discipline—capital preservation is more important than chasing every move.
📌 Summary & Conclusion
Bullish Bias: Above 24,801 → 24,923, next target 25,000+.
Neutral Zone: Between 24,625 – 24,801, expect sideways consolidation.
Bearish Bias: Below 24,570, expect weakness towards 24,484 → 24,276.
📊 Nifty is trading in a tight band with critical support at 24,570 and resistance at 24,801. A decisive move beyond these levels will guide intraday momentum. Traders should stay patient and trade only on confirmation.
⚠️ Disclaimer: This trading plan is for educational purposes only. I am not a SEBI-registered analyst. Please do your own analysis or consult a financial advisor before making trading decisions.