NIFTY Intraday Trade Setup For 28 Jul 2025NIFTY Intraday Trade Setup For 28 Jul 2025
Sell_1- From 24990
Invalid-Above 25040
T- 24800
Bearish-Below 24800
Invalid-Above 24850
T- 24620
NIFTY has closed on a bearish note, ended near lowest point of the week. Index has closed below 50 and 21 EMA both. Its sell on rise market till it is below 50 EMA. Support lies near 24150, 24450 will be a confluence zone in between. Following the sell on rise approach, On Monday 25k zone will be a resistance area to plan a short. On flat opening, below 24800 will be a simple short planning towards 24600 zone.
In case of a big gap up/down, wait till 10 o'clock and mark the high and low of the trading range (5MIN). Trade on this range breakout.
==========
I am Not SEBI Registered
This is my personal analysis for my personal trading. Kindly consult your financial advisor before taking any actions based on this.
Niftyintradaylevels

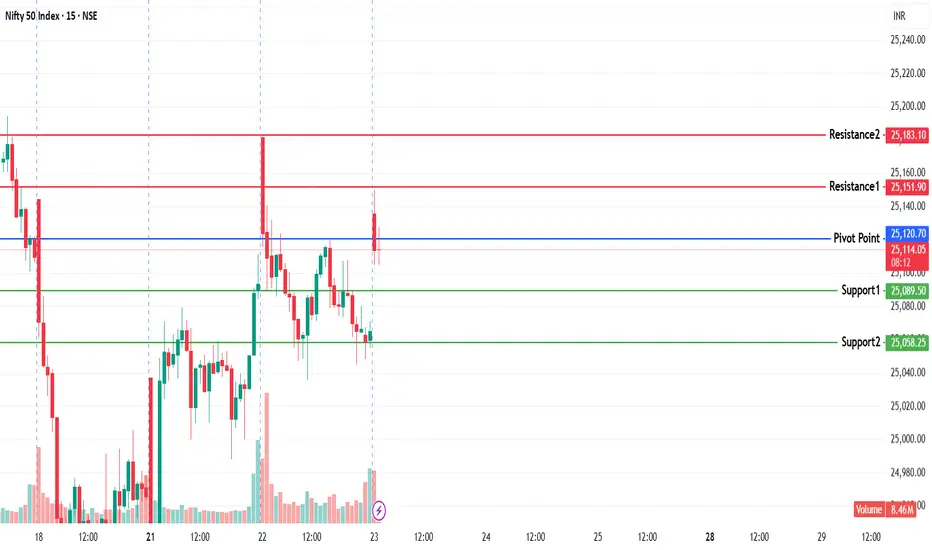
NIFTY KEY LEVELS FOR 23.07.2025NIFTY KEY LEVELS FOR 23.07.2025
If the candle stays above the pivot point, it is considered a bullish bias; if it remains below, it indicates a bearish bias. Price may reverse near Resistance 1 or Support 1. If it moves further, the next potential reversal zone is near Resistance 2 or Support 2. If these levels are also broken, we can expect the trend.
If the range is narrow, the market may become volatile or trend strongly. If the range is wide, the market is more likely to remain sideways
📢 Disclaimer
I am not a SEBI-registered financial adviser.
The information, views, and ideas shared here are purely for educational and informational purposes only. They are not intended as investment advice or a recommendation to buy, sell, or hold any financial instruments.
Please consult with your SEBI-registered financial advisor before making any trading or investment decisions.
Trading and investing in the stock market involves risk, and you should do your own research and analysis. You are solely responsible for any decisions made based on this research.
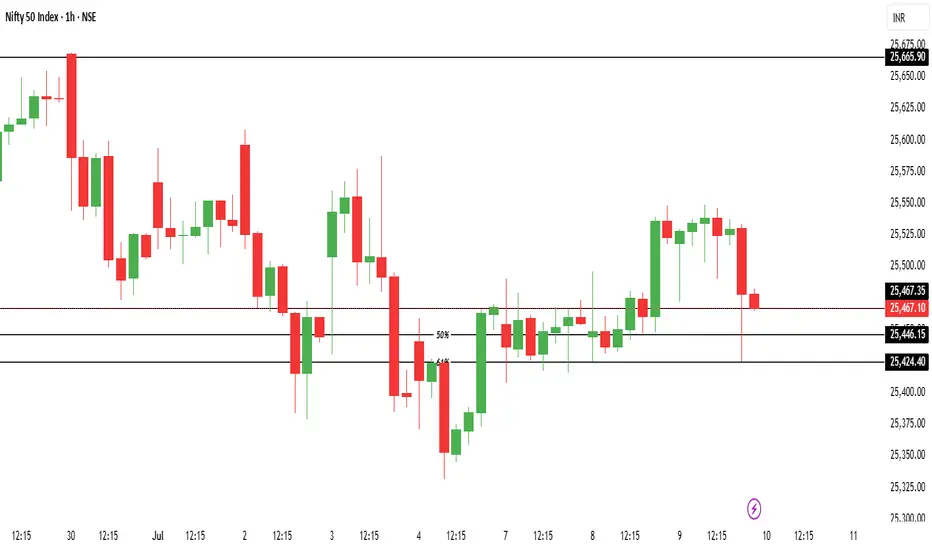
Nifty50 10-07-2025 Trend AnalysisNifty50 analysis 10-07-2025. Regardless the opening, long positions can be created at 25476 (PDC), 25446 or 25424 with swing/intraday potential targets 25665 & 25788.
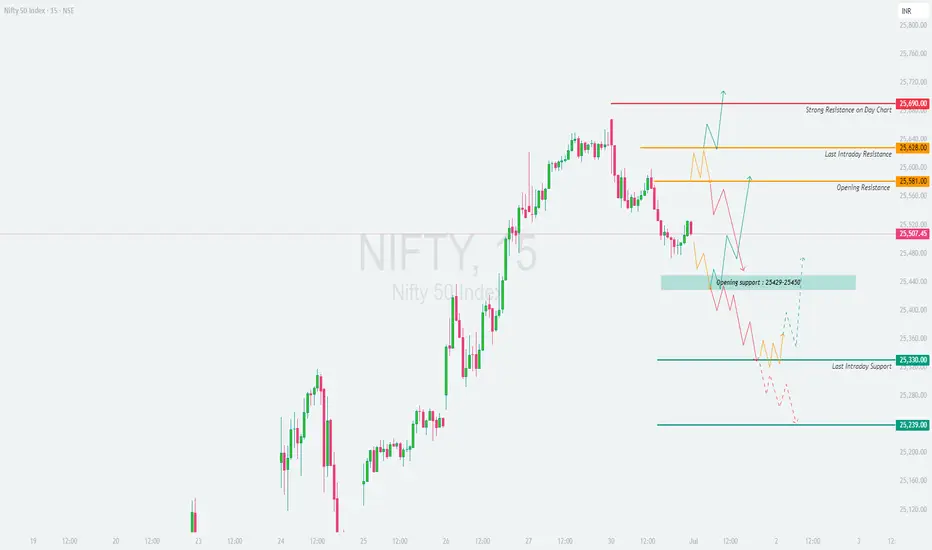
NIFTY - TRADING LEVELS AND PLAN FOR 01-JUL-2025
\ 📊 NIFTY TRADING PLAN – 1-Jul-2025\
📍 \ Previous Close:\ 25,507
📏 \ Gap Opening Consideration:\ ±100 points
🧭 \ Key Zones to Monitor:\
🔴 Strong Resistance on Day Chart: \ 25,690\
🟧 Last Intraday Resistance: \ 25,628 – 25,640\
🟨 Opening Resistance: \ 25,581\
🟦 Opening Support: \ 25,429 – 25,450\
🟩 Last Intraday Support: \ 25,330\
🟫 Final Support: \ 25,239\
---
\
\ \ 🚀 GAP-UP OPENING (Above 25,640):\
A gap-up above \ 25,640\ pushes Nifty into the \ Strong Resistance zone\ visible on the daily chart. This area may trigger profit booking unless broken with strong volume and momentum.
✅ \ Plan of Action:\
• Wait for a 15-min candle close above 25,690 for confirmation of breakout
• If price stalls or forms reversal patterns, initiate short trade setups
• Only aggressive buyers may consider long trades above 25,690 if follow-up candles are strong
🎯 \ Trade Setup:\
– \ Buy above:\ 25,690, SL: 25,628, Target: Trailing towards 25,750+
– \ Sell near resistance:\ 25,675–25,690 zone if reversal confirmed, SL: 25,705, Target: 25,581
📘 \ Tip:\ Avoid buying directly into resistance. Wait for a breakout + retest for cleaner entries.
\ \ ⚖️ FLAT OPENING (Near 25,500 – 25,540):\
Flat openings near the \ Opening Resistance (25,581)\ can create indecisive sideways moves in early sessions.
✅ \ Plan of Action:\
• If price breaks above 25,581 with strength, look for long trades
• If price faces rejection near 25,581 or 25,628, wait for breakdown below 25,507 to confirm weakness
• Below 25,507, next support lies at the 25,429–25,450 zone
🎯 \ Trade Setup:\
– \ Buy above breakout of 25,581, SL: 25,500, Target: 25,628–25,690
– \ Sell below 25,507, SL: 25,581, Target: 25,450 or lower
📘 \ Tip:\ Flat opens are best traded on confirmation candles, not assumptions. Avoid overtrading.
\ \ 📉 GAP-DOWN OPENING (Below 25,400):\
A gap-down below 25,400 opens the day near the \ Opening Support zone of 25,429–25,450\ . This area is critical — a bounce or breakdown will define the day.
✅ \ Plan of Action:\
• If price shows bullish reversal signs near 25,429, consider a pullback trade
• Breakdown of 25,429 with volume may extend downside toward 25,330 and even 25,239
• Avoid chasing long trades unless price stabilizes above 25,450
🎯 \ Trade Setup:\
– \ Buy near support:\ 25,429 with SL below 25,390, Target: 25,507
– \ Sell on breakdown below 25,429, SL: 25,450, Target: 25,330 – 25,239
📘 \ Tip:\ Gap-down opens attract trap setups. Let the market settle before committing.
---
\ 🧭 KEY LEVELS – QUICK REFERENCE:\
🔺 \ Strong Resistance:\ 25,690
🟧 \ Last Resistance:\ 25,628 – 25,640
🟨 \ Opening Resistance:\ 25,581
🟦 \ Opening Support:\ 25,429 – 25,450
🟩 \ Intraday Support:\ 25,330
🟥 \ Final Support:\ 25,239
---
\ 💡 OPTIONS TRADING – RISK MANAGEMENT TIPS:\
✅ Stick to \ defined range breakouts\ before entering directional trades
✅ Don’t overleverage into gap-ups/downs; let premiums cool
✅ \ Avoid selling naked options\ without clear structure
✅ Protect capital with \ hedged strategies\ like debit spreads
✅ \ Exit when your reason is invalidated\ , not when SL hits randomly
🛡️ \ Always use stop-losses\ , especially in high-IV environments.
---
\ 📌 SUMMARY:\
• 📈 \ Bullish above:\ 25,581 → 25,640 → 25,690
• 📉 \ Bearish below:\ 25,507 → 25,429 → 25,330
• 🚫 \ No trade zone:\ 25,507–25,581 (if inside, wait for clarity)
🎯 \ Focus Zones:\
– Long breakout above 25,581
– Short breakdown below 25,429
– Reversal plays at 25,429 or 25,239 if structure supports
---
\ ⚠️ DISCLAIMER:\
I am not a SEBI-registered analyst. This content is shared only for educational purposes. Please do your own analysis or consult a professional financial advisor before taking trades. Risk management is essential—never trade without a stop-loss and always protect your capital.
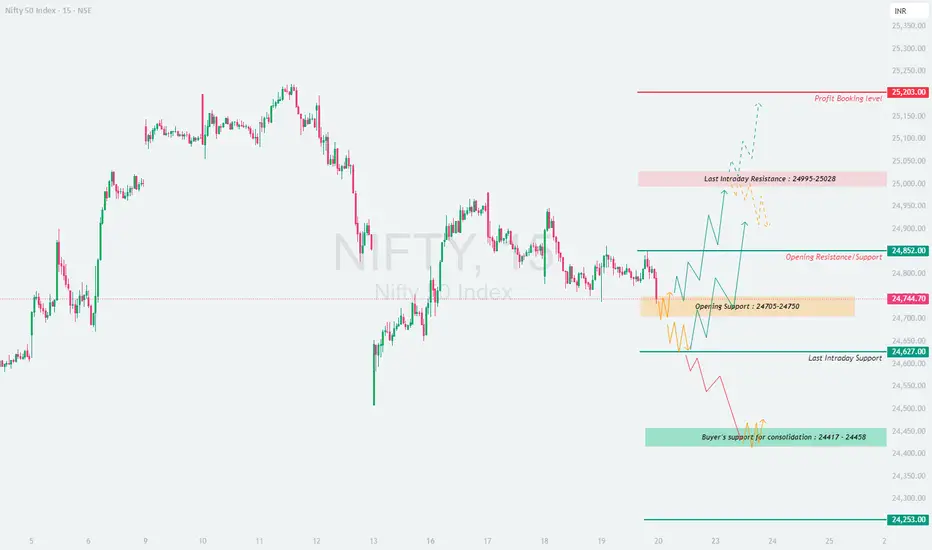
NIFTY : Trading Plan and levels for 20-Jun-2025📊 NIFTY TRADING PLAN – 20-Jun-2025
📍 Previous Close: 24,744.70
📏 Gap Opening Threshold: 100+ points
🕰 Chart Timeframe: 15-min
🔼 GAP-UP OPENING (Above 24,852):
If Nifty opens more than 100 points higher, above the key zone of 24,852 (Opening Resistance/Support) , we step into a potential breakout scenario.
✅ Plan of Action:
• Let the first 15–30 min candles settle — especially if price opens near the Last Intraday Resistance zone (24,995 – 25,028) .
• Break and sustain above 25,028: Long trade possible toward Profit Booking Level – 25,203
• Price rejects 25,028 zone: Prepare for reversal trades back toward 24,852–24,750
• SL for longs can be below 24,950 if breakout sustains; use trailing SL near highs to protect profits.
📘 Educational Tip: On gap-ups, avoid chasing blindly. Wait for price to sustain above prior resistance levels. Confirmation + momentum = higher probability trades .
⚖️ FLAT OPENING (Between 24,705 – 24,852):
This is the decision zone between buyers and sellers. A flat open means market is seeking direction.
✅ Plan of Action:
• If price holds above 24,750 and breaks 24,852: Go long toward 24,995–25,028
• If price breaks below 24,705: Initiate short trades toward 24,627 zone
• Avoid trading inside the tight range of 24,705–24,750 unless volume breaks either side
• Ideal long above 24,852 with SL below 24,800; Ideal short below 24,705 with SL above 24,750
📘 Educational Tip: Flat opens inside narrow zones are best suited for breakout traders – let the market choose direction, then follow with discipline.
🔽 GAP-DOWN OPENING (Below 24,627):
Gap-downs may test the buyer’s patience — but provide clean setups if you’re patient and precise. Key support lies near 24,417 – 24,458 (Buyer’s Support for consolidation) .
✅ Plan of Action:
• If price opens near 24,627 and breaks lower: Short trade till 24,450 zone
• Inside the buyer’s support zone (24,417–24,458), look for reversal signals (hammer, bullish engulfing) for longs
• If price rebounds strongly from 24,417 zone → go long toward 24,627 again
• Only short below 24,417 if high volume breakdown is visible — else expect bounce
📘 Educational Tip: Avoid shorting blindly near major demand zones. Wait for clean breakdown candles with follow-through. This protects against trap-based reversals .
🛡 OPTIONS TRADING RISK MANAGEMENT:
✅ 1. Avoid trades in the first 5-min candle — wait for structure to build
✅ 2. Position sizing = key — don't overleverage due to emotions from gap opens
✅ 3. Time decay is real — exit out-of-money options early if momentum fails
✅ 4. Prefer spreads when IV is high (e.g., Bull Call / Bear Put)
✅ 5. Always keep exit plan ready — use 15-min candle close-based SL
📌 SUMMARY – KEY LEVELS FOR 19-Jun-2025:
• 🟢 Bullish above: 24,852 → Target: 24,995 → 25,028 → 25,203
• 🔴 Bearish below: 24,705 → Target: 24,627 → 24,458 → 24,417
• 🟧 Opening Support Zone: 24,705–24,750
• 🟥 Resistance for Booking: 25,028–25,203
• 🟩 Buyer’s Zone: 24,417–24,458 — expect demand to return
📌 Decision Level: 24,852 — above this, bulls lead; below 24,705, bears gain control.
📢 DISCLAIMER: I am not a SEBI-registered analyst. This plan is created purely for educational purposes based on price action. Please consult your financial advisor before taking any trade or investment action.
Last one dance for NIFTY!!!!!!Scenario 1 ;
As per my analysis of nifty is declining with tight movement for last few days( consolidating lower)
Yesterday price rejected from one hour(1h) order block(ob) after that it moves quiet good.
For that reason ,today I am expecting more bullish in nifty( aggressive bullish).
Expecting +3% movement.
Scenario 2 ;
If nifty break and close below yesterday low, then it's all going to fall( sharp decline) from the sky to sharp edge of
the mountain( get support) and slowly tears ( after that slowly consolidating lower).
Expecting -5% movement.
Do your own analysis before taking trades. Peace.

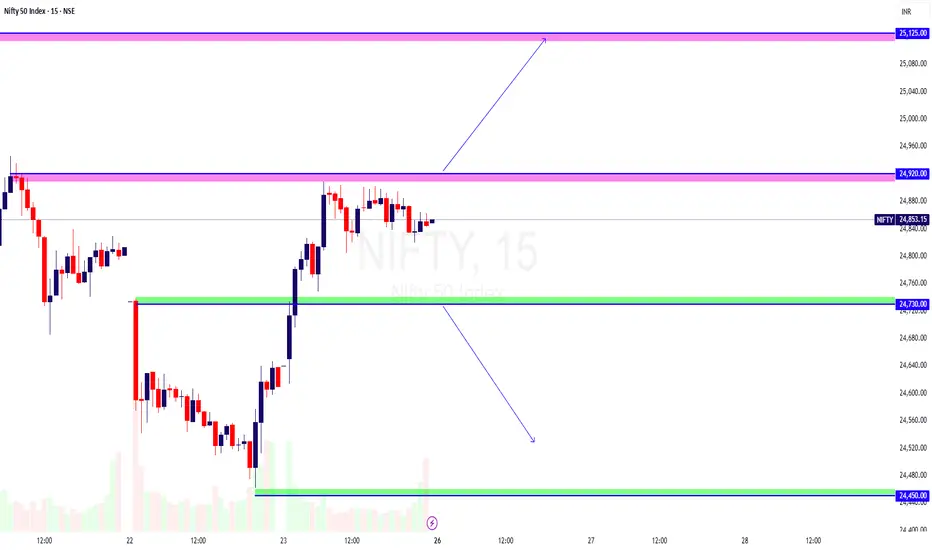
NIFTY Intraday Trade Setup For 26 May 2025Key Levels are 24920 and 24730. For directional trade one should wait for this range to break either side. Hourly resistance lies near 25125, breakout of which will take NIFTY towards 25550.
I am Not SEBI Registered
This is my personal analysis for my personal trading. Kindly consult your financial advisor before taking any actions based on this.
Nifty 25500!!!As per technical analysis this week shows so much bullish
So my target is 25100 then manage the position to 25500.
Try to enter at one hour fvg, as I shown in the chart or else you can enter with your model.
This week is going to be a massive week.

NIFTY TO 25500!!! Don't miss.Price is now consolidating and trading inside the daily fvg.
For me today or tomorrow it will reach 25500 in points.
Just analysis and try to take a position by yourself model.
Or else just buy an ITM option and wait for price to reach 25500 literally+2% move.
It's your own risk, before take a trade , do your own analysis.

Nifty Intraday Levels : 19-May-25
Nifty Break Resistance and closed above of 25000,
Also above Trendline Support on 30 Min Timeframe.
Important zones mentioned on chart
Bearish < 25850
Bullish > 25050
Wait for Proper Rejection/Pattern :
@Support : Bullish
@Resistance : Bearish
*All views for educational purpose only
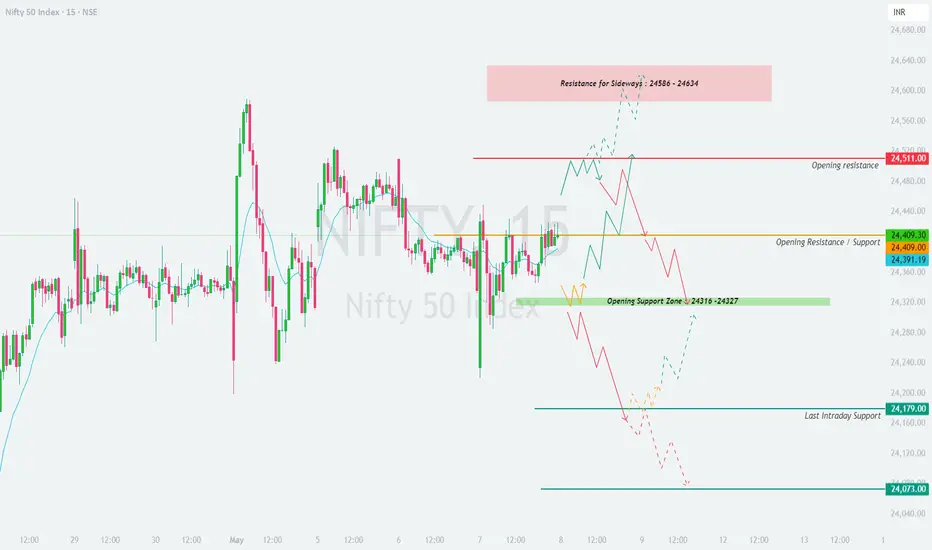
NIFTY : Trading Levels and Plan for 08-May-2025📊 Nifty 50 Trading Plan for 8-May-2025
Timeframe: 15-Min | Previous Close: 24,409.30
🔎 Key Technical Levels to Watch:
🔴 Opening Resistance: 24,511
🟧 Opening Resistance / Support: 24,409
🟩 Support Zone: 24,320 – 24,280
🟦 Last Intraday Support: 24,179
🟢 Major Support Level: 24,073
📌 Sideways Resistance Zone: 24,586 – 24,634
🟢 1. Gap-Up Opening (📈 Opening above 24,509 — Gap of 100+ Points)
If Nifty opens above 24,509, it is entering the Opening Resistance Zone . A strong open near or within 24,586 – 24,634 (marked as Sideways Resistance) needs cautious handling.
✅ Plan of Action:
- Avoid chasing longs immediately into this resistance zone.
- Wait for the first 15–30 minutes to observe whether buyers sustain above 24,586.
- If price consolidates above 24,586 and gives a breakout with volume, it may test higher levels intraday.
- However, if price faces rejection (like long upper wicks or bearish engulfing candles), initiate shorts below 24,511 for targets of 24,409 and possibly 24,320 – 24,280.
📝 Educational Insight: Gap-up openings into resistance zones often trap late buyers. Wait for confirmation in the form of retests or strong follow-through candles before taking trades.
🟡 2. Flat Opening (🔄 Between 24,309 – 24,509)
If Nifty opens flat near 24,409 (previous close), the market will likely consolidate in the initial minutes.
✅ Plan of Action:
- Observe the price action within the first 15-minute candle.
- If price sustains above 24,409, look for a move toward 24,511. A breakout above that may attempt to test the 24,586 – 24,634 resistance zone.
- On the downside, if price breaks and sustains below 24,320, expect selling pressure towards 24,179.
- Be flexible and neutral at open. Let the initial 30-minute range define the trend.
📝 Educational Insight: Flat opens offer great opportunity to play breakout/breakdown setups. Wait for a strong directional move from the initial balance zone before entering trades.
🔴 3. Gap-Down Opening (📉 Opening below 24,309 — Gap of 100+ Points)
A gap-down open below 24,309, especially near or under the support zone of 24,320 – 24,280, demands caution and strategic planning.
✅ Plan of Action:
- If the price opens around 24,280 – 24,179 zone, check for immediate bounce or sideways consolidation.
- A bullish reversal candle (hammer, bullish engulfing) around this zone can lead to a bounce back towards 24,409.
- However, if price breaks 24,179 decisively, and a 15-min candle closes below it, a quick slide towards 24,073 is likely.
- Do not catch falling knives—wait for a retest or formation of a base.
📝 Educational Insight: Gap-downs often create panic, but they also offer the best risk-reward trades if reversal patterns form near strong support zones. Let the market show you the strength.
💡 Risk Management Tips for Options Trading:
📏 Size your positions properly: Never risk more than 1–2% of your capital in one trade.
🕒 Time your trades: Avoid aggressive buying post 11:30 AM unless clear direction emerges.
📉 Avoid averaging losing positions in options; take the SL and re-enter with structure confirmation.
🛠️ Prefer hedged strategies like spreads or iron condors if volatility is high.
🔁 Use time-based exits (e.g., square off by 3:00 PM if momentum stalls).
📌 Summary & Conclusion:
Nifty is at a critical juncture with clear supply at 24,511 – 24,634 and support at 24,320 – 24,073.
For Gap-Up openings , caution near resistance is key—wait for breakout confirmation.
For Flat opens , let the range develop before breakout trades.
For Gap-Downs , avoid emotional trades—wait for proper reversal signals near 24,179 or 24,073.
Focus on quality setups, defined risk, and disciplined exits.
📢 Disclaimer:
I am not a SEBI-registered analyst. The above trading plan is intended purely for educational purposes. Please consult with your financial advisor before taking any trading or investment decisions.
Nifty this week is bearish but bullishFor me nifty may the weekly ob and got rejection from it.
The closing of nifty will be bearish this week end likely to reach fvg in weekly.
But after that it can move in upside( bullish). Grabing the LIQUIDITY from fvg then push higher.

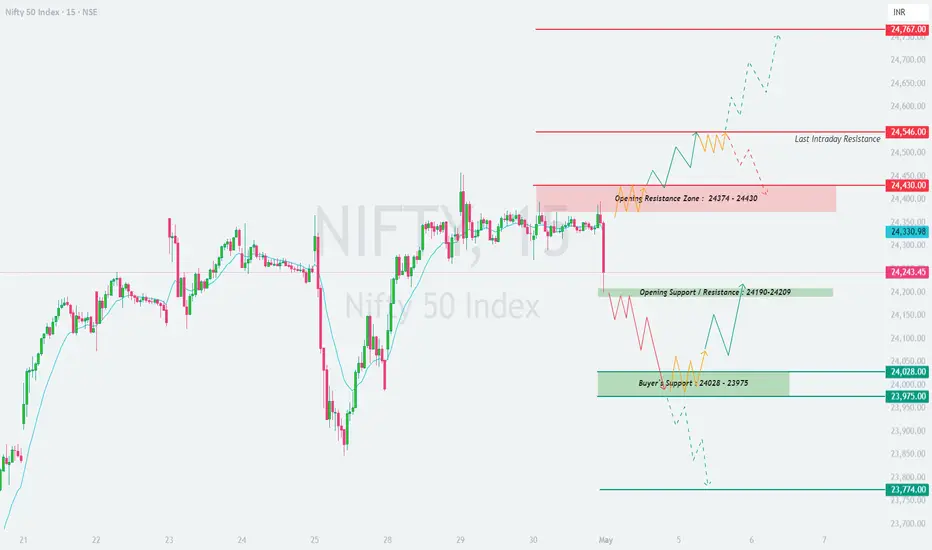
NIFTY : Trading Levels and Plan for 02-May-2025📊 NIFTY 15-Min Trading Plan for 2-May-2025
(Chart-Based | Gap Opening = 100+ Points)
📍 Previous Close: 24,243.45
📌 Key Chart Zones & Levels:
🔴 Last Intraday Resistance: 24,546
🟥 Opening Resistance Zone: 24,430 – 24,374
🟩 Opening Support/Resistance Zone: 24,209 – 24,190
🟢 Buyer's Support Zone: 24,028 – 23,975
🔻 Extreme Downside Support: 23,774
🟥 Scenario 1: Gap-Up Opening (Above 24,430) 🚀
If Nifty opens above 24,430 , we are opening directly into the resistance supply zone . Avoid blind longs here as sellers may initially step in.
A sustainable bullish structure above 24,430 with follow-through candles and volume is a must for any breakout trade toward 24,546 (Last Intraday Resistance).
If price rejects the zone and slips back under 24,374, expect a pullback toward 24,330–24,243 zone.
For upside targets beyond 24,546, strong momentum must be visible. Only then can traders look for 24,767 as an extension level.
If the gap-up fades quickly and dips below 24,374, this is a warning for potential "gap fade" sell-off.
📚 Educational Insight: Gaps into resistance need extra caution. Early buyers often get trapped. Let the structure form before committing to trades.
🟨 Scenario 2: Flat Opening (Between 24,209 – 24,430) ⚖️
A flat open puts Nifty inside the consolidation or decision zone . Expect both buyers and sellers to remain active here.
Avoid early trades in the first 15–30 minutes. Let price test the upper resistance (24,430) or lower support (24,209).
If Nifty breaks and sustains above 24,430, trend may attempt to reach 24,546 and possibly 24,767.
If Nifty dips below 24,209, a quick move toward 24,028 – 23,975 zone is possible. Look for bullish reversal candles here before buying.
Range-bound price action likely unless breakout or breakdown triggers with strength. Stay reactive, not predictive.
📚 Educational Insight: Neutral opens often give the best trade setups—but only after price reacts to zone boundaries. Wait for confirmation.
🟩 Scenario 3: Gap-Down Opening (Below 24,209) 📉
A gap-down below 24,209 brings immediate attention to 24,028 – 23,975, a critical Buyer's Support Zone .
If price shows reversal patterns (bullish engulfing, hammer) near this zone with good volume, long entries with stops below 23,975 are favorable.
Failing to hold 23,975 will open gates to a deeper fall toward 23,774, the next visual support.
Avoid aggressive long trades just because prices are lower—structure matters more than location.
Breakdown below 23,975 with strong bearish candles can trigger fresh short trades targeting 23,774 or even lower zones.
📚 Educational Insight: Gaps into demand zones offer great risk-reward, but only if supported by price confirmation. Avoid catching falling knives without structure.
🛡️ Options Risk Management Tips for Intraday Traders 🧠
Never trade naked options blindly in high IV zones. Use spreads (like bull call or bear put) for defined risk setups.
Don’t jump into trades in the first 5–10 minutes—option premiums are inflated. Let them settle.
Always trade with a defined stop loss . Avoid averaging losses.
Keep daily loss limits (e.g., 2% of capital) and walk away once hit. Discipline is key.
Avoid overleveraging OTM options; go ITM for directional conviction or use hedge legs.
Know when NOT to trade—sideways and indecisive markets destroy premium buyers.
Don’t convert intraday trades into swings emotionally. Stick to your plan.
📌 Summary & Conclusion 📝
✅ Gap-Up Opening: Watch 24,430–24,546 zone for reversal or breakout confirmation. Avoid aggressive longs without strength.
✅ Flat Opening: Neutral zone. Best setups may form after breakout/breakdown. Wait for edge-based reactions.
✅ Gap-Down Opening: Focus on 24,028–23,975 demand zone for reversal. Fresh shorts only below 23,975.
🎯 Trade with structure, confirmation, and risk control . Let price come to your plan—don’t chase emotions.
⚠️ Disclaimer:
I am not a SEBI-registered analyst. This analysis is intended solely for educational purposes. Please consult a certified financial advisor before making any trading or investment decisions.
#nifty50 ANALYSIS FOR TOMORROWNSE:NIFTY
#nifty50 ANALYSIS FOR TOMORROW 🔺
❇️ IMPORTANT LEVELS 🚀
❇️ Support: 24235-24086-23925-23807
❇️ Resistance: 24321-24450-24522
👉🏻 PURPLE LINE: 24235-24200 is a key level for buying and selling.
👉🏻 thetradeforecast 🇮🇳

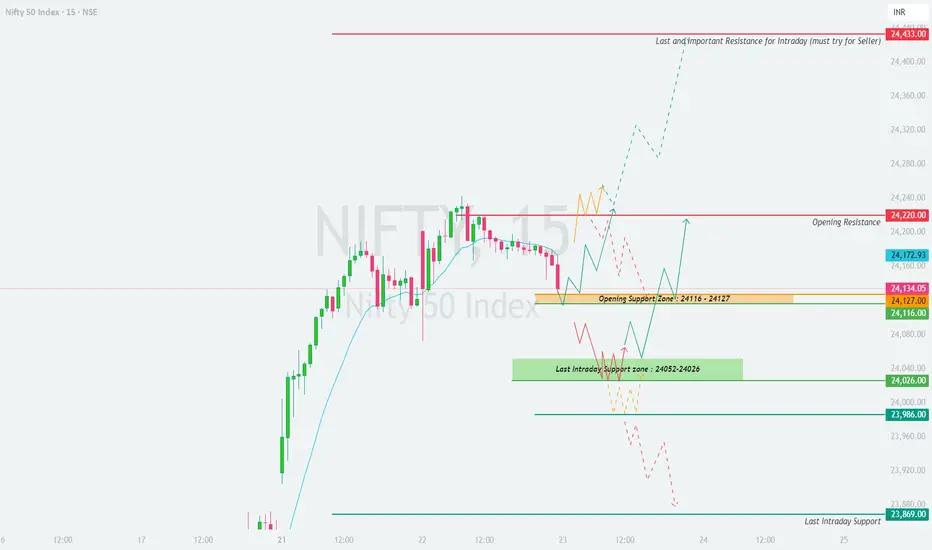
NIFTY : Trading levels and Plan for 23-Apr-2025📊 NIFTY Intraday Trading Plan – 23-Apr-2025
Timeframe: 15-minute
Previous Close: 24,134.05
📌 Key Zones Marked on the Chart:
🟥 Opening Resistance: 24,220
🔴 Major Resistance Zone (Short opportunity): 24,433
🟧 Opening Support Zone: 24,116 – 24,127
🟩 Last Intraday Support Zone: 24,052 – 24,026
🔵 Final Intraday Support: 23,869
🟥 Scenario 1: Gap-Up Opening (Above 24,234 – i.e. +100 points)
If Nifty opens above 24,234, it will be above the immediate resistance zone of 24,220. This brings it closer to the 24,433 level — a last-resort intraday resistance that’s a key zone for aggressive short sellers.
Watch for price behavior near 24,433. If Nifty gives wick rejections or bearish engulfing candles , this is a low-risk shorting opportunity.
Targets on downside would be 24,220 and 24,127, with a stop loss above 24,470.
If price consolidates above 24,433 for more than 30 minutes, expect a breakout toward 24,500+. Use a bull call spread instead of naked options to control risk.
💡 Educational Note: Strong opening gaps tend to invite profit booking near supply zones. Always wait for price confirmation before entering.
🟨 Scenario 2: Flat Opening (Between 24,127 – 24,220)
This scenario keeps Nifty in a neutral yet sensitive range between the support and resistance levels. Traders should be patient and wait for breakout or breakdown confirmation.
If Nifty breaks above 24,220 with volume, it may attempt 24,300–24,433. Buy with a tight SL of 24,170.
If Nifty sustains below 24,116, price may drift towards 24,052 – 24,026. Consider puts or bear spreads below 24,116.
Avoid initiating trades in the first 15 minutes. Let the market structure itself after opening volatility.
💡 Educational Note: In flat openings, the first 3 candles of the day often decide direction. Focus on volume and price range contraction or expansion for clues.
🟩 Scenario 3: Gap-Down Opening (Below 24,034 – i.e. -100 points)
A gap-down below 24,034 will place Nifty directly into the Last Intraday Support Zone: 24,052 – 24,026 . This is a critical area for reversal setups or further breakdown.
If this zone holds and we see a bullish hammer or strong green engulfing candle, a counter-trend bounce toward 24,116 is possible.
If Nifty breaks below 24,026 and sustains, watch for a fall to 23,986 or even 23,869. This is a bearish momentum zone.
Avoid long trades until the price forms a base above 24,026 again.
💡 Educational Note: A gap-down into a known support zone creates high emotion. Don’t be tempted to buy blindly – always wait for support-holding confirmation .
🛡️ Options Trading Risk Management Tips
Always use defined SL (stop loss) while trading directional options.
Avoid trading OTM options alone on Wednesdays and Thursdays due to higher theta decay.
Use spreads like Bull Call / Bear Put to reduce cost and hedge risk.
Do not take trades based on bias. Let price structure guide your decision.
Never risk more than 2–3% of your capital per trade , especially in volatile conditions.
📘 Summary & Conclusion
📍 Important Levels:
🔺 Resistance: 24,220 | 24,433
⚠️ Opening Support: 24,116 – 24,127
🔻 Lower Supports: 24,052 | 24,026 | 23,986 | 23,869
🎯 On 23-Apr-2025, observe the first 15-minute candle carefully for structure. Trade only on confirmed breakout/breakdown from defined zones .
Use well-hedged strategies when near volatile support/resistance levels. Keep emotions in check and stay adaptive.
⚠️ Disclaimer: I am not a SEBI-registered analyst . This trading plan is shared purely for educational purposes . Please consult your financial advisor before making any trading decisions.
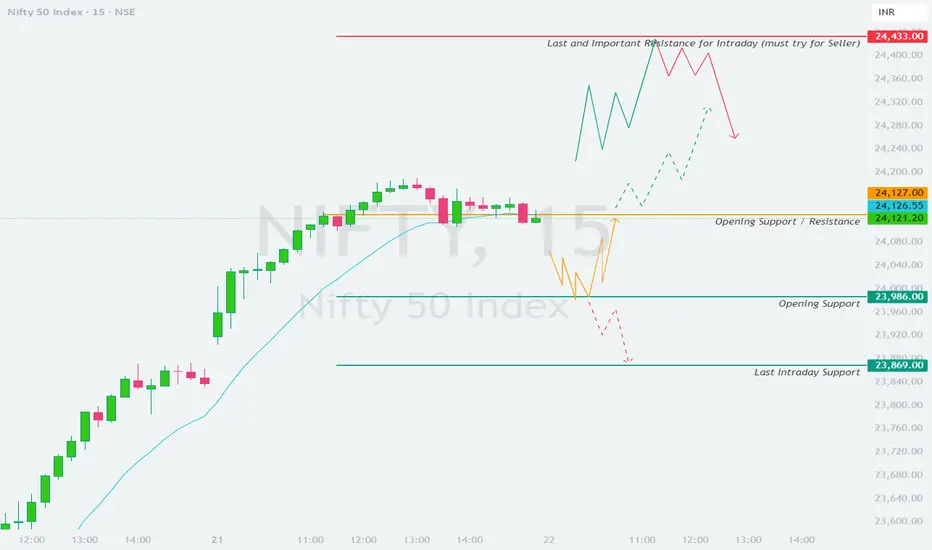
NIFTY : Trading Levels and Plan for 22-Apr-2025📘 NIFTY TRADING PLAN – 22-Apr-2025
📊 Index Spot Close: 24,121.20 | ⏱ Timeframe: 15-Min | 🚪 Gap Opening Threshold: 100+ Points
🔼 Scenario 1: Gap-Up Opening (Above 24,221+)
A gap-up opening above 24,221 will push Nifty into a zone where sellers will likely get active. The chart highlights 24,433 as a "must try for sellers" level — this acts as the last important intraday resistance. Sustained movement beyond this level would be a bullish breakout, but chances of intraday reversal increase as price nears this resistance.
📌 Plan of Action:
Wait for the first 15–30 minutes to settle the gap-up volatility. Don't chase the first green candle.
If price sustains above 24,221 and starts climbing toward 24,433, watch for a rejection wick or bearish engulfing candle near that level to plan shorts.
Ideal short opportunity arises if price touches 24,433 and then shows weakness — keep SL just above 24,460, target could be 24,280 → 24,127.
If price consolidates above 24,433 without signs of exhaustion, consider it a bullish continuation setup. In that case, adopt a breakout-retest strategy with SL below 24,400.
Aggressive buyers can look for retest around 24,221–24,280 zone for a possible long setup toward uncharted zones.
💡 Educational Insight:
Gap-ups near major resistances are tricky — markets often use such openings for distribution. Watch price behavior at key levels instead of assuming breakout or reversal in advance.
⚖️ Scenario 2: Flat Opening (Between 24,020 – 24,221)
A flat opening within this range keeps Nifty in the current supply zone. The chart shows that 24,127 acts as a critical structure – previously both as resistance and a congestion area.
📌 Plan of Action:
Let the market settle. If price holds above 24,127 for 15–30 minutes, intraday strength may follow toward 24,221 → 24,280.
Longs can be initiated above 24,150 with tight SL below 24,120 and targets near 24,221.
On the flip side, if Nifty starts rejecting 24,127, consider intraday shorts with SL above 24,150. Target on downside could be 24,000 → 23,986.
Be cautious about trading within a choppy range of 24,050–24,127 – breakout or breakdown from this area will provide cleaner moves.
Wait for directional confirmation through volume and momentum indicators like RSI or VWAP reaction.
💡 Educational Insight:
Flat openings near previous congestion levels often offer clean breakouts or breakdowns. Let the price action confirm direction – patience pays in such setups.
🔽 Scenario 3: Gap-Down Opening (Below 24,020–23,986)
A gap-down below the 23,986 support area would indicate potential profit booking or intraday reversal. The key support to monitor is 23,869 – labeled as "last intraday support" on your chart.
📌 Plan of Action:
Do not enter trades immediately on the gap-down. Let the price show its intent in the first 15–30 mins.
If price sustains below 23,986 and breaks 23,869, intraday weakness can accelerate with downside targets at 23,800 → 23,720.
Intraday shorts can be initiated on breakdowns below 23,869 with SL above 23,900.
If price bounces back and reclaims 23,986, avoid fresh shorts — this could be a trap for sellers.
Aggressive reversal traders can look for bullish price action near 23,869 — a hammer or bullish engulfing candle with volume might offer a low-risk bounce trade toward 24,000.
💡 Educational Insight:
Gap-downs into key support zones often trap emotional sellers. Let price confirm breakdown — don’t assume it. Wait for candle confirmation before acting.
🛡️ Risk Management Tips for Options Traders 💼🧠
✅ Don’t trade first 15–30 minutes — let the market show intent.
✅ Use ITM or ATM options for better delta and less time decay.
✅ Position sizing is key — don’t risk more than 1–2% of capital on one trade.
✅ Avoid revenge trading — step back after a loss and reassess.
✅ Avoid averaging losers — have a clear SL and respect it.
✅ Don’t chase moves — especially after gaps; wait for retests.
✅ Maintain a trading journal — log entry/exit and reason behind trade.
✅ In volatile markets, hedge directional bets with spreads if needed.
🧾 Summary & Conclusion 🧠📊
📍 Gap-Up (Above 24,221): Sellers may get active near 24,433; watch for reversal signs.
📍 Flat Open (24,020–24,221): Critical level is 24,127 — breakout leads to 24,280, rejection leads to 23,986.
📍 Gap-Down (Below 24,020): Breakdown below 23,869 can trigger further fall; else, watch for bounce attempts.
📍 Zone to Monitor Closely: 24,127 and 23,986 — act as pivotal levels for intraday structure.
🧘♂️ Final Note: Trade levels, not emotions. Capital protection is the first job of a trader. Stick to your process and trust your risk management — opportunities will come.
⚠️ Disclaimer:
I am not a SEBI-registered analyst . This trading plan is prepared purely for educational purposes only . Kindly consult with your financial advisor before making any investment or trading decisions. Markets involve risk — please use strict stop-loss and position sizing.
NIFTY INTRADAY TARGET 200 POINTS..22350 TO 22550Nifty strong above 22350
there is no resistance upto 22500 and 22550
wait for active mode
Buy above 22350
Stoploss............22290.....60 points
Target1.............22420.....70 points
Target2.............22500.....150 points
Target3..Risk.......22550++++200 points
Disclaimer - This level only for educational purpose only. Do ur own analyis

NIFTY READY TO FLY 250 points..22010 to 22250++NIFTY NEXT UPSIDE POSSIBLE above 22010
There is no resistance upto 22250
wait for active zone
Buy above 22010
Stoploss......21935..........85 points
Target1..........22070.........60 points
Target2...........22170........160 points
Target3............22250.......250 points ++
Disclaimer- This level only for education purpose only

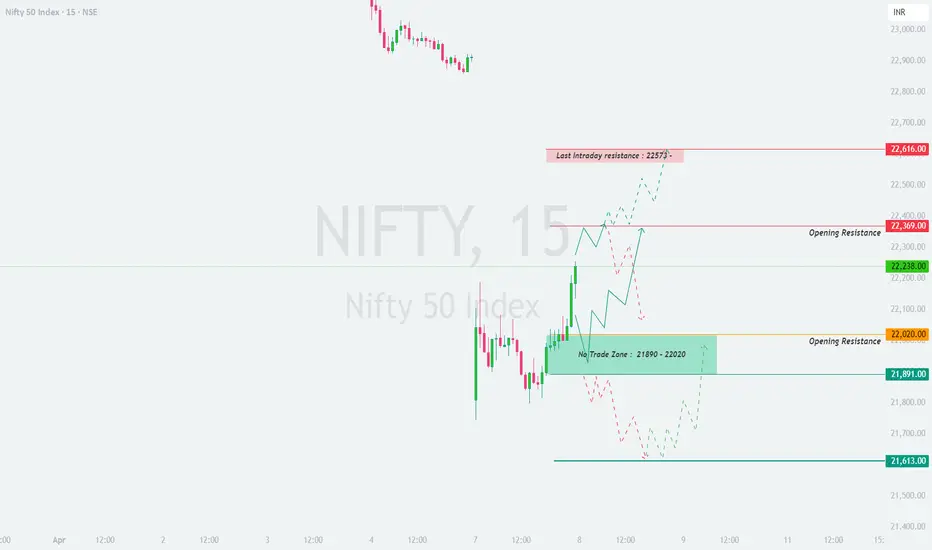
NIFTY : Intraday Trading levels and plan for 08-Apr-2025📊 NIFTY TRADING PLAN – 08-Apr-2025
Chart Timeframe: 15-Minute
Previous Close: 22,238.00
🔍 Key Zones to Watch:
🔴 Last Intraday Resistance: 22,573 – 22,616
🟠 Opening Resistance Zone: 22,369
🟧 Lower Opening Resistance: 22,020
🟩 No Trade Zone: 21,890 – 22,020
🟢 Opening Support Zone: 21,891
🟢 Last Support Zone: 21,613
🔼 Scenario 1: Gap-Up Opening (Above 100+ points, i.e., opens above 22,339)
If Nifty opens above 22,339 , we are above the immediate Opening Resistance and nearing the Intraday Resistance Zone of 22,573 – 22,616 .
📌 Plan of Action:
Wait for the first 15–30 minutes. If the index retests 22,369 and forms a bullish reversal (hammer, bullish engulfing), one can consider going long for targets 22,500 → 22,573 → 22,616 .
If price directly opens around 22,550+ , avoid chasing highs. It may trap long positions. Look for signs of exhaustion near 22,573 – 22,616 .
A breakdown below 22,369 with a 15-min candle close can shift bias to negative — expect a move down to 22,200 → 22,020 .
Do not enter trades immediately at open. Let price develop structure, preferably a retest of breakout level.
💡 Educational Tip: A gap-up near resistance often faces selling pressure. Trade only on confirmation, not assumptions.
⚖️ Scenario 2: Flat Opening (Within 22,138 – 22,339)
A flat open around the previous close 22,238 brings price inside a reaction zone between 22,020 – 22,369 .
📌 Plan of Action:
If Nifty sustains above 22,369 with strong price action, go long for 22,500 – 22,573 – 22,616 .
If price faces resistance at 22,369 and reverses, short opportunities open with targets at 22,138 → 22,020 → 21,891 .
Avoid initiating trades inside the No Trade Zone: 21,890 – 22,020 , as it could lead to choppy price action and stop hunts.
Best strategy is to wait for breakout/breakdown of range and follow the move with a tight SL.
💡 Educational Tip: Sideways zones are often used by big players to trap retail traders. Focus on breakout trades with confirmation.
🔽 Scenario 3: Gap-Down Opening (Below 100+ points, i.e., opens below 22,138)
If Nifty opens below 22,138 , it will likely test the lower boundary of the No Trade Zone or even the Opening Support Zone at 21,891 .
📌 Plan of Action:
Look for buying opportunities only if price finds support around 21,891 – 21,613 with bullish reversal candles (e.g., morning star, double bottom).
If price breaks below 21,891 and sustains, it could fall toward 21,613 — go short on retests or lower high formations.
If reversal is confirmed from support zone, expect a bounce toward 22,020 – 22,138 .
Avoid trading the first candle unless setup is clear. Let price form a base before going long.
💡 Educational Tip: Strong support zones are best used for reversal setups, but only with confirmation and tight stop-loss.
🛡️ Options Trading Risk Management Tips
✅ Avoid Buying Far OTM Options blindly: Theta decay will eat premium fast if price consolidates.
✅ Use Spreads like Bull Call/Bear Put for safer entries: Lower cost and defined risk.
✅ Stick to Defined SL (15-min candle based): Helps avoid whipsaw exits and emotional decisions.
✅ Don’t Overtrade Inside the No Trade Zone: Wait for breakout or breakdown before initiating trades.
✅ Position Sizing is Key: Never risk more than 2% of capital on a single trade.
✅ Watch Option IV Before Entry: High IV → premiums inflated. Sell strategies work better in those conditions.
📌 Summary & Conclusion
Bullish Above: 22,369 → 22,500 → 22,573 → 22,616
Bearish Below: 22,020 → 21,891 → 21,613
No Trade Zone: 21,890 – 22,020
🧠 Best Setups: Reversal near strong support/resistance or breakout retest entries.
⏱️ First 15–30 mins are for observation: Let the market show its hand.
🧘 Discipline > Direction: Stick to process and your setup. Not every candle needs a trade.
⚠️ Disclaimer
I am not a SEBI-registered analyst . The above analysis is shared purely for educational and informational purposes . Please do your own research or consult a financial advisor before trading or investing. Trade responsibly with proper risk management.
BUY NIFTY 23450 PE 3rd April @ 100 - 105 | NIFTY SELL TRADENIFTY 23450 PE 3RD APR EXP
NIFTY OPTIONS BUYING TRADE
TIME FRAME RECOMMENDED TO TRACK TRADE: 5 MINS
Hi Traders,
The Nifty index opened with a gap down, and the 22,470 level is expected to serve as a key resistance zone, potentially creating a sell-on-rise opportunity. We recommend targeting the 23,450 Put Option (expiring on 3rd April within the price range of ₹100 - ₹105.
Target levels: ₹140 and ₹170.
Stop Loss (SL): ₹55
Regards,
OptionsDaddy Research Team

Nifty weekly analysis for 17/03/2025Nifty is trading between 100 EMA (weekly) and 20 EMA (daily). A good support from the weekly moving average is there and resistance on the daily charts.
A continuous support from 22300 level is there as the market has remained in a range whole week.
If the market tried to breach the support level, the support of weekly 100 EMA can be the other support around 22030 else it will take support around 21800.
In case the market starts to recover from the bottom and creates a higher high higher low formation it has to take out the resistance of 22650 and 22758.
Major levels are plotted in the charts. Just wait for the price action to confirm the entry into a trade else another sideways market can be seen.
Inside candle formation on the daily charts is also there and break out/down can be traded accordingly. Different trading approaches can help in capturing a good trade.
Wait for the price action near the levels before entering the market.

Nifty 22900 confirm!!!!!!!!!Last week I share I view, you can go and check out.
It's moving towards 22900 which 50% Fibonacci level.
For me today first one hour is pretty bullish so I anticipate that candle low can't be taken out.
So place stoploss at there and target 22900.
This is my trade stoploss and target.
Learn to trade by yourself is better for you.
Leave a comment.if you like.

Nifty key levels for 28.01.2025Nifty key levels for 28.01.2025
If Nifty breaks the upper or lower range, we can expect momentum. The consolidation zone will be favorable for option sellers, while a breakout on either side will benefit option buyers.
Disclaimer:
I'm not a SEBI Registered financial advisor. These views are purely educational in nature. You are solely responsible for any decisions made based on this research.
