Nifty Macro View & Context Weekly Outlook: Analysts expect rangMacro View & Context
Weekly Outlook: Analysts expect range-bound trading with continued consolidation under 25,000. Nifty rebounded from ~24,400 recently, but a breakout above 25,000 remains elusive. Toby-heavy cues are looking modestly optimistic, supported by domestic macro trends and auto sector strength.
F&O Expiry Dynamics: Weekly options now expire on Tuesday, meaning Monday becomes the new "expiry eve"—a day often marked by increased spot-vol vs. thin volumes and elevated theta (time decay) impact.
Recommended strategy: With limited move expected, options plays like short strangles can capitalize on low directional movement and theta decay.
Technicals Across Timeframes
1-Day (Daily Chart)
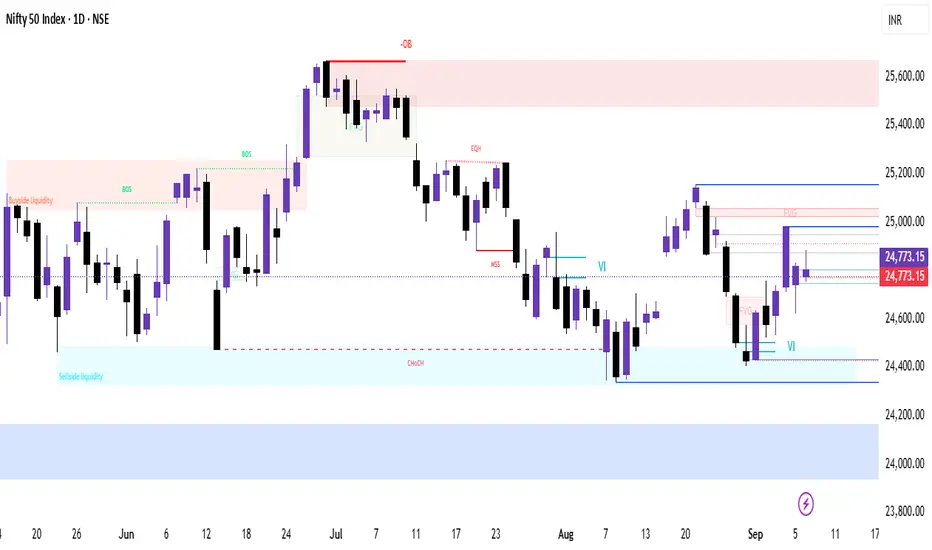
Overall tone: Neutral-to-cautious. Price is consolidating; indicators (like RSI & MACD) are flat—no strong directional bias.
4-Hour Chart
Current structure: Sideways rectangular consolidation, roughly between 24,400–25,000.
A breakout either way could define the weekly closing trend.
1-Hour Chart
Short-term setup: 70% of moving averages (20/50/100/200) show bullish bias, although some very short-term (5/10 MA) signals remain mixed — indicating stabilization above mid-range.
Pivot analysis shows key resistance near 24,852–24,875, and support near 24,750–24,730.
15-Minute Action Plan for Tomorrow (Expiry Eve)
Time-Based Setup (09:00–15:30)
Pre-Open to First 30 Minutes
Observe initial range; likely tight consolidation given expiry eve.
Key zone: 24,750–24,850 (intraday range).
Trade Execution Rules
Long Trade:
Trigger: 15-min candle closes above 24,850 with volume support.
Entry: Next candle's open (~24,860).
Targets: 24,900 → 24,950 → 25,000.
Stop-Loss: ~24,830.
Short Trade:
Trigger: 15-min candle closes below 24,750 with confirmation.
Entry: Next open (~24,740).
Targets: 24,700 → 24,650 → 24,600.
Stop-Loss: ~24,770.
Range Day Strategy (if neither breakout triggers)
Trade within the established 24,750–24,850 range.
Small scalps: buy near 24,760, sell near 24,840; stops tight (~5-10 pts).
Niftyintradaysetup
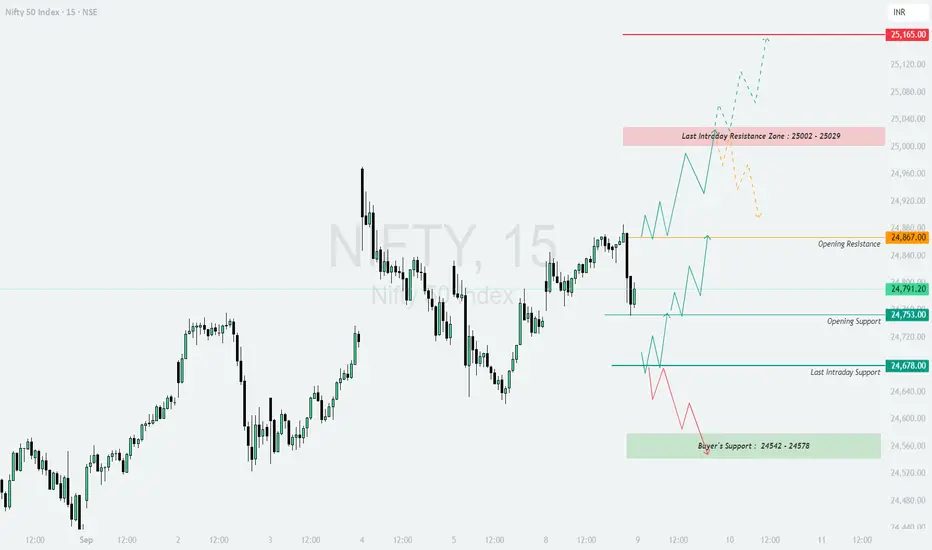
NIFTY : Trading levels and Plan for 09-Sep-2025NIFTY TRADING PLAN – 09-Sep-2025
📌 Key Levels to Watch :
Major Resistance Zone: 25,002 – 25,029
Upside Extension Resistance: 25,165
Opening Resistance: 24,867
Opening Support: 24,753
Last Intraday Support: 24,678
Buyer’s Support Zone: 24,542 – 24,578
The index is currently hovering in a consolidation phase, with clear resistance and support zones that will guide intraday moves. Price action near these levels will determine whether bulls or bears take control.
🔼 1. Gap-Up Opening (100+ points above 24,867)
If Nifty opens above the 24,867 opening resistance, it indicates strong bullish sentiment.
📌 Plan of Action :
Sustaining above 24,867 can push the index into the 25,002 – 25,029 resistance zone.
A breakout and stability above this zone may trigger a rally towards 25,165.
However, early profit booking is likely near 25,002–25,029, so traders must book partial gains and trail stop-losses.
👉 Educational Note: Gap-ups above resistance zones often trap late sellers. Patience is key — wait for at least 15–30 mins of confirmation before adding fresh longs.
➖ 2. Flat Opening (Around 24,750 – 24,820)
A flat opening provides a balanced start, allowing traders to align with early market sentiment.
📌 Plan of Action :
If Nifty sustains above 24,820, expect a move to retest 24,867, and possibly the 25,002–25,029 resistance zone.
Failure to hold 24,753 (opening support) can drag prices to 24,678.
Watch for intraday reversal candles near support zones to gauge whether buyers are defending.
👉 Educational Note: Flat openings are ideal for option writers. Buyers should wait for breakouts or breakdowns to avoid getting stuck in sideways chop.
🔽 3. Gap-Down Opening (100+ points below 24,700)
A gap-down below 24,700 can trigger nervousness among buyers and invite selling pressure.
📌 Plan of Action :
First support lies at 24,678 (last intraday support).
A breakdown below 24,678 could extend selling towards the Buyer’s Support Zone: 24,542–24,578.
If a sharp bounce occurs from this buyer’s zone, short-covering can quickly lift Nifty back to 24,753.
👉 Educational Note: Gap-downs create panic, but disciplined traders look for opportunities near strong supports. Avoid chasing shorts blindly after a big gap-down.
🛡️ Risk Management Tips for Options Traders
Always trade with a strict stop-loss on hourly closing basis.
Limit risk to 1–2% of total capital per trade .
Prefer option spreads (bull call spread / bear put spread) instead of naked calls or puts to reduce time decay impact.
Trail stop-losses as price moves in your favor — never let a winning trade turn into a loss.
Avoid overtrading in choppy zones between 24,753–24,867, as whipsaws are common there.
📌 Summary & Conclusion
🟢 Above 24,867 → Bullish continuation towards 25,002–25,029 and then 25,165 .
🟧 Flat Opening → Range-bound; strength above 24,820, weakness below 24,753 .
🔴 Below 24,700 → Bearish pressure, testing 24,678 and Buyer’s Zone 24,542–24,578 .
⚠️ Critical Zone: 25,002–25,029 (Last Intraday Resistance). Sustaining above this zone can ignite strong upside momentum.
⚠️ Disclaimer: I am not a SEBI-registered analyst. This analysis is for educational purposes only and should not be considered as financial advice. Please consult your financial advisor before making trading decisions.
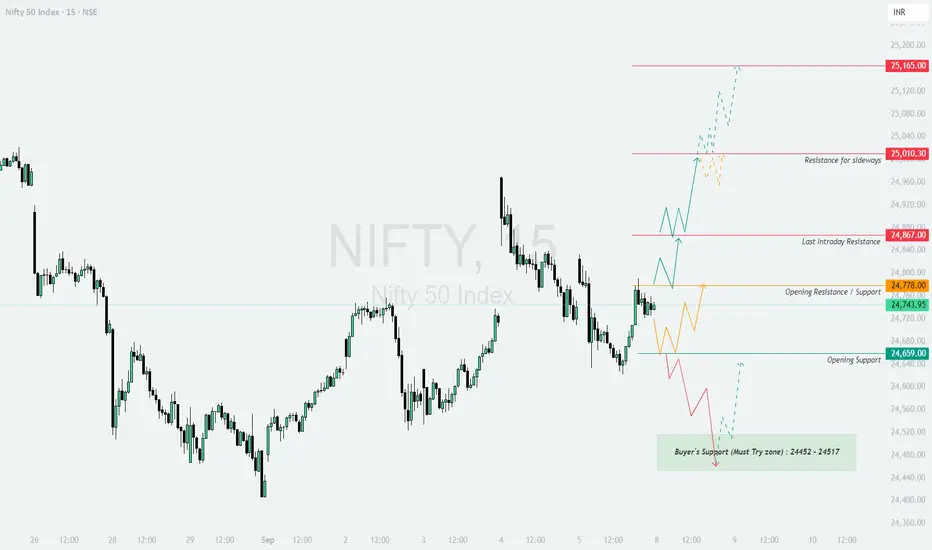
NIFTY : Trading levels and Plan for 08-Sep-2025NIFTY TRADING PLAN – 08-Sep-2025
📌 Key Levels to Watch :
Resistance for sideways: 25,010
Major Resistance: 25,165
Last Intraday Resistance: 24,867
Opening Resistance / Support: 24,778
Opening Support: 24,659
Buyer’s Support (Must Try Zone): 24,452 – 24,517
The market is trading near an inflection zone. The price reaction at these levels will guide the intraday trend.
🔼 1. Gap-Up Opening (100+ points above 24,867)
If Nifty opens strongly above 24,867, bulls will attempt to extend gains towards higher resistances.
📌 Plan of Action :
Sustaining above 24,867 will shift momentum towards 25,010.
A sideways consolidation can occur near 25,010, as it’s a critical resistance.
If Nifty manages to sustain above 25,010, the next big target is 25,165.
👉 Educational Note: Gap-ups near major resistances require confirmation. Always wait for a retest or sustained move before entering long positions.
➖ 2. Flat Opening (Around 24,720 – 24,780)
A flat start near 24,743 – 24,778 indicates indecision, with equal chances for bulls and bears.
📌 Plan of Action :
If Nifty sustains above 24,778, it can push towards 24,867.
A breakout above 24,867 strengthens the bullish momentum towards 25,010.
Failure to hold above 24,743 can drag Nifty back to 24,659 (opening support).
👉 Educational Note: Flat openings provide clarity after the first 30 minutes. Observe how price reacts around the opening resistance/support zone before taking trades.
🔽 3. Gap-Down Opening (100+ points below 24,640)
If Nifty opens with weakness below 24,640, sellers will try to dominate.
📌 Plan of Action :
Immediate test will be at 24,659; if broken, price may fall towards the buyer’s support zone 24,452 – 24,517.
A strong rebound is likely from this buyer’s support zone, as it is marked as a “must-try” level for bulls.
Sustaining below 24,452 will open deeper downside possibilities, turning the sentiment weak.
👉 Educational Note: Gap-downs often trigger panic selling. Instead of chasing the fall, wait for a retest of supports to catch a safer entry.
🛡️ Risk Management Tips for Options Traders
Always define a stop-loss based on hourly close to avoid getting trapped in volatility.
Keep position sizing small (1–2% of capital) in uncertain zones.
For gap-up/gap-down days, prefer directional option buying only after confirmation.
Use hedged strategies (like spreads) if trading near major support/resistance zones.
Book partial profits at intermediate levels to lock in gains.
📌 Summary & Conclusion
🟢 Above 24,867 → Bullish bias towards 25,010 & 25,165 .
🟧 Flat Opening → Watch 24,778 for breakout; above bullish, below weak .
🔴 Below 24,640 → Weakness towards 24,517 & 24,452 buyer’s support zone .
⚠️ Critical Zone: 24,452 – 24,517 (Buyer’s Support). A rebound here is highly probable, but if broken, weakness can accelerate.
⚠️ Disclaimer: I am not a SEBI-registered analyst. This analysis is for educational purposes only and should not be considered as financial advice. Please consult your financial advisor before trading.
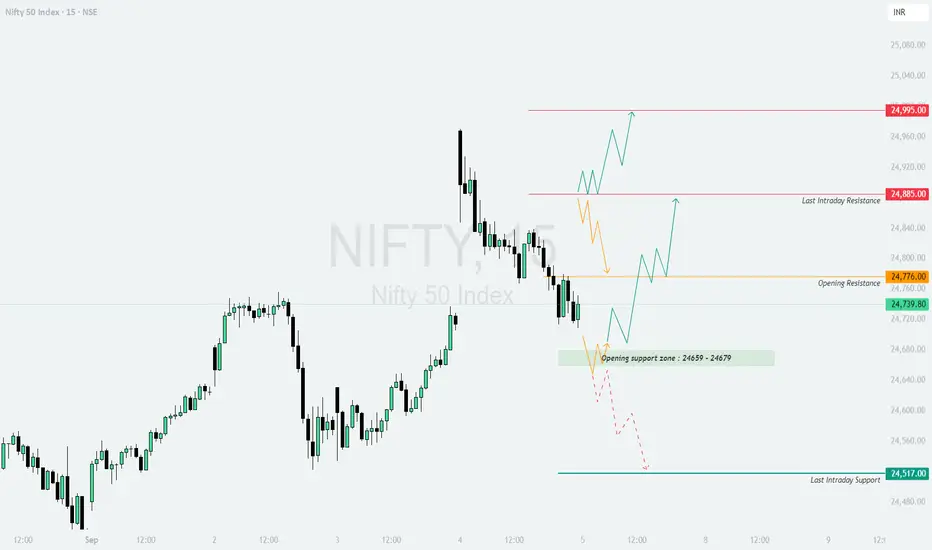
NIFTY : Trading levels and plan for 05-Sep-2025NIFTY TRADING PLAN – 05-Sep-2025
📌 Key Levels to Watch :
Opening Resistance: 24,776
Last Intraday Resistance: 24,885
Major Resistance: 24,995
Opening Support Zone: 24,659 – 24,679
Last Intraday Support: 24,517
The price action shows that Nifty is consolidating between strong support and resistance zones. The reaction around these levels will determine the day’s trend.
🔼 1. Gap-Up Opening (100+ points above 24,840)
If Nifty opens with a strong gap-up above 24,840, it will directly challenge the resistance zones.
📌 Plan of Action :
Sustaining above 24,885 (last intraday resistance) will indicate strength.
First upside target is 24,995, where profit booking could emerge.
If momentum sustains beyond 24,995, expect a breakout rally with strong bullish sentiment.
👉 Educational Note: Gap-ups near resistance require patience. Wait for confirmation candles before entering, as false breakouts are common at these levels.
➖ 2. Flat Opening (Around 24,720 – 24,780)
A flat start near the opening resistance indicates indecision and may lead to range-bound action initially.
📌 Plan of Action :
If Nifty sustains above 24,776, it can attempt to test 24,885.
A breakout above 24,885 strengthens the bullish trend towards 24,995.
Failure to hold above 24,720 can pull the index back into the support zone (24,659–24,679).
👉 Educational Note: Flat openings often provide the best opportunities as they allow traders to position based on the first 30 minutes of price action clarity.
🔽 3. Gap-Down Opening (100+ points below 24,620)
If Nifty opens below the support zone, sellers gain the upper hand.
📌 Plan of Action :
A gap-down below 24,620 will likely drag Nifty to retest 24,517 (last intraday support).
Sustaining below 24,517 may invite further downside pressure with intraday weakness.
Quick rebounds can occur, but unless Nifty reclaims 24,659, the trend remains bearish.
👉 Educational Note: Gap-downs usually trigger fear-driven moves. Avoid chasing the fall; instead, look for a retest of levels to confirm direction.
🛡️ Risk Management Tips for Options Traders
Always use stop losses on an hourly close basis to avoid false moves.
Limit exposure to 1–2% of capital per trade.
For uncertain days, consider deploying neutral strategies like straddles or strangles.
Scale out profits gradually instead of waiting for final targets.
Avoid over-leveraging; keep cash ready for adjustments.
📌 Summary & Conclusion
🟢 Above 24,885 → Bullish bias towards 24,995 and beyond .
🟧 Flat Opening (24,720 – 24,780) → Wait for a breakout above 24,776 for directional clarity .
🔴 Below 24,620 → Weakness towards 24,517 with risk of further downside .
⚠️ Critical Zone: 24,659 – 24,679 (Opening Support). Watch this level closely for intraday cues.
⚠️ Disclaimer: I am not a SEBI-registered analyst. This analysis is purely educational and should not be considered financial advice. Please consult your financial advisor before making any trading decisions.
BUY NIFTY 23450 PE 3rd April @ 100 - 105 | NIFTY SELL TRADENIFTY 23450 PE 3RD APR EXP
NIFTY OPTIONS BUYING TRADE
TIME FRAME RECOMMENDED TO TRACK TRADE: 5 MINS
Hi Traders,
The Nifty index opened with a gap down, and the 22,470 level is expected to serve as a key resistance zone, potentially creating a sell-on-rise opportunity. We recommend targeting the 23,450 Put Option (expiring on 3rd April within the price range of ₹100 - ₹105.
Target levels: ₹140 and ₹170.
Stop Loss (SL): ₹55
Regards,
OptionsDaddy Research Team

Nifty weekly analysis for 17/03/2025Nifty is trading between 100 EMA (weekly) and 20 EMA (daily). A good support from the weekly moving average is there and resistance on the daily charts.
A continuous support from 22300 level is there as the market has remained in a range whole week.
If the market tried to breach the support level, the support of weekly 100 EMA can be the other support around 22030 else it will take support around 21800.
In case the market starts to recover from the bottom and creates a higher high higher low formation it has to take out the resistance of 22650 and 22758.
Major levels are plotted in the charts. Just wait for the price action to confirm the entry into a trade else another sideways market can be seen.
Inside candle formation on the daily charts is also there and break out/down can be traded accordingly. Different trading approaches can help in capturing a good trade.
Wait for the price action near the levels before entering the market.

Nifty key levels for 28.01.2025Nifty key levels for 28.01.2025
If Nifty breaks the upper or lower range, we can expect momentum. The consolidation zone will be favorable for option sellers, while a breakout on either side will benefit option buyers.
Disclaimer:
I'm not a SEBI Registered financial advisor. These views are purely educational in nature. You are solely responsible for any decisions made based on this research.

Nifty outlook for the yearNifty chart analysis for coming few months :
1. Overall trend still remains bullish but deep pullback now similar to 2021 ( marked in circle ) .
2. Market might come down to next support 22,500 - 22,600 at breakout point of election result day .
3. Weekly chart shows market respecting swing lows since 2020 . Last swing low is 21,200 . As long as market doesn't break swing low , current trend is bullish .
4. Decent price for long term investment and SIPs
Cheers !
Follow for more market insights ! =)

Nifty key levels for 21.01.2025Nifty key levels for 21.01.2025
If Nifty breaks the upper or lower range, we can expect momentum. The consolidation zone will be favorable for option sellers, while a breakout on either side will benefit option buyers.
Disclaimer:
I'm not a SEBI Registered financial advisor. These views are purely educational in nature. You are solely responsible for any decisions made based on this research.

Nifty Intraday Trade Setup | 19th January 2025Nifty opened with a gap-down around 23285 but remained weak for the whole day and made low near 23100.
Tomorrow, Sell Nifty if sustains below 23160 for the targets of 23120 and below marked level. On the other side, buy Nifty if sustains above 23220 for the targets of 23260 and above marked level on the chart.
Expectations: Volatile Day
Intraday Levels:
Buy Above - 23220
Sell Below - 23160
To motivate us, Please like the idea If you agree with the analysis.
Happy Trading!
InvestPro India

Nifty key levels for 16.01.2025Nifty key levels for 16.01.2025
If Nifty breaks the upper or lower range, we can expect momentum. The consolidation zone will be favorable for option sellers, while a breakout on either side will benefit option buyers.
Disclaimer:
These views are purely educational in nature. You are solely responsible for any decisions made based on this research.

NIFTY ready for the Bullish moveLooking at the structure nifty is ready to move to upside if it breaks the 200 EMA to upside and have some consolidaion with that.
Important levels: 23364, 23507
Support levels: Resistance chanel, 200 EMA
Plan of action:
wait for market to break the 200 EMA and retrace to the channel.

Nifty analysis for 09/01/2025.Nifty is trading around the major support zone and today it has formed a hanging man candle near the support.
On the daily charts, there is a dual support i.e. 200 EMA and a support zone.
A Head and shoulder Pattern is also being formed in charts. If the pattern is confirmed a good bearish move can be seen in the Indian market.
Bullish trades can only be initiated only when there is a confirmation pattern near the support
Major support zone :- 23146-23500
Resistance levels :- 23675, 24000
Wait for the price action near the levels before entering the market.

Nifty Intraday Trade Setup | 7th January 2025Nifty opened with a minor gap-up, didn't sustain above our buy level 24055 and broke our sell level 23920 on the downside. Nifty made a low around 23550 and we saw good downside move today.
Tomorrow, Buy Nifty if sustains above 23660 for the targets of 23710 and above marked level. On the other side, Sell Nifty if sustains below 23550 for the targets of 23490 and below marked level on the chart.
Expectations: Volatile day
Intraday Levels:
Buy Above - 23660
Sell Below - 23550
To motivate us, Please like the idea If you agree with the analysis.
Happy Trading!
InvestPro India

NIFTY Intraday Trade Setup For 8 Jan 2025NIFTY Intraday Trade Setup For 8 Jan 2025
Bullish-Above 23800
Invalid-Below 23750
T- 24055
Bearish-Below 23550
Invalid-Above 23600
T- 23300
NIFTY has closed on a slight bullish note with 0.39% gain today, majorly contributed through gap up opening. It was just at 23700 zone. Tomorrow index may slide again below 23600 as index is in good bearish grip. However free fall scenario possible below 23550. In case 23800 is taken out in the higher side then it can test 24k once again.
Coming to Wednesday's trade setup, if index opens flat and a 15 Min candle closes above 23800 then we will long for the target of 24055.
For selling we need a 15 Min candle close below 23550. T- 23300
In case of a big gap up/down, wait till 10 o'clock and mark the high and low of the trading range (5MIN). Trade on this range breakout.
==========
I am Not SEBI Registered
This is my personal analysis for my personal trading. Kindly consult your financial advisor before taking any actions based on this.

NIFTY Automated Support Resistance Zone monthly/weekly/dailyHello Everyone,
Nifty Fall from 24200 resistance area,Supply zone,Liquidity area, reversals areas , finding this hidden levels with automated indicator created low of 23600 i.e 600 points fall in just 2 sessions
marking this areas are very important while we got this solutions.
Index key levels finding automatically hidden levels supportarea is at 23170 for monthly.

NIFTY analysis for tomorrow 03 JAN 24As we discussed, the NIFTY has been in sideways accumulation phase, it has broken to upside.
If we look at the chart now:
The market is trading at 50 EMA (1D-tf) and 200 EMA (4H-tf) resistance levels. Also, the market has given good bullish momentum today. Tomorrow might be a small side day. Also, the market is trading near the resistance level, which is going to provide good resistance. Important levels and trendlines have been marked on the chart.
Support levels: 200 EMA, 23950, 50 EMA (23800)
Resistance levels: 24167, Trendline (PINK), 24330
If we look at the OI data:
PCR = 1.2, which shows a good bullish structure in the market. The market has 24200 as max pain. As it is the very beginning of the weekly expiry, OI data is not going to play a very crucial role. Lower sides 24000, 23900, and 23800 have very good PE writing, so bulls are quite strong on lower levels. On higher levels, 24500 has good CE writing, which is going to provide good resistance.
I am expecting
The market is to be sideways unless it breaks the PINK trendline.
Reason:
RSI = 77 shows a bullish structure. (Bullish) -
Price > EMA(13, 50, 200), which indicates a good Bullish structure. (Bullish)
PCR = 1.2 indicates bullish direction in the market.
Price > VWAP shows a good bullish structure in the market.
Verdict: Sideways or Bullish
Plan of action:
Sell 24200 CE and Sell 24200. PE holds it in the range. Exit one leg if it breaks to one side.

NIFTY Today live analysis 26 Dec 24The market is in the sideways accumulation phase.
The market is making a symmetric triangle on either side. It breaks, and it is going to give a nice momentum.
All the important levels have been marked on the chart.
Make your positions accordingly.

#Nifty directions and levels for December 24th.Good morning, friends! 🌞
Here are the market directions and levels for December 24th.
Market Overview:
The global market is showing a moderately bearish sentiment (based on the Dow Jones). Our local market is also displaying a moderately bearish trend. Today, the market may open with a neutral to slightly gap-down start, as the Gift Nifty indicates a 15-point negative sentiment.
In the previous session, there was no directional movement, even though it opened with a long gap-up. Structurally, today might continue this sentiment as we are progressing into the 4th sub-wave. We already discussed this in the previous post, so more or less, it will move based on this. Let’s explain this in the charts.
Both Nifty and Bank Nifty are currently showing the same structural sentiment.
Current View:
The current view suggests that if the initial market takes a pullback after some decline or if it opens with a gap-up, then we can expect a continuation of the pullback. Structurally, the 38% retracement could be a major resistance in this variation. As per the wave structure, it is unlikely to go beyond this level. If you find any reversal confirmation, we can consider entering a short position. Conversely, if the pullback breaks the 38% level, it could extend to the next resistance level. This is the basic structure.
Alternate View:
The alternate view suggests that if the gap-down sustains, we can expect a correction to the previous bottom. Until the bottom is broken, the market sentiment could remain range-bound. If it breaks, we can consider that a 5th correctional wave.

NIFTY Analysis for tomorrow 24 Dec 24As we discussed, the NIFTY sideways structure market has been sideways the whole time today. Also, it opened at +160 and closed at the same point.
If we look at the chart now:
The market is in a consolidation phase. Big players are accumulating the market. I am expecting the market to be sideways in the upcoming 2-3 sessions.
Support levels: 23529, 23361
Resistance levels: 50 EMA, 23930, 200 EMA
If we look at the OI data:
PCR = 0.8, which has increased from 0.7, shows put addition at the lower level. 23500 has good support points for having good PE writing. On higher levels, 24000 is a nice resistance point, as it has a good resistance point. It also considers 50 EMA and 200 EMA.
I am expecting
The market is to be sideways in the range of 23539 - 23930
Reason:
RSI ~ 40 shows a weak bullish structure. (Sideways)
Price < EMA(13, 50, 200), which indicates a good bearish structure. (Bearish)
PCR = 0.8 indicates bullish bias in the market.
price < VWAP shows a good bullish structure in the market.
Verdict: Sideways
Plan of action:
Sell 23700 CE and Sell 23700 PE hold it in the range. Exit one leg if it breaks to one side.

NIFTY prediction for tomorrow 20 Dec 24As we discussed yesterday, the market opened at -250 points and spent the whole day sideways in a tight range.
If we look at the chart now:
The market is at a crucial point that can provide good support. Also, the price is very far from the EMAs, which might retrace to the EMAs. The market might reverse from this point. Right now, the market is neutral.
Support levels: 23772, 23488, 23363
Resistance levels: 24339, 200 EMA, 24682
If we look at the OI data:
PCR = 0.7, which has increased from 0.4, shows put addition at the lower level. 24000 has good support and resistance points. This is going to work as max pain. As it's the start of the week, OI won't play much of a role.
I am expecting
Case 1: Bullish if take support at 24950.
Case 2: Bearish if it breaks the level 24950 to the downside.
Reason:
RSI < 40 shows a good Bearish structure. (bearish)
Price < EMA(13, 50, 200), which indicates a good bearish structure. (Bearish)
PCR = 0.7 indicates a neutral market.
price < VWAP shows a good bullish structure in the market.
Verdict: Neutral
Plan of action:
Sell 23950 CE and 23950 PE and adjust your position as per the price action at 23950.

#Nifty directions and levels for December 19th.Good morning, friends! 🌞
Here are the market directions and levels for December 19th.
Market Overview:
After the Fed rate cut, the Dow Jones fell drastically and ended with a negative change of 2.5%. This also affected the Nifty. Therefore, today the market may open with a significant gap-down, indicating that the Nifty is expected to start 330 points lower.
The global sentiment suggests there is a bearish bias. If you look at the charts from a broader perspective, the Nifty is showing a negative trend, while the Bank Nifty appears to be range-bound. Thus, both indices are displaying slightly different biases. However, my expectation is that, even though the Bank Nifty has a range-bound structure, it could reach a minimum correction of 78% in the minor swing. More or less, the current trend indicates a negative outlook. If the gap-down sustains today, we can expect a continuation of the correction with some consolidation. A reversal could be considered if there is a breakout at the EMA 20 or the 38% Fibonacci level in the minor swing. Until these factors occur, the trend could remain bearish.
Additionally, I checked the volume profile and EMA 200 for long-term trend projections. Both the Nifty and Bank Nifty have yet to break the EMA 200, which means the higher degree trend is still bullish until it breaks that level. However, the volume profile is showing initial indications of a reversal in the Nifty, while the Bank Nifty has not yet shown this because the 51,500 level (in futures contracts) is providing good support based on the volume profile.
Conclusion: There is no clear direction yet from the combination of the Nifty and Bank Nifty charts. Therefore, we should approach this correction as a minor trend only.

NIFTY analysis for tomorrow 19 Dec 24As we discussed yesterday, the market was sideways and had huge volatility.
If we look at the chart now:
The market is looking bearish but also showing good bullish pull-ups. The market is near the support zone.
Support levels: 24127, 23970
Resistance levels: 24980, 24386, 24524, 24682
If we look at the OI data:
PCR = 0.4, which has decreased from 0.8, shows call addition at the higher level. The market has good PE writing at 24500 and 24400. Other levels, 24200, 24300, and 24300, will be showing good resistance at a higher level.
I am expecting
Case 1: Sideways in the range 24127 - 24350.
Case 2: Bearish if it breaks 24127 to the downside.
Reason:
RSI < 40 shows a good Bearish structure. (bearish)
Price < EMA(13, 50, 200), which indicates a good bearish structure. (Bearish)
PCR = 0.4 indicates a bearish market.
Price < VWAP shows a good bullish structure in the market.
Verdict: Bearish or Sideways
Plan of action:
In the range 24127 - 24350 Sideways. Go with an Iron condor.
Buy PUT if it breaks 24127 to the downside.
