NIFTY : Trading levels and plan for 29-Aug-2025📊 NIFTY TRADING PLAN – 29-Aug-2025
📌 Key Levels to Watch :
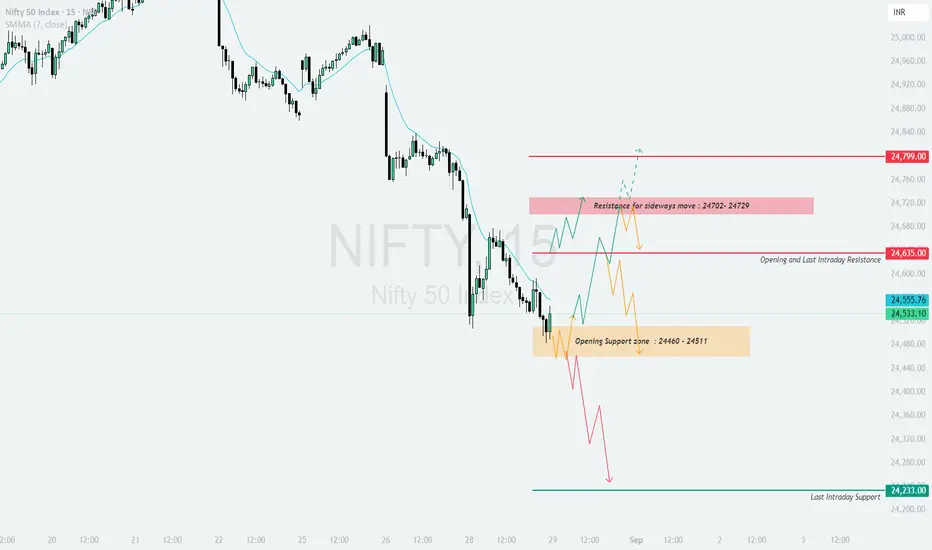
Opening & Last Intraday Resistance: 24,635
Resistance Zone for Sideways Move: 24,702 – 24,729
Major Resistance Above: 24,799
Opening Support Zone: 24,460 – 24,511
Last Intraday Support: 24,233
These levels highlight the battlefield where intraday buyers and sellers are likely to show their strength.
🔼 1. Gap-Up Opening (100+ points above 24,635)
If Nifty opens with a strong gap above 24,635, bullish momentum can extend.
📌 Plan of Action :
Sustaining above 24,702–24,729 (sideways resistance) can lift the index towards 24,799.
This zone is ideal for partial profit booking as supply pressure may emerge.
If the index fails to sustain above 24,702, expect sideways consolidation between 24,635–24,729 before any decisive move.
👉 Educational Note: On large gap-ups, avoid chasing momentum in the first 15 minutes. Wait for a pullback towards support for better risk-reward trades.
➖ 2. Flat Opening (Around 24,533 ± 50 points)
If Nifty opens flat near its current levels, the market will test supports and resistances for direction.
📌 Plan of Action :
Holding above 24,511 will keep momentum intact for a test of 24,635.
A breakout above 24,635 may lead to a rally towards 24,702–24,729.
On the other hand, slipping below 24,460 may invite selling pressure, opening the path to 24,233.
👉 Educational Note: Flat openings often lead to choppy sessions. Patience is crucial—wait for clear candle closes around levels before making a move.
🔽 3. Gap-Down Opening (100+ points below 24,460)
If Nifty opens sharply below 24,460, sellers will maintain an upper hand.
📌 Plan of Action :
Below 24,460, weakness can accelerate towards 24,233 (last intraday support).
Strong demand may emerge near 24,233; watch for long wicks or bullish reversal candles for intraday buying opportunities.
If 24,233 breaks decisively, the next phase of downside may trigger a deeper sell-off.
👉 Educational Note: Gap-downs often cause panic. Stick to your trading levels and avoid counter-trend entries unless there’s strong confirmation.
🛡️ Risk Management Tips for Options Traders
Limit risk to 1–2% of capital per trade .
Use hourly close stop-losses for confirmation.
Consider spreads (Bull Call / Bear Put) to reduce time decay impact.
Book profits in parts—don’t wait for exact top or bottom.
Track India VIX closely, as volatility affects option premiums.
📌 Summary & Conclusion
🟢 Above 24,635 → Rally towards 24,702–24,729 → 24,799 possible .
🟧 Flat near 24,533 → Watch 24,511 (support) and 24,635 (resistance) for breakout .
🔴 Below 24,460 → Weakness towards 24,233 (critical support zone) .
🎯 The tug-of-war lies between 24,460–24,635—whichever side breaks first will decide intraday trend.
⚠️ Disclaimer: I am not a SEBI-registered analyst. This trading plan is purely for educational purposes and should not be considered investment advice. Please do your own research or consult a financial advisor before trading.
Niftyintradaytradesetup
NIFTY : Trading levels and plan for 28-Aug-2025📊 NIFTY TRADING PLAN – 28-Aug-2025
📌 Key Levels to Watch :
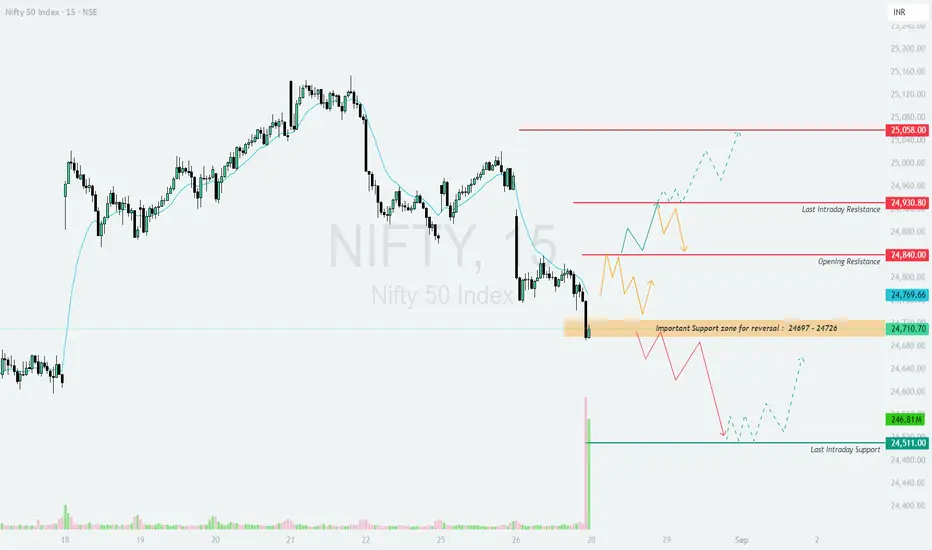
Opening Resistance: 24,840
Last Intraday Resistance: 24,930
Major Resistance Above: 25,058
Important Support Zone for Reversal: 24,697 – 24,726
Last Intraday Support: 24,511
These levels will guide our decision-making depending on the type of opening.
🔼 1. Gap-Up Opening (100+ points above 24,840)
If Nifty opens above 24,840, bullish momentum will be active.
📌 Plan of Action :
Sustaining above 24,930 will likely attract buyers towards 25,058, which is the major resistance zone.
If Nifty fails to hold above 24,930, profit booking may drag it back to 24,840 support zone.
A breakout above 25,058 can extend the rally further, but this should be traded cautiously, as upside may face profit booking.
👉 Educational Note: Gap-ups often trigger early volatility due to overnight positions. Avoid chasing at the open; wait for confirmation candles before entering.
➖ 2. Flat Opening (Around 24,710 – 24,769)
A flat start around the immediate support/resistance range will decide short-term direction.
📌 Plan of Action :
If Nifty sustains above 24,769, it may gradually climb towards 24,840 → 24,930.
If it breaks below 24,697–24,726 (Reversal Zone), weakness may drag it down towards 24,511 (Last Intraday Support).
In flat openings, allow the first 30 minutes to define direction before committing capital.
👉 Educational Note: Flat openings are best suited for range traders in the first half, later moving into breakout mode once levels are breached.
🔽 3. Gap-Down Opening (100+ points below 24,697)
If Nifty opens below 24,697, it will show clear bearish pressure.
📌 Plan of Action :
Below 24,697, the index can slip quickly towards 24,511 (Last Intraday Support).
Any bounce from this zone should be treated as an opportunity to re-test resistances, not fresh bullish entry, unless sustained.
If 24,511 is broken with volume, a deeper fall may continue with more downside levels opening up.
👉 Educational Note: On gap-down days, follow the trend instead of trying to catch falling knives. Look for retests of broken supports before initiating shorts.
🛡️ Risk Management Tips for Options Traders
Risk only 1–2% of capital per trade.
Use hourly closing basis stop-loss for directional trades.
On gap-up/gap-down days, avoid naked options; prefer spreads to manage risk.
Do not overtrade if levels remain choppy between 24,769 – 24,840 (no-trade zone).
Track India VIX ; high VIX = wider stop-loss needed, low VIX = tight stop-loss.
📌 Summary & Conclusion
🟢 Above 24,930 → Possible upside to 25,058 .
🟧 Flat near 24,769 → Wait for breakout/breakdown .
🔴 Below 24,697 → Downside towards 24,511 .
🎯 Key Zone: 24,697 – 24,726 (Reversal Zone) will act as a pivot for the day.
⚠️ Disclaimer: I am not a SEBI-registered analyst. This analysis is purely for educational purposes and should not be considered financial advice. Please consult your financial advisor before making trading/investment decisions.
NIFTY : Trading levels and Plan for 26-Aug-2025📊 NIFTY TRADING PLAN – 26-Aug-2025
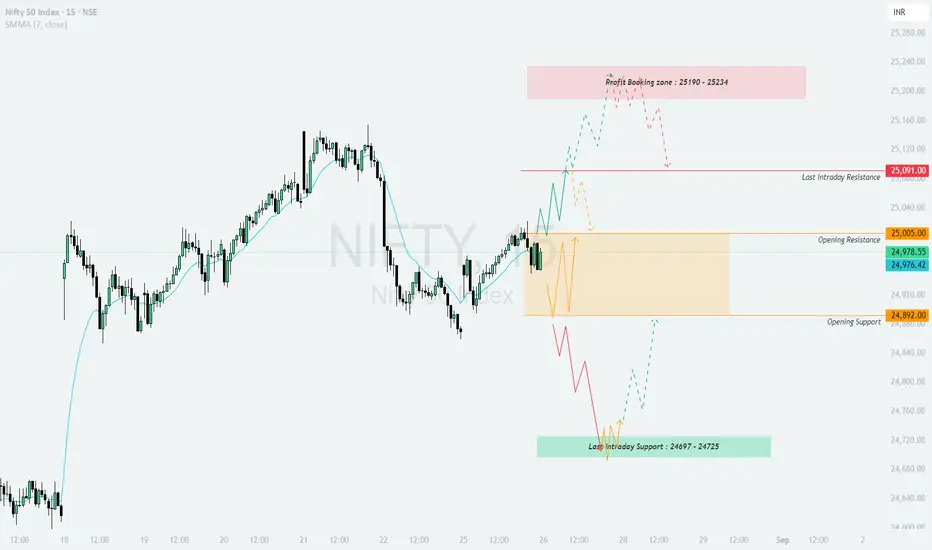
On 25-Aug-2025, Nifty closed at 24,978, positioned between critical levels. The key support and resistance zones for tomorrow are:
Opening Support: 24,892
Opening Resistance: 25,005
Last Intraday Resistance: 25,091
Profit Booking Zone: 25,190 – 25,234
Last Intraday Support: 24,697 – 24,725
Now let’s go through possible scenarios.
🔼 1. Gap-Up Opening (100+ points above 25,091)
If Nifty opens above 25,091, it directly enters the bullish zone.
📌 Plan of Action:
Watch for sustainability above 25,091 in the first 15–30 minutes. If sustained, the index can march towards the Profit Booking Zone 25,190 – 25,234.
In this zone, expect some consolidation or profit booking. Fresh long positions should be cautious here.
If 25,234 is taken out convincingly, it may lead to another strong rally, but chasing at higher levels 🚫 is risky.
Failure to sustain above 25,091 may result in a pullback toward the 25,005 – 24,892 zone.
👉 Tip: On gap-ups, avoid aggressive buying at open. Wait for retracements near support to enter for better risk–reward.
➖ 2. Flat Opening (Around 24,892 – 25,005)
A flat start around the opening support–resistance zone will be a deciding factor for intraday trend.
📌 Plan of Action:
If Nifty sustains above 25,005, it will likely attempt a breakout towards 25,091 → 25,190–25,234 zone.
Failure to hold 24,892 will open downside towards 24,725 – 24,697 (Last Intraday Support).
In flat openings, the first 30 minutes are crucial. Let the index pick direction before entering.
👉 Tip: For options traders, flat openings are best for straddle/strangle adjustments. Capture volatility once direction confirms.
🔽 3. Gap-Down Opening (100+ points below 24,892)
If Nifty opens below 24,892, it will show bearish pressure right from the start.
📌 Plan of Action:
Below 24,892, the index can test the Last Intraday Support Zone: 24,725 – 24,697.
Buyers may attempt to defend this support, so expect a bounce opportunity here (good for scalpers).
If 24,697 is broken with volume, further downside continuation may occur.
Avoid panic shorts at the open — wait for a retest of resistance before entering for safer trades.
👉 Tip: After a gap-down, use put spreads instead of naked puts to manage risk in case of sharp reversals.
🛡️ Risk Management Tips for Options Traders
Risk only 1–2% of your capital per trade.
Always trade with a defined stop-loss . Do not average losing positions.
Avoid over-leveraging, especially in weekly expiry sessions ⚡.
Prefer spreads (Bull Call, Bear Put, Iron Condors) to reduce premium decay impact.
Track India VIX 📉 before entering — high VIX means bigger moves, low VIX means range-bound.
📌 Summary & Conclusion
🟢 Above 25,091 → 25,190–25,234 (Profit Booking Zone) .
🟧 Flat around 24,892–25,005 = Wait for breakout/breakdown confirmation .
🔴 Below 24,892 → 24,725–24,697 (Buyer’s defense zone) .
Key Pivot: 24,892 – 25,005 zone for intraday trend.
⚠️ Disclaimer: I am not a SEBI-registered analyst. This analysis is purely for educational purposes and should not be considered financial advice. Please consult a financial advisor before making trading/investment decisions.
NIFTY : Trading level and plan for 25-Aug-2025Nifty Trading Plan for 25-Aug-2025
Key Levels from Chart:
Opening Resistance → 24,940
Opening Support → 24,809
Last Intraday Resistance → 25,021
Major Resistance Zone → 25,097
Last Intraday Support Zone → 24,703 – 24,729
Previous Close → 24,869.45
🚀 Scenario 1: Gap Up Opening (100+ points above previous close)
If Nifty opens above 24,970–25,000, bullish momentum may dominate the early session.
Immediate hurdle will be 25,021 (Last Intraday Resistance). If sustained, price can extend toward 25,097 zone where sellers are likely to emerge.
A rejection near 25,021–25,097 could bring the index back to retest 24,940 (Opening Resistance turned support).
Sustaining above 25,097 would be a strong bullish breakout, but the risk-reward for fresh longs reduces beyond this point.
💡 Plan of Action : Look for long entries above 25,021 with strict SL below 24,940. Target 25,097. If gap-up fails to hold and price slips below 24,940, consider cautious shorts for a move back to 24,809.
📊 Scenario 2: Flat Opening (within ±50–80 points of 24,870)
Flat openings often lead to consolidation before a breakout.
Price between 24,809 – 24,940 is a tight trading range, and whipsaws are common here.
Breakout above 24,940 can open upside toward 25,021 – 25,097.
Breakdown below 24,809 signals weakness, leading toward 24,729 zone (last intraday support).
💡 Plan of Action : Avoid aggressive trading inside 24,809–24,940. Take positions only after breakout above 24,940 (longs) or breakdown below 24,809 (shorts). Patience will protect you from false moves in a range.
⚠️ Scenario 3: Gap Down Opening (100+ points below previous close)
If Nifty opens near 24,750 or below, sellers will control the session.
First key level is 24,729–24,703 support zone. If held, expect a bounce toward 24,809–24,940 for intraday recovery.
If this support zone breaks decisively, downside opens further, and panic selling may take the index lower.
Failure to sustain below 24,703 can trap shorts, leading to sharp reversals upward.
💡 Plan of Action : Go short only if 24,703 breaks with strong volume, targeting lower levels. For scalpers, a bounce from 24,703–24,729 can be used for quick longs with a strict SL below 24,700.
📌 Risk Management Tips for Options Traders 💡
On gap openings, avoid chasing inflated premiums . Wait for price stabilization before entering.
Prefer spreads (bull call/bear put) over naked options to reduce theta decay risk.
Always set stop-loss on option positions — market can reverse quickly.
Keep intraday position sizing small (2–3% of capital per trade).
Use time-based exits (e.g., exit 30–45 mins before market close) if levels are not reached.
📝 Summary & Conclusion
Above 24,940, bullish bias can push Nifty toward 25,021 – 25,097 🚀.
Between 24,809 – 24,940, the market may consolidate ⚖️, avoid overtrading.
Below 24,809, weakness likely toward 24,703 – 24,729 ⚠️.
Below 24,703, strong downside risk opens.
👉 Key message: Stay disciplined, trade only on breakouts/breakdowns, and manage risk strictly.
⚠️ Disclaimer
I am not a SEBI registered analyst. This analysis is purely for educational purposes . Please consult your financial advisor before making any trading or investment decisions.

NIFTY : Trading levels and plan for 22_Aug-2025📌 Nifty Trading Plan for 22-Aug-2025
Key Levels from Chart:
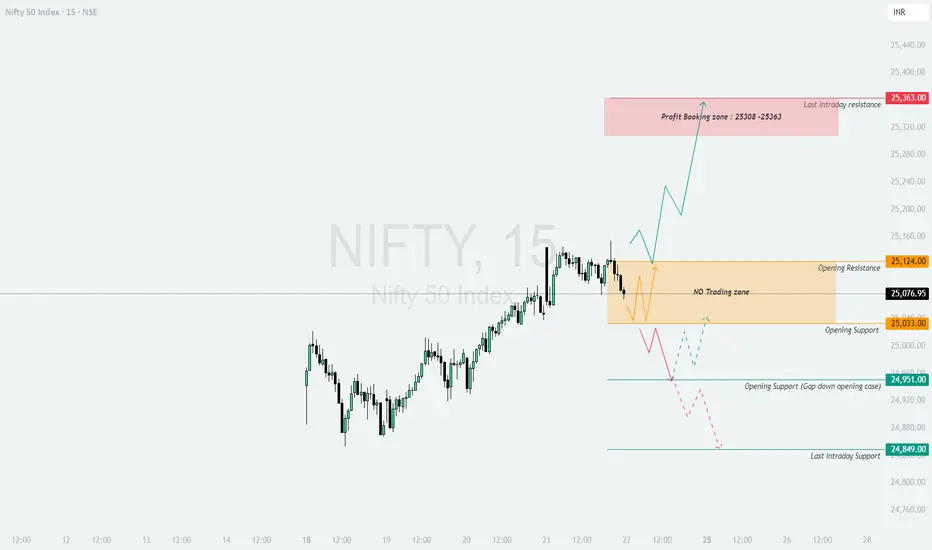
Opening Resistance → 25,124
Opening Support → 25,033
Profit Booking Zone (Last Intraday Resistance) → 25,308 – 25,363
Opening Support in Gap Down Case → 24,951
Last Intraday Support → 24,849
Previous Close → 25,076.95
🚀 Scenario 1: Gap Up Opening (100+ points above previous close)
If Nifty opens above 25,175+, bullish sentiment will dominate the early session.
Immediate hurdle is 25,308 – 25,363 (Profit Booking Zone). Traders should expect selling pressure here as short-term players may book gains.
Sustaining above 25,363 can extend momentum further, but risk-reward weakens for fresh longs.
If rejection happens from 25,308–25,363, index could retest 25,124 support.
💡 Plan of Action : Look for long trades above 25,124 with confirmation, targeting 25,308–25,363. Trail stop-loss below 25,033. Book partials at resistance and avoid fresh longs if market looks tired near highs.
📊 Scenario 2: Flat Opening (within ±50–80 points of 25,077)
Flat openings often cause range-bound moves until a breakout.
Price between 25,033 – 25,124 is a No Trading Zone . Avoid entering inside this range to prevent whipsaws.
Breakout above 25,124 can trigger a rally toward 25,308 – 25,363 zone.
Breakdown below 25,033 opens weakness toward 24,951.
💡 Plan of Action : Stay patient. Go long only above 25,124 or short below 25,033. Inside range, avoid overtrading and save capital for directional clarity.
⚠️ Scenario 3: Gap Down Opening (100+ points below previous close)
If Nifty opens near 24,950 or below, sellers will dominate.
Support at 24,951 may attract intraday buying or short-covering bounce toward 25,033.
If 24,951 breaks decisively, expect further downside toward 24,849 (Last Intraday Support).
Failure to sustain below 24,951 can trap shorts, leading to a recovery back to 25,124 resistance zone.
💡 Plan of Action : Go short only if 24,951 breaks with volume, keeping stop-loss above 25,033. For scalpers, a bounce from 24,951 can be used for quick longs with strict SL.
📌 Risk Management Tips for Options Traders 💡
Never chase option premiums after a big gap — premiums are inflated, wait for retracements.
Stick to defined-risk strategies (spreads, butterflies) instead of naked buying.
Always use stop-loss on options since time decay works against buyers.
Avoid over-leveraging — allocate not more than 2–3% capital per trade.
Book partial profits near key levels 🎯 and trail the rest.
📝 Summary & Conclusion
Above 25,124, momentum can extend toward 25,308 – 25,363, where profit booking is expected 🚀.
Between 25,033 – 25,124, market is in a No Trading Zone ⚖️. Avoid traps.
Below 25,033, weakness toward 24,951, and if broken → 24,849 ⚠️.
👉 The day will be highly level-driven, and patience is key. Trade only at breakouts/breakdowns for clear setups.
⚠️ Disclaimer
I am not a SEBI registered analyst. This analysis is purely for educational purposes . Please consult your financial advisor before making any trading or investment decision.
14 Aug 2025 - Change of stance on Nifty at 24500 levelsNifty Stance Bullish 🐂
Nifty changed its stance from bearish to bullish on 12th August, Tuesday. If you are following me on Trading view, you would have got the email once this EMA crossover happened. Interestingly, Nifty made this reversal after a decent trend of 473 points.
Even though the reversal came, Nifty is still unable to break out from the resistance level of 24620. We are still hovering around 40 points away from the last crossover signal at 24580.
US markets, which are hitting a new high every day, compare this to our markets, which are tired and lacking momentum. We might need fresh triggers to escape from these levels and the US-India trade deal could be a big reason.
A possible trigger could be either a monetary policy relaxation (reduction of repo rates) or a fiscal policy relaxation (decrease in taxes) to boost production/consumption. We cannot reduce our repo rates, as the current 5.5% rate is only 1% higher than the US Fed rate of 4.5%. If we reduce our repo further, our debt and money market will crash, which points us to the only option of a tax cut.

01 Aug 2025 - Nifty still riding on the short wave, down 490pts Nifty Stance Bearish 🐻
Our last signal crossover was on 24th July when we went short, see the red marker. From there, Nifty has fallen 1.96% ~ 490pts and it has been on a nice downward slope.
On 31st Jul, 14.03, we were almost ready for the bullish crossover, but the 14.19 candle saved us, which drove Nifty down 41pts. In fact, Nifty fell over 165pts after the 2pm hammer candle pattern. Even though a technical analyst could take credit for the nice price predictions, most of these moves are actually due to Trump's tariffs and the failed trade deals.
Trump accusing us of buying oil from Russia is actually a "bad actor", because it could pave the way to sanctions on Indian exporters and financial transactions. Basically, the US has ended up sanctioning every country dealing with its enemies.
I wrote a detailed article on this topic three days ago, just google for "US India Trade Tariff at 25% + Penalty. Time for us to step up" to read this article.
From here, if Nifty drops to 24250 levels in the current series, it would be the best-case scenario. The challenge for that would be the rumours and gossip on the trade deal could create huge short-covering and false signals. Hope the simple EMA crossover chart pattern holds its ground.

NIFTY Intraday Trade Setup For 30 Jul 2025NIFTY Intraday Trade Setup For 30 Jul 2025
Bullish-Above 24900
Invalid-Below 24850
T- 25100
Bearish-Below 24590
Invalid-Above 24640
T- 24290
NIFTY has closed on a positive note today. This does not mean that the short term trend has changed. Bullish sentiment confirmation will be when index closes above 50 EMA in daily TF and closes above PDH in daily TF. Tomorrow a bullish move can be expected above 24900 on a 15 Min candle close towards gap filling area. In case index closes below 24590 in 15 Min TF then index will head towards 24290.
In case of a big gap up/down, wait till 10 o'clock and mark the high and low of the trading range (5MIN). Trade on this range breakout.
==========
I am Not SEBI Registered
This is my personal analysis for my personal trading. Kindly consult your financial advisor before taking any actions based on this.

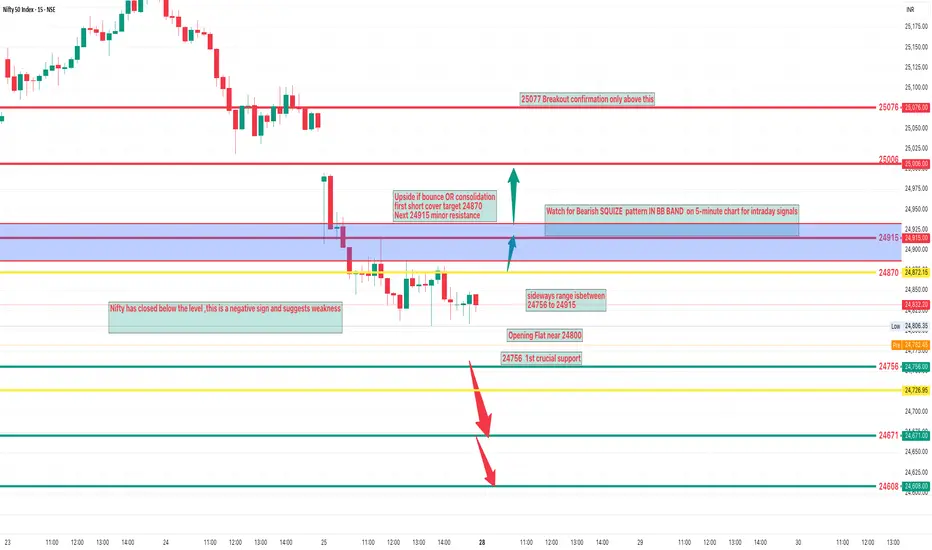
NIFTY Analysis – 28 july 2025 ,Morning update at 9 amExpected Opening & Movement Zones
Likely Opening Flat near 24800.
Immediate Downside Target (if weak)
First: 24756 important support.
Then: 246721– next support.
Upside if bounce or consolidation
First short-cover target: 24870.
Next: 24915 – minor resistance.
24756,Near today's flat open 1st crucial support
24671 If bottleneck confirmed –test this zone
24608 Extended weakness zone
Resistance Levels
24915 Short covering resistance
25,006 Important psychological and swing resistance
25076 Breakout confirmation only above this
the sideways range is likely between
24756 to 24915
Nifty may consolidate in this zone before giving any big move.
NIFTY Intraday Trade Setup For 21 Jul 2025NIFTY Intraday Trade Setup For 21 Jul 2025
Bullish-Above 25015
Invalid-Below 24965
T- 25150
Bearish-Below 24910
Invalid-Above 24960
T- 24640
NIFTY has closed on a slight bearish note with 0.72% cut last week. Index has reached 50 EMA in daily TF which is placed near 24900. A bounce from EMA can be expected. However below 24900 index may dive in the next week also. On a flat opening above 25015 a bullish move towards 25150 can be expected. Intraday resistance is placed at the 25150 as per half bat pattern. On a flat opening below 24910 index will test 24640. Plan trades on 15 Min candle close.
In case of a big gap up/down, wait till 10 o'clock and mark the high and low of the trading range (5MIN). Trade on this range breakout.
==========
I am Not SEBI Registered
This is my personal analysis for my personal trading. Kindly consult your financial advisor before taking any actions based on this.

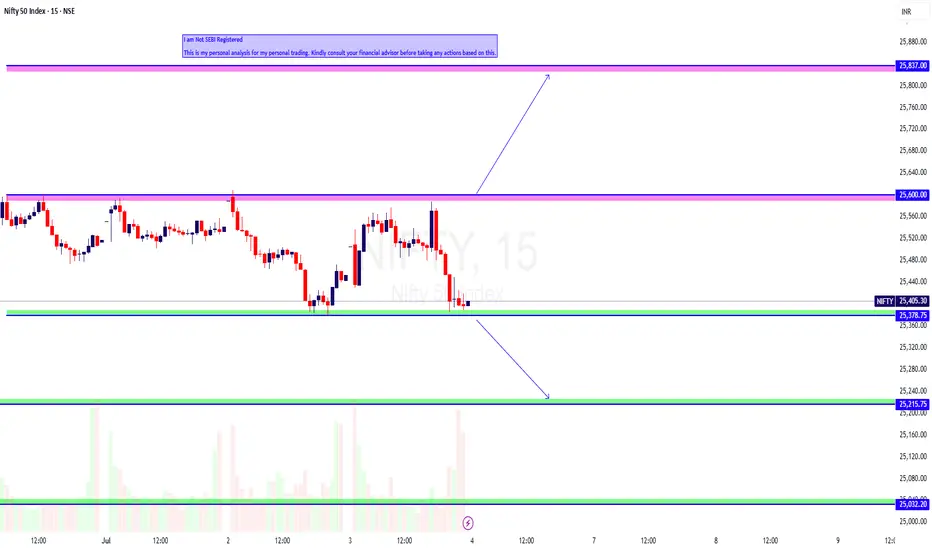
NIFTY Intraday Trade Setup For 4 Jul 2025NIFTY Intraday Trade Setup For 4 Jul 2025
Bullish-Above 25600
Invalid-Below 25550
T- 25837
Bearish-Below 25370
Invalid-Above 25420
T- 25215
NIFTY has closed on a slight bearish note with 0.19% cut today. Index has turned sell on rise since it has closed below PDL on 30 Jun. Buy on dip approach sentiment will be activated again if it closes above PDH in daily TF. Coming to Friday's trade setup, if index opens flat and a 15 Min candle closes above 25600 then will long , level has been tested multiple times in intraday. Short below 25370. A good flow below the same can be expected on flat opening.
In case of a big gap up/down, wait till 10 o'clock and mark the high and low of the trading range (5MIN). Trade on this range breakout.
==========
I am Not SEBI Registered
This is my personal analysis for my personal trading. Kindly consult your financial advisor before taking any actions based on this.
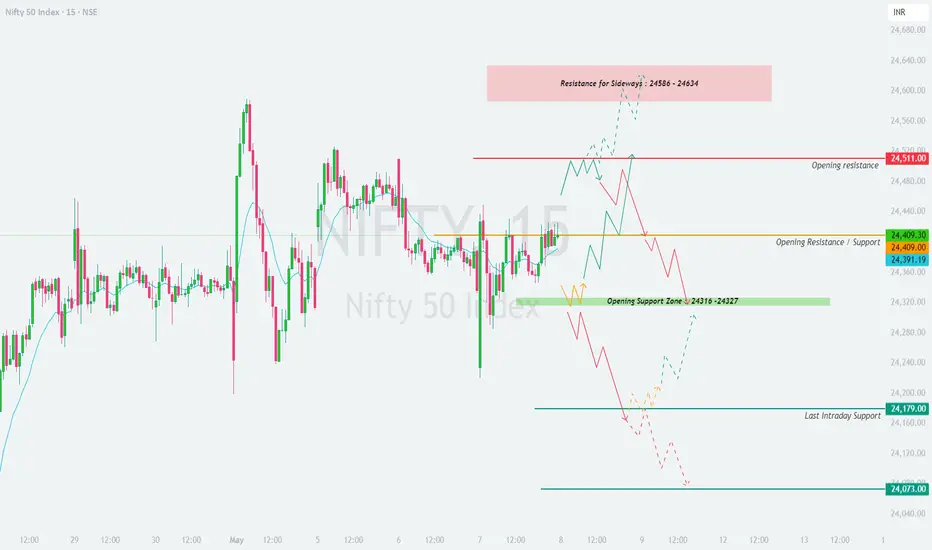
NIFTY : Trading Levels and Plan for 08-May-2025📊 Nifty 50 Trading Plan for 8-May-2025
Timeframe: 15-Min | Previous Close: 24,409.30
🔎 Key Technical Levels to Watch:
🔴 Opening Resistance: 24,511
🟧 Opening Resistance / Support: 24,409
🟩 Support Zone: 24,320 – 24,280
🟦 Last Intraday Support: 24,179
🟢 Major Support Level: 24,073
📌 Sideways Resistance Zone: 24,586 – 24,634
🟢 1. Gap-Up Opening (📈 Opening above 24,509 — Gap of 100+ Points)
If Nifty opens above 24,509, it is entering the Opening Resistance Zone . A strong open near or within 24,586 – 24,634 (marked as Sideways Resistance) needs cautious handling.
✅ Plan of Action:
- Avoid chasing longs immediately into this resistance zone.
- Wait for the first 15–30 minutes to observe whether buyers sustain above 24,586.
- If price consolidates above 24,586 and gives a breakout with volume, it may test higher levels intraday.
- However, if price faces rejection (like long upper wicks or bearish engulfing candles), initiate shorts below 24,511 for targets of 24,409 and possibly 24,320 – 24,280.
📝 Educational Insight: Gap-up openings into resistance zones often trap late buyers. Wait for confirmation in the form of retests or strong follow-through candles before taking trades.
🟡 2. Flat Opening (🔄 Between 24,309 – 24,509)
If Nifty opens flat near 24,409 (previous close), the market will likely consolidate in the initial minutes.
✅ Plan of Action:
- Observe the price action within the first 15-minute candle.
- If price sustains above 24,409, look for a move toward 24,511. A breakout above that may attempt to test the 24,586 – 24,634 resistance zone.
- On the downside, if price breaks and sustains below 24,320, expect selling pressure towards 24,179.
- Be flexible and neutral at open. Let the initial 30-minute range define the trend.
📝 Educational Insight: Flat opens offer great opportunity to play breakout/breakdown setups. Wait for a strong directional move from the initial balance zone before entering trades.
🔴 3. Gap-Down Opening (📉 Opening below 24,309 — Gap of 100+ Points)
A gap-down open below 24,309, especially near or under the support zone of 24,320 – 24,280, demands caution and strategic planning.
✅ Plan of Action:
- If the price opens around 24,280 – 24,179 zone, check for immediate bounce or sideways consolidation.
- A bullish reversal candle (hammer, bullish engulfing) around this zone can lead to a bounce back towards 24,409.
- However, if price breaks 24,179 decisively, and a 15-min candle closes below it, a quick slide towards 24,073 is likely.
- Do not catch falling knives—wait for a retest or formation of a base.
📝 Educational Insight: Gap-downs often create panic, but they also offer the best risk-reward trades if reversal patterns form near strong support zones. Let the market show you the strength.
💡 Risk Management Tips for Options Trading:
📏 Size your positions properly: Never risk more than 1–2% of your capital in one trade.
🕒 Time your trades: Avoid aggressive buying post 11:30 AM unless clear direction emerges.
📉 Avoid averaging losing positions in options; take the SL and re-enter with structure confirmation.
🛠️ Prefer hedged strategies like spreads or iron condors if volatility is high.
🔁 Use time-based exits (e.g., square off by 3:00 PM if momentum stalls).
📌 Summary & Conclusion:
Nifty is at a critical juncture with clear supply at 24,511 – 24,634 and support at 24,320 – 24,073.
For Gap-Up openings , caution near resistance is key—wait for breakout confirmation.
For Flat opens , let the range develop before breakout trades.
For Gap-Downs , avoid emotional trades—wait for proper reversal signals near 24,179 or 24,073.
Focus on quality setups, defined risk, and disciplined exits.
📢 Disclaimer:
I am not a SEBI-registered analyst. The above trading plan is intended purely for educational purposes. Please consult with your financial advisor before taking any trading or investment decisions.
BUY NIFTY 23450 PE 3rd April @ 100 - 105 | NIFTY SELL TRADENIFTY 23450 PE 3RD APR EXP
NIFTY OPTIONS BUYING TRADE
TIME FRAME RECOMMENDED TO TRACK TRADE: 5 MINS
Hi Traders,
The Nifty index opened with a gap down, and the 22,470 level is expected to serve as a key resistance zone, potentially creating a sell-on-rise opportunity. We recommend targeting the 23,450 Put Option (expiring on 3rd April within the price range of ₹100 - ₹105.
Target levels: ₹140 and ₹170.
Stop Loss (SL): ₹55
Regards,
OptionsDaddy Research Team

Nifty weekly analysis for 17/03/2025Nifty is trading between 100 EMA (weekly) and 20 EMA (daily). A good support from the weekly moving average is there and resistance on the daily charts.
A continuous support from 22300 level is there as the market has remained in a range whole week.
If the market tried to breach the support level, the support of weekly 100 EMA can be the other support around 22030 else it will take support around 21800.
In case the market starts to recover from the bottom and creates a higher high higher low formation it has to take out the resistance of 22650 and 22758.
Major levels are plotted in the charts. Just wait for the price action to confirm the entry into a trade else another sideways market can be seen.
Inside candle formation on the daily charts is also there and break out/down can be traded accordingly. Different trading approaches can help in capturing a good trade.
Wait for the price action near the levels before entering the market.

NIfty may slip 5% moreBased on previous slip of nifty, the maximum slip was 18%, now the current slip from high is 13% and at 18% has got high support based on previous support.

Nifty 1D Bear Market Technical Analysis (Distribution Phase)- Nifty is currently trading at 22,829.
- Nifty has erased 13.11% from its all-time high of 26,274.
- Ninety percent of social media outlets and broadcasters have stopped their perpetual bullish commentary on Nifty, which they claimed would never stop. The next ten years for India are expected to be very bullish, and Nifty could soon head towards 30,000 following this drop.
- Now, let's focus on understanding what we can expect from this drop and where prices may head in the upcoming days.
- Nifty is about to test the largest liquidity grab it made around 21,285. After that, we may quickly see Nifty rebalance the inefficiencies it creates during this impulsive downward move.
- The level I will be considering for my personal investment is between 18,832 and 19,000.
- The range of 18,000 to 20,000 is likely to be a very strong zone for long-term investments rather than short-term swings, as markets typically move in cycles of accumulation, manipulation, and distribution.
- To fill the gaps, the market rebalances every imbalance, taking out liquidity between candles and heading toward new lows or highs. The market seeks liquidity from Fair Value Gaps; that's how it usually moves.
- We have witnessed a bull market for 2 years now. In my opinion, we are soon going to experience a Distribution phase of 2 years filled with many manipulations and dead cat bounces. Stay cautious and don't miss discounted levels; an index correcting 30% is significant.

Nifty Intraday Support & Resistance Levels for 27.01.2025On Friday, Nifty opened on a positive note but witnessed significant volatility. It initially dipped to a low of 23,102.90, finding support at the 5m Demand Zone highlighted in the previous analysis. It then rallied to a day high of 23,347.30, nearing the 5m Supply Zone, before retreating sharply to a new day low of 23,050. The index closed at 23,092.20, losing 113 points from the previous close. The Weekly Trend (50 SMA) remains sideways, while the Daily Trend (50 SMA) stays negative.
Demand/Support Zones
Near Minor Demand/Support Zone (15m): 22,986 - 23,029.55
Far Demand/Support Zone (Daily): 21,791.95 - 22,910.15
Supply/Resistance Zones
Near Supply/Resistance Zone (15m): 23,288.75 - 23,331.30
Near Supply/Resistance Zone (5m): 23,349.20 - 23,421.25
Near Supply/Resistance Zone (Daily): 23,496.15 - 23,795.20
Far Supply/Resistance Zone (75m): 23,645.05 - 23,726.85
Far Supply/Resistance Zone (Daily): 23,976 - 24,196.45
Outlook
This marks the second consecutive week where Nifty closed below the critical June 2024 election week levels, signaling sustained selling pressure. Unless Nifty finds strong support in the 22,800–23,000 zone, further downside could be expected in the coming weeks.
On the upside, major resistance lies at 23,400–23,800. A breakout above this range might indicate the start of a bullish trend. However, with the Union Budget 2025 on the horizon, caution is advised, as market volatility could spike.

Nifty Intraday Support & Resistance Levels for 24.01.2025On Thursday, Nifty witnessed a steady session, opening flat to negative but finding support at 23,090.65 during the first 15 minutes. From there, it rallied to a day high of 23,270.80 before closing at 23,215.20, gaining 50 points over the previous close. The Weekly Trend (50 SMA) remains sideways, while the Daily Trend (50 SMA) is still negative.
Demand/Support Zones
Near Demand/Support Zone (5m): 23,100.20 - 23,127.45
Near Demand/Support Zone (15m): 22,986 - 23,029.55
Far Demand/Support Zone (Daily): 21,791.95 - 22,910.15
Supply/Resistance Zones
Near Supply/Resistance Zone (5m): 23,349.20 - 23,421.25
Near Supply/Resistance Zone (Daily): 23,496.15 - 23,795.20
Far Supply/Resistance Zone (75m): 23,645.05 - 23,726.85 (inside the Daily Supply Zone)
Far Supply/Resistance Zone (Daily): 23,976 - 24,196.45
Outlook
Nifty’s ability to hold the 23,100 support zone indicates resilience, while on upper side, resistance around 23,350 - 23,400 could pose a challenge for further upside. A breakout above 23,500 may signal a move toward higher resistance levels near 23,650 - 23,800.

Nifty Intraday Support & Resistance Levels for 23.01.2025On Wednesday, Nifty delivered a positive performance, opening strong and dipping to a low of 22,981.30. In the final trading hour, it rallied to a high of 23,169.55 and closed at 23,155.35, gaining 130 points over the previous close. The Weekly Trend (50 SMA) remains sideways, while the Daily Trend (50 SMA) is still negative.
Demand/Support Zones
Near Demand/Support Zone (15m): 22,986 - 23,029.55
Near Demand/Support Zone (Daily): 21,791.95 - 22,910.15
Supply/Resistance Zones
Near Supply/Resistance Zone (5m): 23,349.20 - 23,421.25
Near Supply/Resistance Zone (Daily): 23,496.15 - 23,795.20
Far Supply/Resistance Zone (75m): 23,645.05 - 23,726.85
Far Supply/Resistance Zone (Daily): 23,976 - 24,196.45
Far Supply/Resistance Zone (Daily): 24,601.75 - 24,782.15
Far Supply/Resistance Zone (Weekly): 24,180.80 - 24,792.30
Outlook
Nifty's rally in the final hour shows strength, but resistance looms near 23,350 - 23,420. A breakout above this level could open doors to 23,500+, testing the Daily Supply Zone. On the downside, the 15m Demand Zone (22,986 - 23,029.55) may act as a strong support. Watch these levels closely for the next move!

Nifty outlook for the yearNifty chart analysis for coming few months :
1. Overall trend still remains bullish but deep pullback now similar to 2021 ( marked in circle ) .
2. Market might come down to next support 22,500 - 22,600 at breakout point of election result day .
3. Weekly chart shows market respecting swing lows since 2020 . Last swing low is 21,200 . As long as market doesn't break swing low , current trend is bullish .
4. Decent price for long term investment and SIPs
Cheers !
Follow for more market insights ! =)

#Nifty directions and levels for January 22nd, WednesdayGood Morning, friends! 🌞
Here are the market directions and levels for January 22nd, Wednesday
Market Overview:
The global market is maintaining a bullish sentiment (based on the Dow Jones), while our local market shows a bearish sentiment. Today, the market is likely to open neutral to slightly gap-up, as the Gift Nifty indicates a +50-point positive opening.
In the previous session, both Nifty and Bank Nifty experienced high volatility. Based on the structure, the market is expected to remain range-bound, even if it breaks the previous bottom, especially in Nifty.
> So, if the market sustains the gap-up, we can approach it with a range-bound sentiment with a bearish bias. However, if the market begins a correction, the current correction trend is likely to continue.
Let’s look at the charts for more details.
Nifty Current View:
The current structure suggests that if the gap-up doesn't sustain or if the market breaks the previous low after some consolidation, we can expect the correction to continue toward the levels of 22898 to 22829.
Alternate View:
If the gap-up sustains, we should approach it as a range-bound market. However, avoid taking long positions without confirmation. For a long position, wait for a breakout at specific levels. For example, if the market breaks the 50% level, targets could be set at 61% and 78%.

Nifty Intraday Support & Resistance Levels for 22.01.2025Tuesday's session was marked by high volatility, with Nifty opening positive and made high of 23,426.30, entering the 30m Supply Zone. However, intense selling pressure pushed it down to 23,127.70, followed by another bounce to 23,421.25, before dropping to a day low of 22,976.85. It closed at 23,024.65, losing 320 points over the previous close. The Weekly Trend (50 SMA) remains sideways, while the Daily Trend (50 SMA) is still negative.
Demand/Support Zones
Near Demand/Support Zone (Daily): 21,791.95 - 22,910.15
Supply/Resistance Zones
Near Supply/Resistance Zone (30m): 23,396.85 - 23,454.65 (tested)
Near Supply/Resistance Zone (Daily): 23,496.15 - 23,795.20
Far Supply/Resistance Zone (75m): 23,645.05 - 23,726.85
Far Supply/Resistance Zone (Daily): 23,976 - 24,196.45
Outlook
Tuesday's zigzag movement of over 1,700+ points underscores the volatility in the market. Nifty is facing strong resistance near 23,400, and above that lies a Daily Supply Zone extending up to 23,800. If selling pressure persists, watch for support at the Daily Demand Zone (21,791.95 - 22,910.15).

Bearish Flag Pattern Breakdown in NiftyA Bearish Flag Pattern has been observed in NSE:NIFTY , signalling a potential downward movement. If this breakdown is successful, the following targets can be expected:
First Target: 22,550
Second Target: 22,000
Disclaimer:
This analysis is for educational and informational purposes only. It does not constitute financial advice. Market movements are subject to various factors, and trading involves significant risk. Always conduct your own research or consult with a professional financial advisor before making any investment decisions. NSE:NIFTY
