When Broader Market Held the Gap… Why Is NiftyIT the Outlier?When Broader Market Held the Gap… Why Is NiftyIT the Outlier?
Headlines point to explanations like AI bubble fears, US tech weakness, or currency moves.
But are these the real drivers — or just narratives assigned after the move ?
Price leads. News follows.
The weekly price structure appears to have been signaling this divergence well in advance, as price continued to respect higher-timeframe supply while the broader market held firm.
At the same time, the daily Ichimoku structure reflects this conflict . It repeatedly toggled between kumo breakout and kumo breakdown highlighting unresolved higher-timeframe pressure
Niftyit

Nifty IT down by 6%A company called Anthropic released a new set of AI tools that surprised global markets.
One of these tools helps with work like reading documents and automating routine office tasks.
Investors worried that this AI could replace old software and services many companies sell.
Because of this fear, people started selling shares in big software companies.
Big Indian IT companies like Infosys, TCS and Wipro were affected.
The market reaction showed that investors fear AI might cut into profits of traditional tech businesses.
Anthropic’s new tools are meant to save time, but for stock markets it sparked uncertainty.
This event highlighted how powerful and fast AI changes are happening in technology today.


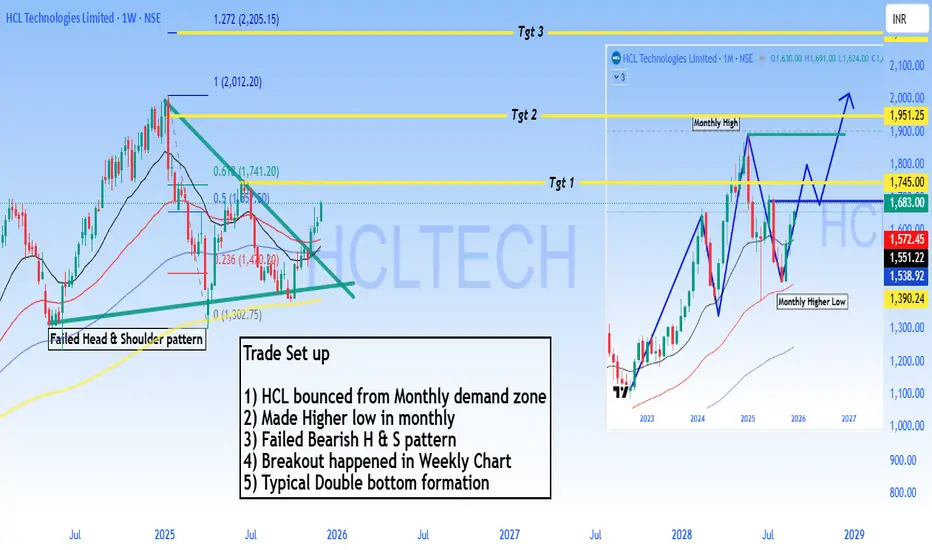
HCLT - Buy - Technical Analysis#HCL Technologies Limited - Technical Analysis
Price: 1,683.00 |
#Trade Setup - Bullish Reversal
#Outlook
Strong bullish setup with 4-35% upside potential. The failed bearish head & shoulder pattern combined with monthly demand zone bounce suggests institutional accumulation. Breakout above 1,745 opens path to 1,951 and beyond.
Pattern Analysis:
1. Bounced from monthly demand zone - Strong support established
2. Made higher low in monthly chart - Trend reversal signal
3. Failed Bearish Head & Shoulders pattern - Bears trapped, bullish continuation
4. Breakout confirmed on weekly chart - Momentum shift
5. Typical double bottom formation - Classic reversal pattern
Technical Structure:
- Monthly higher low at 1,390 confirms bullish structure
- Failed H&S pattern invalidation is highly bullish
- Price now targeting previous resistance zones
Target Levels:
- Target 1: 1,745.00
- Target 2: 1,951.25
- Target 3: 2,272.70
Support: 1,572 - 1,551 (critical zone)
⚠️ DISCLAIMER
**NOT investment advice.** Educational analysis only. Trading involves substantial risk of loss. Past patterns don't guarantee future results. Always do your own research and consult a SEBI-registered financial advisor. Author assumes no responsibility for losses.
#HCLTech #StockMarket #NSE #TechnicalAnalysis #ITStocks #IndianStockMarket #SwingTrading #Trading #FinTwit #TradingView #ChartAnalysis #StocksToWatch #Nifty50 #TechStocks
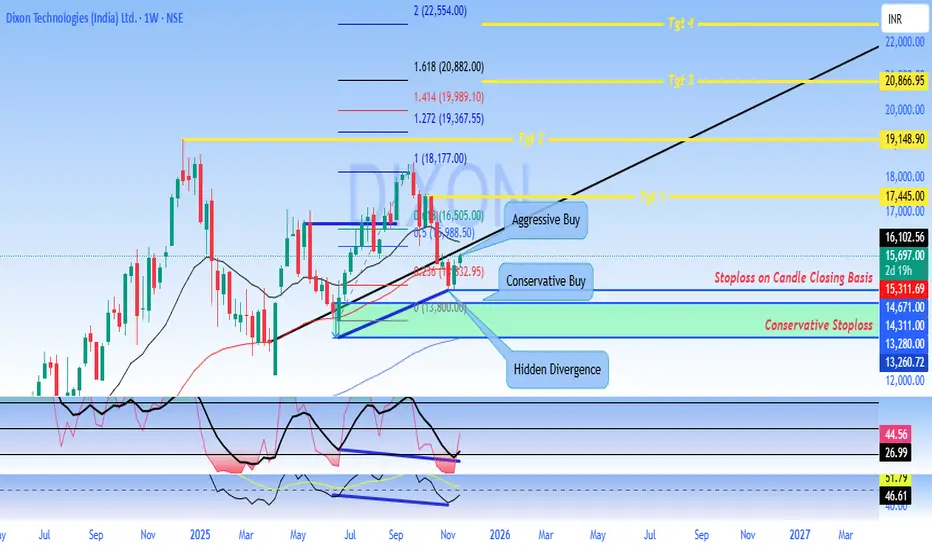
DIXON Technologies - Swing Trade Analysis
#Dixon Technologies (India) Ltd. - Technical Analysis Report
Current Price:15,697.00
Timeframe: Weekly Chart Analysis
Market Structure Overview
Dixon Technologies is currently trading at 15,697, showing signs of potential #bullish #momentum after a period of #consolidation. The #stock has been forming a significant base pattern following its decline from #all-time highs near 18,177.
#Key Technical Levels
#Support Zones
- Primary Support: 13,800 - 14,311 (Conservative Stoploss zone)
- Secondary Support: 13,260 - 13,280
- Critical Support: 12,000 (major psychological level)
#Resistance Zones
- Immediate Resistance: 16,102 - 16,505
- Key Resistance 1: 17,445 (Target 1)
- Key Resistance 2: 19,148 (Target 2)
- Major Resistance: 20,866 - 22,000 (Target 3 & 4 zone)
#Chart Pattern Analysis
The weekly chart reveals a **potential bullish reversal pattern** with the following characteristics:
1. Hidden Divergence: The chart shows hidden bullish divergence on momentum indicators, suggesting underlying strength despite recent price consolidation
2. Consolidation Box: A clear accumulation zone has formed between 13,800 and 16,500
3. Trend Channel: A rising trend channel indicates the potential for continued upward movement toward the 20,000+ zone
#Trading Strategies
#Aggressive Buy Setup
- Entry Zone: 16,505 - 16,102 (on breakout confirmation)
- Target Sequence: 17,445 → 19,148 → 20,866
- Stop Loss: Below 15,311 on candle closing basis
- Risk-Reward: Favorable 1:3+ ratio
#Conservative Buy Setup
- Entry Zone: 15,697 - 15,311 (current levels)
- Target Sequence: 17,445 → 19,148
- Stop Loss: Below 14,311 on candle closing basis (Conservative Stoploss)
- Risk-Reward: Approximately 1:2.5 ratio
#Momentum Indicators
The lower panel indicators suggest:
- Recovery from oversold conditions
- Building positive momentum
- Potential for sustained upward movement if key resistance levels are breached
#Fibonacci Levels
Key Fibonacci retracement/extension levels marked on the chart:
- 1.618 Extension: 20,882
- 1.414 Extension: 19,989
- 1.272 Extension: 19,367
- 1.000 Level: 18,177
#Outlook
Bullish Scenario: A sustained move above 16,505 with strong volume could trigger momentum toward 17,445 initially, with extended targets at 19,148 and potentially 20,866+. The stock appears to be in an accumulation phase with potential for a significant upside breakout.
Bearish Scenario: Failure to hold above 14,311 on a closing basis would invalidate the bullish setup and could lead to a retest of 13,260-13,280 support zone.
#Risk Management.
- Always use stop-loss orders on a candle closing basis - Position sizing should not exceed 2-3% of total portfolio value - Avoid overleveraging in options or futures - Monitor volume confirmation on breakout levels
DISCLAIMER
This analysis is for educational and informational purposes only and should NOT be considered as financial advice or a recommendation to buy or sell securities.
- Past performance is not indicative of future results - Trading and investing in stocks involves substantial risk of loss - All investment decisions should be made based on your own research, risk tolerance, and financial situation - Please consult with a SEBI-registered financial advisor before making any investment decisions - The author/analyst is not responsible for any profits or losses incurred based on this analysis - Technical analysis has limitations and should be combined with fundamental analysis - Market conditions can change rapidly, and all levels mentioned are subject to change
**Trade at your own risk. Always do your own due diligence.**
*Analysis created using TradingView charts | Not SEBI Registered Investment Advice*
NiftyITNifty IT | CMP: 33,702
The index made its all-time high (ATH) in December 2024 and has since been in a structural decline. After hitting a low in April 2025, it has been moving within a parallel channel, testing the upper boundary in June 2025.
Support Zone 1 (31,230–30,575):
This level has repeatedly acted as both supply and demand. It provided resistance in Nov 2022 and Feb 2023, later turning into strong support in Oct 2023, June 2024, and Apr 2025 . A retest of this zone cannot be ruled out, but if it fails to hold, the price may drift lower towards the next critical zone.
Support Zone 2 (26,399–25,499):
This is the most significant demand area, created largely during the consolidation phase between Jan–May 2021, and reinforced in Jun/Jul 2022, Sept 2022, and Apr 2023 . Post this accumulation, the index witnessed a sharp rally to its last ATH.
These two zones together formed a broad rectangular base between Jun 2021 – Aug 2023 , which provided strong momentum to the bulls.
The period from Mar 2020 – Jan 2022 was exceptional for the bulls, driving prices far ahead of valuations. While this resulted in the ATH, the subsequent correction was inevitable as disparity levels stretched excessively. The ongoing correction is essentially a healthy cooling-off phase before the next sustainable move.
That said, this entire consolidation and corrective cycle may still take another 1–2 years to fully play out.

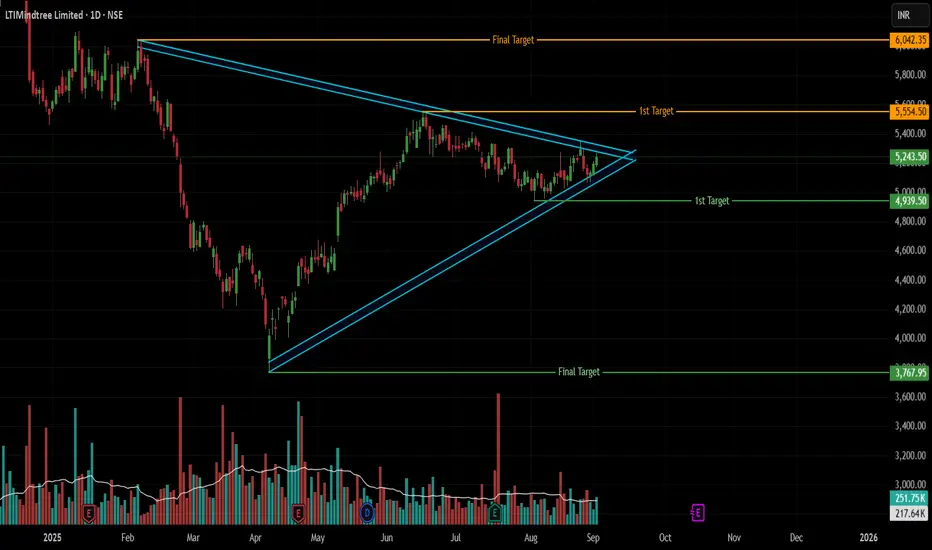
LTIM: The Final Squeeze – Breakout or Breakdown?LTIMINDTREE: The Big Squeeze! ⚡ Which Way? 🐂🐻
Timeframe: Daily
Trade Type: Swing/Positional
Pure Price Action Setup: LTIMINDTREE is compressing into a textbook Symmetrical Triangle on the daily chart. This is a classic consolidation pattern where the market is building energy for a significant breakout. Volatility is collapsing into a tight apex!
Key Decision Levels:
Bullish Trigger: A decisive daily close above 5350 (the recent upper trendline resistance).
Bearish Trigger: A decisive daily close below 5067 (the rising lower trendline support).
The Trade Plan:
👉 BULLISH BREAKOUT Scenario 🐂
Entry: On a close above 5350.
Confirmation: A significant increase in volume on the breakout candle should confirm buyer commitment.
Target 1: 5554 (Previous major high)
Final Target: 6042 (All-Time High & Pattern Confluence)
SL: Below the breakout candle or the lower trendline.
👉 BEARISH BREAKDOWN Scenario 🐻
Entry: On a close below 5067.
Confirmation: A noticeable spike in volume on the breakdown would validate seller dominance.
Target 1: 4939 (Initial support zone)
Final Target: 3767 (Major Swing Low & Pattern Confluence)
SL: Above the breakdown candle or the upper trendline.
Pattern Depth & Significance:
The triangle's maximum depth is measured from its origin: the high of 6042 (Feb 5) to the low of 3767 (Apr 7).
This is a 2,275-point range.
In percentage terms, that's a ~60.3% move from high to low.
Why this matters: The energy stored in a pattern of this scale suggests the resulting breakout could be powerful and sustained. Always trail your stop loss after Target 1 is hit! 🔒
Risk Management is NON-NEGOTIABLE!
This is a high-risk, high-reward setup. Your stop loss is your best friend.
📜 Disclaimer: This is an educational example of technical analysis and NOT financial advice. Trading carries a high level of risk. You should consider whether you can afford to take the risk of loss. Perform your own research before making any trade decisions.
Like & Boost if this clear analysis helps you! ✅
Follow for more pure price action trade ideas! 😊
TCS may drip down in the coming week?In the current chart pattern, TCS seems to be on the border of completing its minute wave 4 and may see a fall in the coming days to complete its wave 5.

We may see Sell on Rise in Nifty as Momentum fades downSo now 25420 Support has been breached in NSE:NIFTY . Next would be 25222 as we analysed on weekly Nifty commentary.
Today's candle in #NIfty is a Squat Candle which forms when traders book profit on rise. However, Buyers were still stronger than Sellers by 6 million volume.
Seems like a Short Build up pattern.
Volume rising + Momentum is falling = we will short on a bounce. Option traders must note this.
After 25222, 25050 could be the next important support.
Resistance for Nifty would be at 25600.
We can see a decent short covering if we close above this.
NSE:BANKNIFTY looks weaker. NSE:CNXPSUBANK couldn't push it as expected.
Support to open new short term position is now marked at 56111.
Talking about the Sector specific trades, NSE:CNXPHARMA , #AUTOCOMPONENTS AND NSE:CNXIT tops the list.
Remember, this is no time to open Short term positions. We will soon get that good opportunity. So keep some cash handy so that you can the chance when there is opportunity is visible.
Currently is the time to do just Intraday and Swing trading.
That will be all for the day. Don't forget to use strict SL in this market. Do not use MTF trading.
Take care. Have a profitable tomorrow.

Lloyd enterprises ltd.,Looking going; short term investmet;Add this to watchlist and wait for entry.👁️🗨️
For short term investment ;
Leave a " Like If you agree ".👍
.
Wait for small retracement & daily candle to close above - "55" .
.
Enter only if market Breaks and retrace above
"Yellow box" mentioned.
.
.
Don't make complicated trade set-up.📈📉
Keep it " simple, focus on consistency "💹
Refer our old ideas for accuracy rate🧑💻
Follow for daily updates👍
.
Refer old posted idea attached below.

Nifty IT, bearish signalsBearish Divergence Alert on #NIFTYIT
A classic warning sign! Price made a higher high, but RSI made a lower high
RSI nearing 50, a breakdown confirms further fall.
Be alert for IT stocks.

NIFTY IT Breakout retestHello Everyone,
Nifty It view if takin 200ema support then upmove possible as cup and handle breakout retest is happening

The Outperformer's Guide: Top Stocks from Each SectorThis analysis highlights key sectors and stocks to watch.
1. Nifty IT NSE:CNXIT
● The Nifty IT sector has demonstrated resilience during the recent negative market sentiments.
● Notably, it has formed a Descending Broadening Wedge pattern and expected to breakout soon.
➖ Stock to Watch - Coforge NSE:COFORGE
● The stock is currently trading just below its all-time high with a strong uptrend.
● Investors can consider accumulating shares on any dips.
2. Nifty Finance NSE:CNXFINANCE
● The Nifty Finance sector has recently breached its trendline support and is now approaching its next key support level, ranging from 22,500 to 22,700.
➖ Stock to Watch - Axis Bank NSE:AXISBANK
● The stock is currently trading at its support level, offering a potential short to mid-term trading opportunity.
3. Nifty PSU Bank NSE:CNXPSUBANK
● The Nifty PSU Bank sector has consolidated within a range and is nearing its support zone.
➖ Stocks to Watch - State Bank of India NSE:SBIN
● The stock is approaching its trendline support level.
● A buying opportunity may arise if the price reaches the 770 level.
4. Nifty Pharma NSE:CNXPHARMA
● After experiencing a downturn, the Nifty Pharma sector is now approaching its trendline support level.
➖ Stocks to Watch - Divis Laboratories NSE:DIVISLAB
● The price is overall in an uptrend.
● Following a record peak, the stock is now nearing its trendline support level.
● The best buy zone is between 5,500 and 5,600.
5. Nifty Media NSE:CNXMEDIA
● The Nifty Media sector is expected to witness a potential pullback towards the 1,720-1,760 level.
➖ Stocks to Watch - Network18 Media NSE:NETWORK18
● The stock is trading just above its trendline support zone, presenting a short to mid-term trading opportunity.
6. Nifty Realty NSE:CNXREALTY
● The Nifty Realty index is currently trading above its support zone.
➖ Stocks to Watch - Oberoi Realty NSE:OBEROIRLTY
● The stock is trading at the support zone and expected to rise soon.
7. Nifty FMCG NSE:CNXFMCG
● After a downfall, index is approaching its trendline support level
➖ Stocks to Watch - Varun Beverages NSE:VBL
● VBL is trading above its support zone, offering a short to mid-term trading opportunity.
8. Nifty Metal NSE:CNXMETAL
● The Nifty Metal sector is trading above its support zone,
➖ Stocks to Watch - Ratnamani Metals & Tubes NSE:RATNAMANI
● The stock price has formed an Ascending Triangle pattern and is currently trading above the support level.
9. Nifty Oil & Gas NSE:NIFTY_OIL_AND_GAS
● The Nifty Oil & Gas sector is also trading above its support zone.
➖ Stocks to Watch - Aegis Logistics NSE:AEGISLOG
● The stock price is close to breaking through its trendline resistance.
● If it can maintain its position above this level, a rally may be imminent.
10. Nifty Auto NSE:CNXAUTO
● Lastly, the Nifty Auto sector is trading above its support zone.
➖ Stocks to Watch - Eicher Motors NSE:EICHERMOT
● Eicher Motors is consolidating within a rectangle pattern, indicating a potential breakout.

Sectoral AnalysisHello & welcome to this analysis of
1 Nifty Next 50
2 Nifty Mid Select
3 Nifty Commodities
4 Nifty Energy
5 Nifty Infrastructure
6 Nifty IT
7 Nifty Pharma
The above are based on Ichimoku, Harmonic Trading Patterns & Elliot Waves
All the best for your trading & investing
Regards

NIFTY IT Break Down Before US ElectionNifty IT is currently break down and negative trend in before the us election. In the current market correction this is the one of the most positive and attractive sector in the indian market but this week the price is fall Nifty IT Company in the FII Friendly but Huge selling in the FII Less impact in the market.
Now currently my point of the view after the US Election ( If Donald Trump Win ) One time this is show in the deep correction, but we are bullish because this is the more beneficial of the Interest rate cut

QUESS CORP By KRS ChartsDate: 23rd July 2024
Time: 7:20PM
Why Quess Corp?
1. Fundamentally Good Company with decent P/E Ratio.
2. Since Quess Corp listed it, movement is sideways within specific range if we check bird view of it.
3. According to Dow Theory, it was making LH LL (Downtrend) but very first time in 2023 it made Higher Low and moving continuously upside and now sustain price near All-time resistance.
Once it Break this resistance there is Buy Trade for Quess Corp for new Higher High ~1000Rs.
And for Early Entry individual can enter small Qty at current price with SL of 591 Rs.

Chambal Fertilizers & Chemicals LimitedBuy above 550
All important points are marked.
𝐃𝐢𝐬𝐜𝐥𝐚𝐢𝐦𝐞𝐫: 𝐈𝐧𝐯𝐞𝐬𝐭𝐦𝐞𝐧𝐭 𝐢𝐧 𝐬𝐞𝐜𝐮𝐫𝐢𝐭𝐢𝐞𝐬 𝐦𝐚𝐫𝐤𝐞𝐭 𝐚𝐫𝐞 𝐬𝐮𝐛𝐣𝐞𝐜𝐭 𝐭𝐨 𝐦𝐚𝐫𝐤𝐞𝐭 𝐫𝐢𝐬𝐤𝐬, 𝐫𝐞𝐚𝐝 𝐚𝐥𝐥 𝐭𝐡𝐞 𝐫𝐞𝐥𝐚𝐭𝐞𝐝 𝐝𝐨𝐜𝐮𝐦𝐞𝐧𝐭𝐬 𝐜𝐚𝐫𝐞𝐟𝐮𝐥𝐥𝐲 𝐛𝐞𝐟𝐨𝐫𝐞 𝐢𝐧𝐯𝐞𝐬𝐭𝐢𝐧𝐠. 𝐒𝐭𝐨𝐜𝐤𝐬 𝐬𝐮𝐠𝐠𝐞𝐬𝐭𝐞𝐝 𝐢𝐧 𝐭𝐡𝐢𝐬 𝐠𝐫𝐨𝐮𝐩 𝐚𝐫𝐞 𝐟𝐨𝐫 𝐞𝐝𝐮𝐜𝐚𝐭𝐢𝐨𝐧 𝐩𝐮𝐫𝐩𝐨𝐬𝐞. 𝐖𝐞 𝐝𝐨𝐧𝐭 𝐦𝐚𝐤𝐞 𝐚𝐧𝐲 𝐩𝐫𝐨𝐟𝐢𝐭𝐬 𝐟𝐫𝐨𝐦 𝐭𝐡𝐢𝐬 𝐫𝐞𝐜𝐨𝐦𝐦𝐞𝐧𝐝𝐚𝐭𝐢𝐨𝐧𝐬 𝐞𝐯𝐞𝐫𝐲𝐭𝐡𝐢𝐧𝐠 𝐬𝐡𝐚𝐫𝐞𝐝 𝐡𝐞𝐫𝐞 𝐚𝐫𝐞 𝐜𝐨𝐦𝐩𝐥𝐞𝐭𝐞𝐥𝐲 𝐨𝐟 𝐟𝐫𝐞𝐞 𝐨𝐟 𝐜𝐨𝐬𝐭.

HCL TechnologiesBreakout at 1830 will create new highs.
Positive candle closing above 1830 will be a buy Target will be 1899.
All important points are marked.
𝐃𝐢𝐬𝐜𝐥𝐚𝐢𝐦𝐞𝐫: 𝐈𝐧𝐯𝐞𝐬𝐭𝐦𝐞𝐧𝐭 𝐢𝐧 𝐬𝐞𝐜𝐮𝐫𝐢𝐭𝐢𝐞𝐬 𝐦𝐚𝐫𝐤𝐞𝐭 𝐚𝐫𝐞 𝐬𝐮𝐛𝐣𝐞𝐜𝐭 𝐭𝐨 𝐦𝐚𝐫𝐤𝐞𝐭 𝐫𝐢𝐬𝐤𝐬, 𝐫𝐞𝐚𝐝 𝐚𝐥𝐥 𝐭𝐡𝐞 𝐫𝐞𝐥𝐚𝐭𝐞𝐝 𝐝𝐨𝐜𝐮𝐦𝐞𝐧𝐭𝐬 𝐜𝐚𝐫𝐞𝐟𝐮𝐥𝐥𝐲 𝐛𝐞𝐟𝐨𝐫𝐞 𝐢𝐧𝐯𝐞𝐬𝐭𝐢𝐧𝐠. 𝐒𝐭𝐨𝐜𝐤𝐬 𝐬𝐮𝐠𝐠𝐞𝐬𝐭𝐞𝐝 𝐢𝐧 𝐭𝐡𝐢𝐬 𝐠𝐫𝐨𝐮𝐩 𝐚𝐫𝐞 𝐟𝐨𝐫 𝐞𝐝𝐮𝐜𝐚𝐭𝐢𝐨𝐧 𝐩𝐮𝐫𝐩𝐨𝐬𝐞. 𝐖𝐞 𝐝𝐨𝐧𝐭 𝐦𝐚𝐤𝐞 𝐚𝐧𝐲 𝐩𝐫𝐨𝐟𝐢𝐭𝐬 𝐟𝐫𝐨𝐦 𝐭𝐡𝐢𝐬 𝐫𝐞𝐜𝐨𝐦𝐦𝐞𝐧𝐝𝐚𝐭𝐢𝐨𝐧𝐬 𝐞𝐯𝐞𝐫𝐲𝐭𝐡𝐢𝐧𝐠 𝐬𝐡𝐚𝐫𝐞𝐝 𝐡𝐞𝐫𝐞 𝐚𝐫𝐞 𝐜𝐨𝐦𝐩𝐥𝐞𝐭𝐞𝐥𝐲 𝐨𝐟 𝐟𝐫𝐞𝐞 𝐨𝐟 𝐜𝐨𝐬𝐭.

Wipro NSE By KRS ChartsDate : 6th June 2024
Time : 10.27 AM
Why I am Bullish on Wipro ?
1. Wipro has Formed Cup & Handle Chart Pattern on Monthly TF and successfully retested on neckline too as we can see on Chart.
2. Current Fibonacci level is 0.5 to 0.618 known as Golden Reversal Zone.
3. Nifty IT is Also Showing Bullish Trait like Bullish Divergence.
After all this Entry on this after Wipro Breaks 260 Rs and close above 260 Rs.
T1 will be according to C&H is ~530 Rs with SL of 439 Rs.

CYBERTECH SYSTEM By KRS ChartsDate:19th July 2024
Time: 9:49 AM
Why CYBERTECH SYS?
1. Stock has favorable P/E Ratio ~27. and sustaining good levels.
2. In Daily TF, Cup & Handle is clearly visible with strong breakout today in smaller TFs.
3. NIFTY IT is also in good momentum and this one is from IT industry too.
Target will be- 327~ Rs
Further update later as it moves

NiftyIT - CNXIT - Weekly -Cup and HandleNifty IT Weekly analysis of the Nifty IT Index, showing a Cup and Handle pattern
Key Insights:
Cup and Handle Pattern:
The pattern began forming around mid-2022 and completed by 2023.
The breakout from the handle occurred around 38,539.00, which is a critical support level now.
Measured Move and Target:
The chart projects a potential upside target near 51,077.75, based on the height of the cup.
A 48.01% gain from the lowest point of the cup is also marked, giving more context to the potential upside.
The measurement from the cup's bottom to the breakout level shows a 32.48% gain potential from the breakout point.
Price Action:
The index reached a recent high of 43,645.90 before pulling back slightly to 42,089.30.
The pullback might be a healthy consolidation after the strong upward move.
Support Levels:
Key support is identified at 38,539.00, which was the breakout point of the handle.
The chart shows another strong support level at 26,164.20, which was the bottom of the cup, though this level seems far from the current price.
Conclusion:
The Nifty IT Index appears to be in a bullish continuation phase after breaking out of a multi-month cup and handle pattern. While the target of 51,000 seems plausible, a healthy pullback or consolidation might occur around the 42,000 to 38,500 levels before further upside.
The CNX IT (Nifty IT) index consists of the major IT companies
Here's a list of the top stocks that are generally part of the Nifty IT Index:
Tata Consultancy Services (TCS)
Infosys Ltd.
Wipro Ltd.
HCL Technologies Ltd.
Tech Mahindra Ltd.
L&T Technology Services Ltd.
Mphasis Ltd.
Coforge Ltd.
Persistent Systems Ltd.
LTIMindtree Ltd.

Tech-Finance Synergy Could Boost Nifty This Week!Nifty It NSE:CNXIT
The IT index has been in a consolidation phase for an extended duration and developed a Cup & Handle pattern.
After breaking out, the index has effectively retested the breakout level and is now on an upward trajectory.
In the past week, the index gained approximately 3% and is showing robust strength, with expectations for further upward movement.
Nifty Private Bank NSE:NIFTYPVTBANK
The Private Bank index is currently experiencing a positive upward trend.
It previously established a Cup & Handle pattern, and following a breakout, the index saw substantial gains, consistently recording higher highs and lows.
After hitting an all-time high near the 26,650 level, the Private Bank index retraced to its immediate support zone and is now rising once more.
With a significant increase of almost 2.7% last week, the index seems to be in a bullish phase at present.

#Nifty directions and levels for September 11th.Good morning, friends! 🌞 Here are the market directions and levels for September 11th.
Market Overview:
Global markets are maintaining a moderately bearish trend, as indicated by the Dow Jones, while our local market has a moderately bullish sentiment. However, today, the market may open neutral to slightly gap-down, as SGX Nifty is indicating a negative move of around -30 points at 8 AM.
In the previous session, Nifty had a solid pullback, but Bank Nifty behaved differently, as it didn't pull back as much. Today’s basic structure suggests a minor correction, which we can analyze in the charts.
Nifty:
In the previous session, Nifty closed more or less at the same level it opened, even though there was a long pullback. This is what we usually refer to as range-bound market movement. The market remains in a range. What about today?
> If the gap-down sustains, we can expect a 50% to 61% correction in the minor swing, potentially forming a three-wave structure.
> A solid correction is expected only if it breaks the 61% level. If it does, then the next target is 78% and 24834. On the other hand, if it doesn't break, the market will likely form a minor range between the previous day’s high and the 61% downside level.
Alternate View:
An alternate scenario suggests that if the market opens with a gap-up or if the initial movement is a solid pullback, it may reach the 78% Fibonacci level, especially if it breaks the previous day’s high.
> In this case, if it doesn't break the previous high, the market may consolidate around that level.
