Nifty: The Unfilled Gap ScenarioNifty 1H Price Action Analysis (Week of 25th Aug) ⏰
Hey Traders! Let's break down the Nifty's juicy setup for the week.
The market left us a gift: The Nifty's powerful gap-up has left a major unfilled gap (24673 - 24852), a 179-point void that's calling price back! 📞🔻 Gaps are like market magnets 🧲—they have a strong tendency to get filled. Price has already tapped twice (18th & 22nd Aug) at the gap's roof (24850), treating it like a trampoline. But how long can the bounce last?
📍 The Key Levels & The Story:
The Floor (24850): This is our line in the sand. A solid break and close below this on the 1H chart could open the trapdoor 🚪, sending Nifty on a quick ride down to grab those gap points. It's the trade with the wind at its back.
The Ceiling (25150): This is the recent high and descending trendline resistance. A break above is exciting, but we're smart traders—we don't chase! 🏃💨 We've all been fakeout victims.
✅ The Bullish "No Fakeout" Plan:
To avoid getting trapped, we wait for a "Break-and-Retest"! If price punches above 25150, we don't buy the breakout. We wait patiently for price to come back and kiss the 25150 level and hold it as new support. That is our green light 🚦 and the high-probability long entry for a continued upmove!
The Bottom Line: Bears are eyeing the gap. Bulls need to prove their strength with a clean break and hold above 25150. Neutral until one side wins!
Bank Nifty Hint: Unlike Nifty, Bank Nifty has already filled its similar gap, suggesting Nifty might be next in line to complete the move.
Trading Plan:
Short Signal: Break & close below 24850. 🎯 Target: The Gap Zone.
Long Signal: Break ABOVE 25150, then wait for a pullback that finds support at 25150.
⚠️ Disclaimer: This is strictly an intraday idea for educational purposes. Trading is incredibly risky and you can lose your capital. This is not advice.
Found this helpful? Please give it a Boost! 🔥
What stocks should we dive into next? Let me know below! 👇😊
Niftylevels

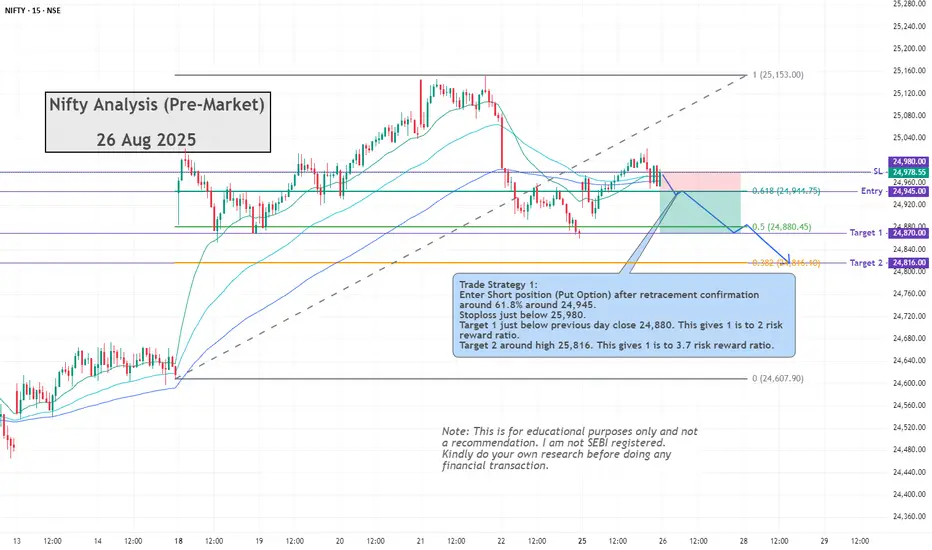
Nifty AnalysisThis is Nifty Analysis for Thursday 26th Aug 2025.
Nifty formed a small green candle previous day and is up by 0.39%. Still it may attempt to fill the Monday Gap up before moving upwards.
Trade Strategy 1: Enter Short position (Put Option) after retracement confirmation around 61.8% around 24,945. Stoploss just below 25,980. Target 1 just below previous day close 24,880. This gives 1 is to 2 risk reward ratio. Target 2 around high 25,816. This gives 1 is to 3.7 risk reward ratio.
Safe traders may consider Trailing Stoploss after 1 is to 1 risk reward ratio is achieved. Note - This is for educational purposes only and not a trade recommendation. I am not SEBI registered. Kindly do your own research before doing any financial transaction.
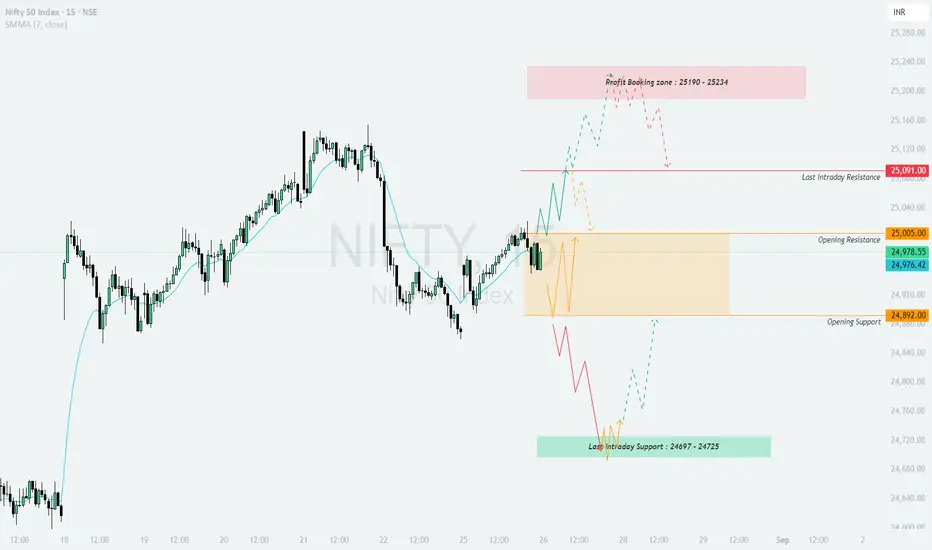
NIFTY : Trading levels and Plan for 26-Aug-2025📊 NIFTY TRADING PLAN – 26-Aug-2025
On 25-Aug-2025, Nifty closed at 24,978, positioned between critical levels. The key support and resistance zones for tomorrow are:
Opening Support: 24,892
Opening Resistance: 25,005
Last Intraday Resistance: 25,091
Profit Booking Zone: 25,190 – 25,234
Last Intraday Support: 24,697 – 24,725
Now let’s go through possible scenarios.
🔼 1. Gap-Up Opening (100+ points above 25,091)
If Nifty opens above 25,091, it directly enters the bullish zone.
📌 Plan of Action:
Watch for sustainability above 25,091 in the first 15–30 minutes. If sustained, the index can march towards the Profit Booking Zone 25,190 – 25,234.
In this zone, expect some consolidation or profit booking. Fresh long positions should be cautious here.
If 25,234 is taken out convincingly, it may lead to another strong rally, but chasing at higher levels 🚫 is risky.
Failure to sustain above 25,091 may result in a pullback toward the 25,005 – 24,892 zone.
👉 Tip: On gap-ups, avoid aggressive buying at open. Wait for retracements near support to enter for better risk–reward.
➖ 2. Flat Opening (Around 24,892 – 25,005)
A flat start around the opening support–resistance zone will be a deciding factor for intraday trend.
📌 Plan of Action:
If Nifty sustains above 25,005, it will likely attempt a breakout towards 25,091 → 25,190–25,234 zone.
Failure to hold 24,892 will open downside towards 24,725 – 24,697 (Last Intraday Support).
In flat openings, the first 30 minutes are crucial. Let the index pick direction before entering.
👉 Tip: For options traders, flat openings are best for straddle/strangle adjustments. Capture volatility once direction confirms.
🔽 3. Gap-Down Opening (100+ points below 24,892)
If Nifty opens below 24,892, it will show bearish pressure right from the start.
📌 Plan of Action:
Below 24,892, the index can test the Last Intraday Support Zone: 24,725 – 24,697.
Buyers may attempt to defend this support, so expect a bounce opportunity here (good for scalpers).
If 24,697 is broken with volume, further downside continuation may occur.
Avoid panic shorts at the open — wait for a retest of resistance before entering for safer trades.
👉 Tip: After a gap-down, use put spreads instead of naked puts to manage risk in case of sharp reversals.
🛡️ Risk Management Tips for Options Traders
Risk only 1–2% of your capital per trade.
Always trade with a defined stop-loss . Do not average losing positions.
Avoid over-leveraging, especially in weekly expiry sessions ⚡.
Prefer spreads (Bull Call, Bear Put, Iron Condors) to reduce premium decay impact.
Track India VIX 📉 before entering — high VIX means bigger moves, low VIX means range-bound.
📌 Summary & Conclusion
🟢 Above 25,091 → 25,190–25,234 (Profit Booking Zone) .
🟧 Flat around 24,892–25,005 = Wait for breakout/breakdown confirmation .
🔴 Below 24,892 → 24,725–24,697 (Buyer’s defense zone) .
Key Pivot: 24,892 – 25,005 zone for intraday trend.
⚠️ Disclaimer: I am not a SEBI-registered analyst. This analysis is purely for educational purposes and should not be considered financial advice. Please consult a financial advisor before making trading/investment decisions.
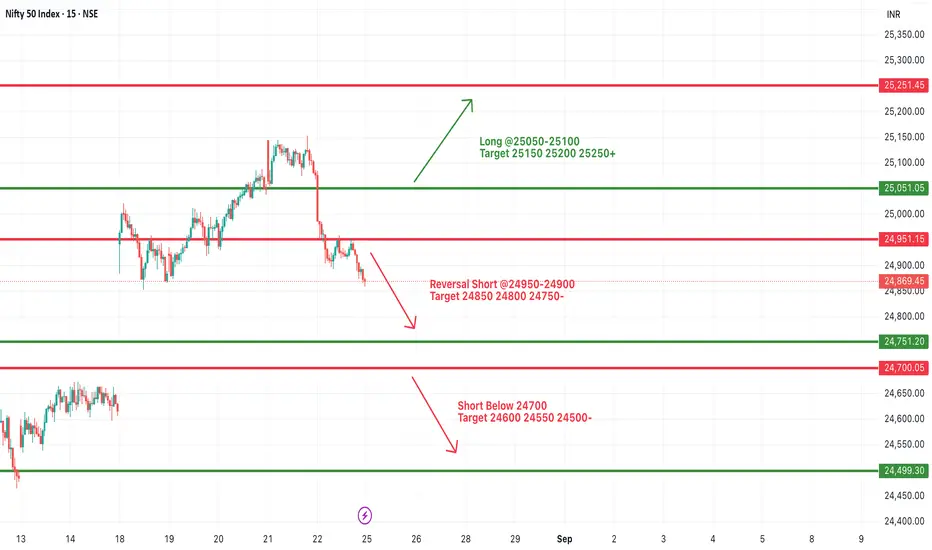
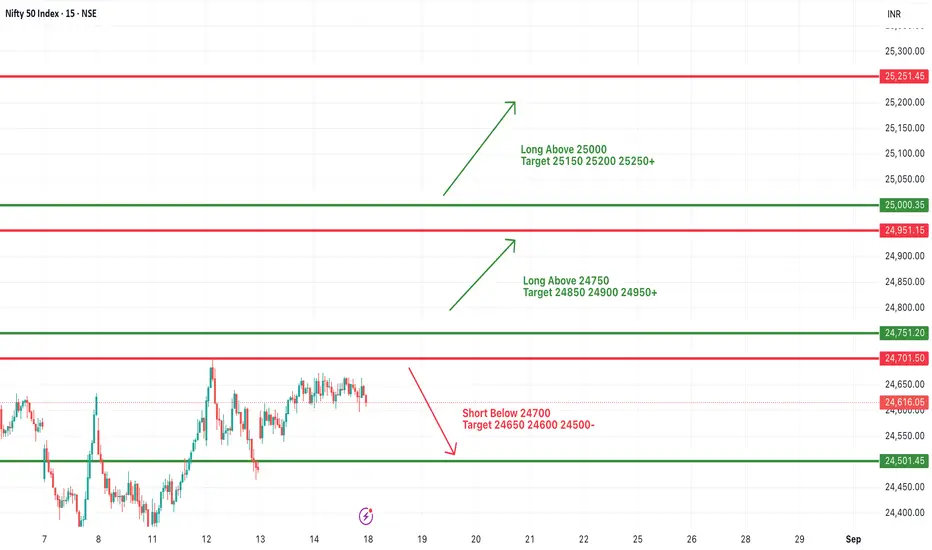
#NIFTY Intraday Support and Resistance Levels - 25/08/2025Nifty is likely to see a slightly gap-up opening today, with the index expected to start near the 24,950 mark. After recent declines, the price action around this level will be crucial in determining whether the market can stage a recovery or extend its weakness further.
On the upside, if Nifty sustains above 25,050–25,100, a bullish momentum could trigger a rally towards 25,150, 25,200, and 25,250+. A sustained move beyond 25,250 may further strengthen the sentiment and push the index higher into uncharted levels, favoring positional longs.
On the downside, if the index fails to sustain above 24,950 and shows weakness, a reversal short opportunity may open up around 24,950–24,900 zones. In such a case, immediate targets are seen at 24,850, 24,800, and 24,750. A breakdown below 24,700 would invite deeper selling pressure, exposing 24,600, 24,550, and 24,500 zones as the next critical supports.
Overall, the 24,950–25,050 zone remains the key intraday pivot range. Traders should stay cautious, as any false breakout or breakdown in this zone may trigger sharp reversals. Following strict stop losses and booking profits at crucial levels will be the best strategy in today’s session.
NIFTY : Trading level and plan for 25-Aug-2025Nifty Trading Plan for 25-Aug-2025
Key Levels from Chart:
Opening Resistance → 24,940
Opening Support → 24,809
Last Intraday Resistance → 25,021
Major Resistance Zone → 25,097
Last Intraday Support Zone → 24,703 – 24,729
Previous Close → 24,869.45
🚀 Scenario 1: Gap Up Opening (100+ points above previous close)
If Nifty opens above 24,970–25,000, bullish momentum may dominate the early session.
Immediate hurdle will be 25,021 (Last Intraday Resistance). If sustained, price can extend toward 25,097 zone where sellers are likely to emerge.
A rejection near 25,021–25,097 could bring the index back to retest 24,940 (Opening Resistance turned support).
Sustaining above 25,097 would be a strong bullish breakout, but the risk-reward for fresh longs reduces beyond this point.
💡 Plan of Action : Look for long entries above 25,021 with strict SL below 24,940. Target 25,097. If gap-up fails to hold and price slips below 24,940, consider cautious shorts for a move back to 24,809.
📊 Scenario 2: Flat Opening (within ±50–80 points of 24,870)
Flat openings often lead to consolidation before a breakout.
Price between 24,809 – 24,940 is a tight trading range, and whipsaws are common here.
Breakout above 24,940 can open upside toward 25,021 – 25,097.
Breakdown below 24,809 signals weakness, leading toward 24,729 zone (last intraday support).
💡 Plan of Action : Avoid aggressive trading inside 24,809–24,940. Take positions only after breakout above 24,940 (longs) or breakdown below 24,809 (shorts). Patience will protect you from false moves in a range.
⚠️ Scenario 3: Gap Down Opening (100+ points below previous close)
If Nifty opens near 24,750 or below, sellers will control the session.
First key level is 24,729–24,703 support zone. If held, expect a bounce toward 24,809–24,940 for intraday recovery.
If this support zone breaks decisively, downside opens further, and panic selling may take the index lower.
Failure to sustain below 24,703 can trap shorts, leading to sharp reversals upward.
💡 Plan of Action : Go short only if 24,703 breaks with strong volume, targeting lower levels. For scalpers, a bounce from 24,703–24,729 can be used for quick longs with a strict SL below 24,700.
📌 Risk Management Tips for Options Traders 💡
On gap openings, avoid chasing inflated premiums . Wait for price stabilization before entering.
Prefer spreads (bull call/bear put) over naked options to reduce theta decay risk.
Always set stop-loss on option positions — market can reverse quickly.
Keep intraday position sizing small (2–3% of capital per trade).
Use time-based exits (e.g., exit 30–45 mins before market close) if levels are not reached.
📝 Summary & Conclusion
Above 24,940, bullish bias can push Nifty toward 25,021 – 25,097 🚀.
Between 24,809 – 24,940, the market may consolidate ⚖️, avoid overtrading.
Below 24,809, weakness likely toward 24,703 – 24,729 ⚠️.
Below 24,703, strong downside risk opens.
👉 Key message: Stay disciplined, trade only on breakouts/breakdowns, and manage risk strictly.
⚠️ Disclaimer
I am not a SEBI registered analyst. This analysis is purely for educational purposes . Please consult your financial advisor before making any trading or investment decisions.

Nifty Trend AnalysisNifty has completed its corrective Wave B at 25,151 (Spot). It has now begun a sharp correction to complete Wave C. If this is a zig-zag correction, then Wave C is expected to end around 23,720, with TP2 at 22,936. The level of 23,463 will also play a crucial role in between. Generally, Wave 2 tends to be a slow correction phase where institutional accumulation takes place. If the price bounces to 24,917–24,876 or 24,952–25,068, these should be considered selling opportunities.

BIG GAP needs to be filled!! MORE downside??As we can see NIFTY showed unidirectional downfall exactly from our trendline RESISTANCE exactly as analysed and we analysed it through the previous day closing of the candle. Now we can see a big gap that needs to be filled below 24860, hence we might see a trap before finally filling in the GAP below which is almost 200 point. SO, one can plan their trades if following criteria is met

niftyfake breakout in nifty may be next week we see 24350. may be we can see 23700 levels in the sept or oct.

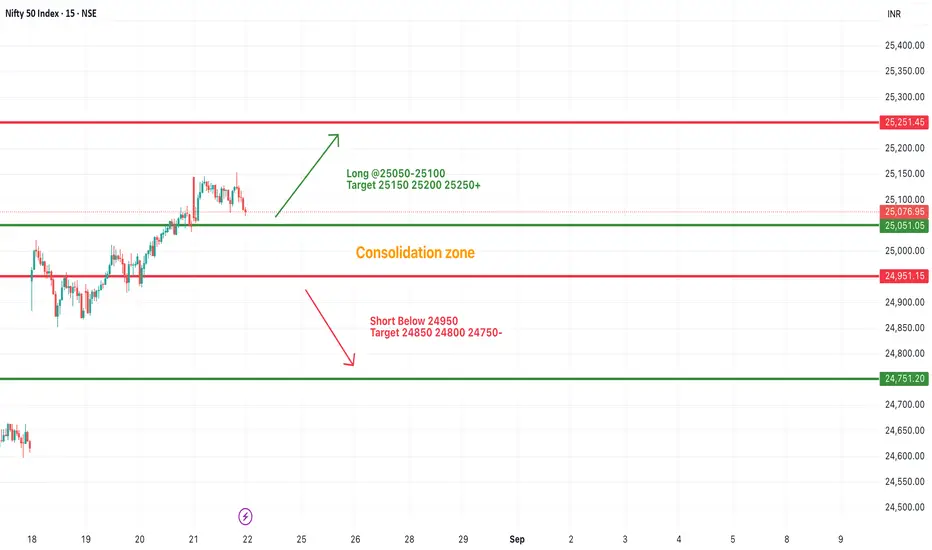
#NIFTY Intraday Support and Resistance Levels - 22/08/2025Today, Nifty is expected to open with a gap down near the 25,000 level, indicating a weak start to the session. Over the past two trading days, the index has been consolidating within a tight range, showing indecisiveness among traders. This consolidation zone remains crucial, as a breakout or breakdown from this level will likely decide the next big move.
On the upside, if Nifty sustains above the 25,050–25,100 zone, we may witness a bullish momentum building up. In such a case, the index could move towards 25,150, 25,200, and even extend up to 25,250+. A strong breakout above 25,250 may further open the gates for 25,350 and higher levels, giving traders a clear long opportunity.
On the downside, weakness will emerge if Nifty breaks below the 24,950 mark. Such a move could trigger a selling wave, dragging the index towards 24,850, 24,800, and 24,750 levels. A sustained break below 24,750 may extend the bearish pressure, taking Nifty further down towards 24,700 and beyond.
NIFTY MATHEMATICAL LEVELSThese Levels are based on purely mathematical calculations.
Validity of levels are upto expiry of current week.
How to use these levels :-
* Mark these levels on your chart.
* Safe players Can use 15 min Time Frame
* Risky Traders Can use 5 min. Time Frame
* When Candle give Breakout / Breakdown to any level we have to enter with High/Low of that breaking candle.
* Targets will be another level marked on chart
* Stop Loss will be Low/High of that Breaking Candle.
* Trail your SL with every candle.
* Avoid Big Candles as SL will be high then.
* This is one of the Best Risk Reward Setup.
For Educational purpose only
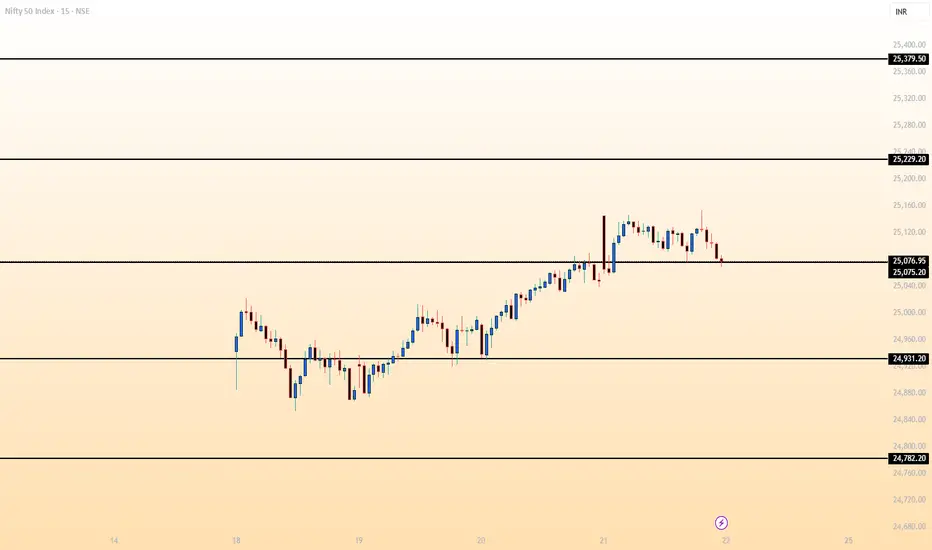
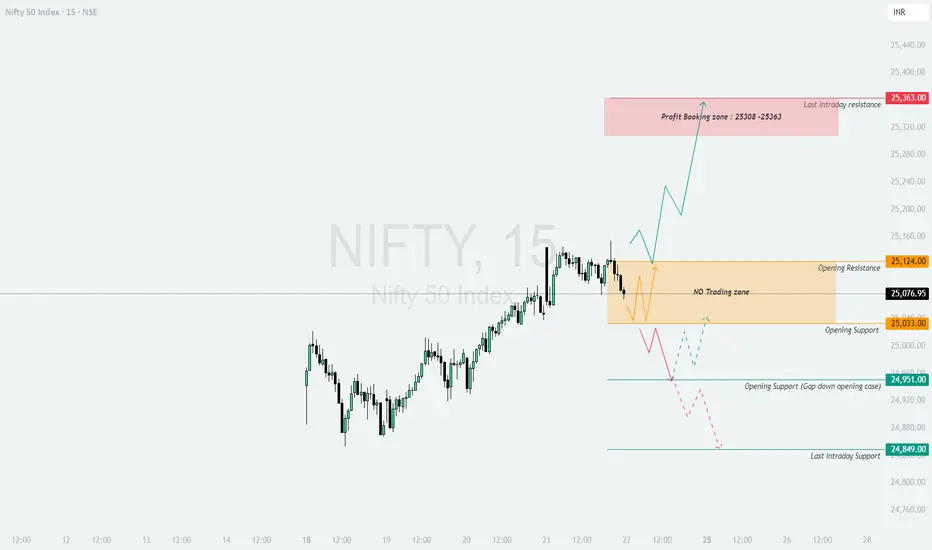
NIFTY : Trading levels and plan for 22_Aug-2025📌 Nifty Trading Plan for 22-Aug-2025
Key Levels from Chart:
Opening Resistance → 25,124
Opening Support → 25,033
Profit Booking Zone (Last Intraday Resistance) → 25,308 – 25,363
Opening Support in Gap Down Case → 24,951
Last Intraday Support → 24,849
Previous Close → 25,076.95
🚀 Scenario 1: Gap Up Opening (100+ points above previous close)
If Nifty opens above 25,175+, bullish sentiment will dominate the early session.
Immediate hurdle is 25,308 – 25,363 (Profit Booking Zone). Traders should expect selling pressure here as short-term players may book gains.
Sustaining above 25,363 can extend momentum further, but risk-reward weakens for fresh longs.
If rejection happens from 25,308–25,363, index could retest 25,124 support.
💡 Plan of Action : Look for long trades above 25,124 with confirmation, targeting 25,308–25,363. Trail stop-loss below 25,033. Book partials at resistance and avoid fresh longs if market looks tired near highs.
📊 Scenario 2: Flat Opening (within ±50–80 points of 25,077)
Flat openings often cause range-bound moves until a breakout.
Price between 25,033 – 25,124 is a No Trading Zone . Avoid entering inside this range to prevent whipsaws.
Breakout above 25,124 can trigger a rally toward 25,308 – 25,363 zone.
Breakdown below 25,033 opens weakness toward 24,951.
💡 Plan of Action : Stay patient. Go long only above 25,124 or short below 25,033. Inside range, avoid overtrading and save capital for directional clarity.
⚠️ Scenario 3: Gap Down Opening (100+ points below previous close)
If Nifty opens near 24,950 or below, sellers will dominate.
Support at 24,951 may attract intraday buying or short-covering bounce toward 25,033.
If 24,951 breaks decisively, expect further downside toward 24,849 (Last Intraday Support).
Failure to sustain below 24,951 can trap shorts, leading to a recovery back to 25,124 resistance zone.
💡 Plan of Action : Go short only if 24,951 breaks with volume, keeping stop-loss above 25,033. For scalpers, a bounce from 24,951 can be used for quick longs with strict SL.
📌 Risk Management Tips for Options Traders 💡
Never chase option premiums after a big gap — premiums are inflated, wait for retracements.
Stick to defined-risk strategies (spreads, butterflies) instead of naked buying.
Always use stop-loss on options since time decay works against buyers.
Avoid over-leveraging — allocate not more than 2–3% capital per trade.
Book partial profits near key levels 🎯 and trail the rest.
📝 Summary & Conclusion
Above 25,124, momentum can extend toward 25,308 – 25,363, where profit booking is expected 🚀.
Between 25,033 – 25,124, market is in a No Trading Zone ⚖️. Avoid traps.
Below 25,033, weakness toward 24,951, and if broken → 24,849 ⚠️.
👉 The day will be highly level-driven, and patience is key. Trade only at breakouts/breakdowns for clear setups.
⚠️ Disclaimer
I am not a SEBI registered analyst. This analysis is purely for educational purposes . Please consult your financial advisor before making any trading or investment decision.
Nifty AnalysisThis is Nifty Analysis for Thursday 22nd Aug 2025.
Nifty formed a red candle but formed higher high and higher low formation on Weekly Expiry on Thursday. Nifty is up by 0.13%.
Trade Strategy 1:
Enter Long position (Call Option) after retracement confirmation around 61.8% and Wednesday close - around 25,050. Stoploss just below 25,000.
Target 1 just below previous day high 25,150. This gives 1 is to 1.7 risk reward ratio.
Target 2 around 25,200. This gives 1 is to 2.7 risk reward ratio.
Safe traders may consider Trailing Stoploss after 1 is to 1 risk reward ratio is achieved.
Note - This is for educational purposes only and not a trade recommendation. I am not SEBI registered. Kindly do your own research before doing any financial transaction.

Nifty AnalysisThis is Nifty Analysis for Thursday 21st Aug 2025. Its Weekly Expiry day and may be volatile. Option buyers need to be cautious and safe traders may avoid this day.
Nifty formed a bullish candle and moved up by 0.28% on Wednesday. Nifty is above short term EMAs in Daily timeframe, but is around resistance and psychological level 25,000. This strategy is a risky one.
Trade Strategy 1: Enter Long position (Call Option) after retracement confirmation around previous day low - around 24,930. Stoploss just below 24,850. Target 1 just below previous day close 25,038. This gives 1 is to 1.5 risk reward ratio. Target 2 around previous day high 25,088. This gives 1 is to 2 risk reward ratio.
Safe traders may consider Trailing Stoploss after 1 is to 1 risk reward ratio is achieved.
Note - This is for educational purposes only and not a trade recommendation. I am not SEBI registered. Kindly do your own research before doing any financial transaction.

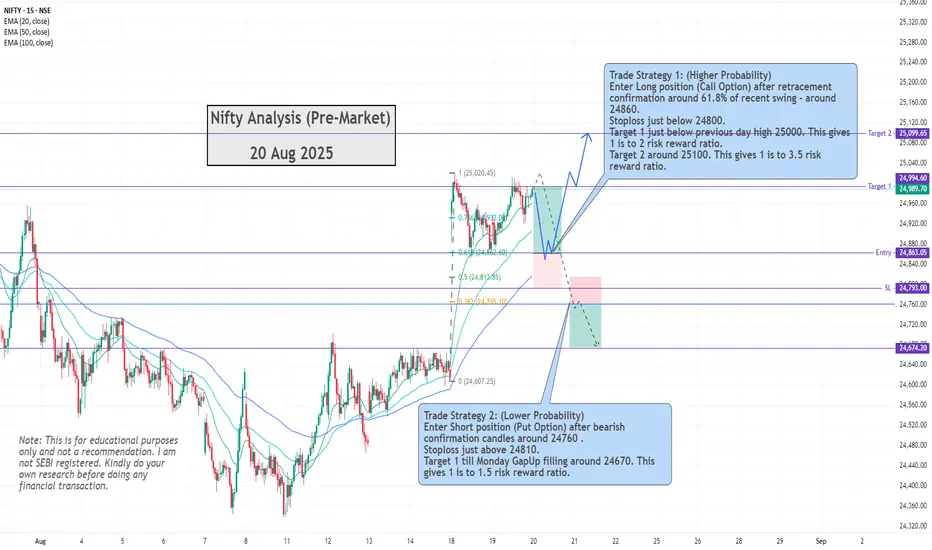
Nifty AnalysisThis is Nifty Analysis for Wednesday 20th Aug 2025.
Nifty formed a bullish candle and moved up by 0.4% on Tuesday. Nifty is above short term EMAs in Daily timeframe, but is near immediate resistance and psychological level 25,000. Though short term Technicals indicate bullishness, wait for a pullback and enter trade. These 2 strategies may work best for Tuesday.
Trade Strategy 1: (Higher Probability)
Enter Long position (Call Option) after retracement confirmation around 61.8% of recent swing - around 24,860. Stoploss just below 24,800. Target 1 just below previous day high 25,000. This gives 1 is to 2 risk reward ratio. Target 2 is around 25100. This gives 1 is to 3.5 risk reward ratio.
Trade Strategy 2: (Lower Probability)
Enter Short position (Put Option) after bearish confirmation candles around 24,760 . Stoploss just above 24,810. Target 1 till Monday Gap Up filling around 24,670. This gives 1 is to 1.5 risk reward ratio.
Safe traders may consider Trailing Stoploss after 1 is to 1 risk reward ratio is achieved.
Note: This is for educational purposes only and not a trade recommendation. I am not SEBI registered. Kindly do your own research before doing any financial transaction.
#nifty50 levels for tomorrow • Analysis For Tomorrow !
• Important Levels
• Support: 24900 - 24770 - 24570.
• Resistance : 24915 - 25125 - 25350.
✓ .

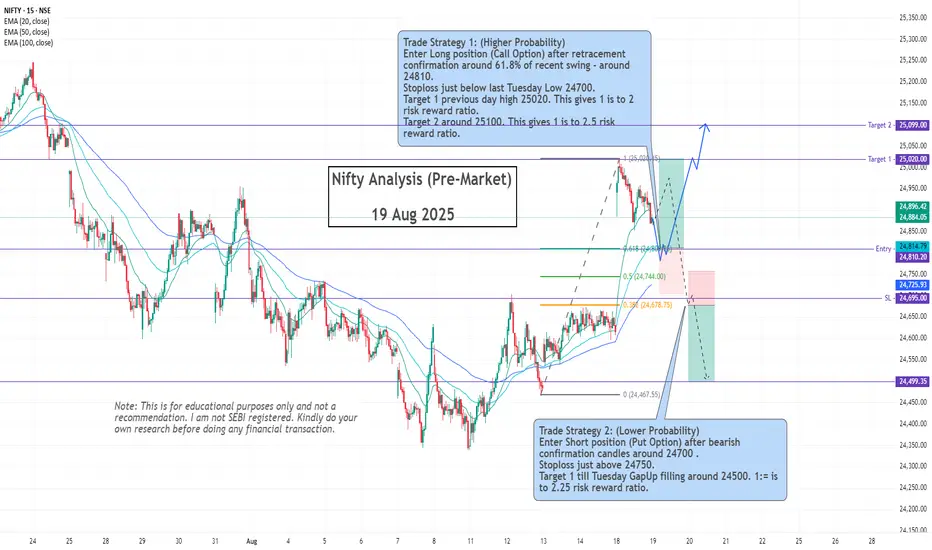
Nifty AnalysisThis is Nifty Analysis for Tuesday 19th Aug 2025.
Nifty opened Gap Up and moved up by 1% on Monday due to the new events (GST, Rating Upgrade). Nifty formed a red candle but has higher high and higher Low formation. It is above short term EMAs in Daily timeframe.
These 2 strategies may work best for Tuesday.
Trade Strategy 1: (Higher Probability)
Enter Long position (Call Option) after retracement confirmation around 61.8% of recent swing - around 24,810. Stoploss just below last Tuesday Low 24,700.
Target 1 previous day high 25,020. This gives 1 is to 2 risk reward ratio. Target 2 around 25,100. This gives 1 is to 2.5 risk reward ratio.
Trade Strategy 2: (Lower Probability)
Enter Short position (Put Option) after bearish confirmation candles around 24,700 . Stoploss just above 24,750. Target 1 till Tuesday Gap Up filling around 24,500. This gives 1 is to 2.25 risk reward ratio.
Safe traders may consider Trailing Stoploss after 1 is to 1 risk reward ratio is achieved.
Note: This is for educational purposes only and not a trade recommendation. I am not SEBI registered. Kindly do your own research before doing any financial transaction.
#NIFTY Intraday Support and Resistance Levels - 18/08/2025Nifty is likely to open with a gap-up above the 24,750 level, indicating bullish momentum at the start of the session. If the index sustains above this level, further upside movement towards 24,850, 24,900, and 24,950+ can be expected. A strong breakout above 25,000 could extend the rally towards 25,150, 25,200, and 25,250+.
On the downside, immediate support lies near 24,700, and a break below 24,700 may lead to some profit booking, dragging the index towards 24,650, 24,600, and 24,500-. However, as long as Nifty trades above 24,750, the bias remains positive with dips likely to be bought into.
Overall, the sentiment is bullish, and traders should trail their stop losses while riding the upside move.
NIFTY MATHEMATICAL LEVELS These Levels are based on purely mathematical calculations.
Validity of levels are upto expiry of current week.
How to use these levels :-
* Mark these levels on your chart.
* Safe players Can use 15 min Time Frame
* Risky Traders Can use 5 min. Time Frame
* When Candle give Breakout / Breakdown to any level we have to enter with High/Low of that breaking candle.
* Targets will be another level marked on chart
* Stop Loss will be Low/High of that Breaking Candle.
* Trail your SL with every candle.
* Avoid Big Candles as SL will be high then.
* This is one of the Best Risk Reward Setup.
For Educational purpose only

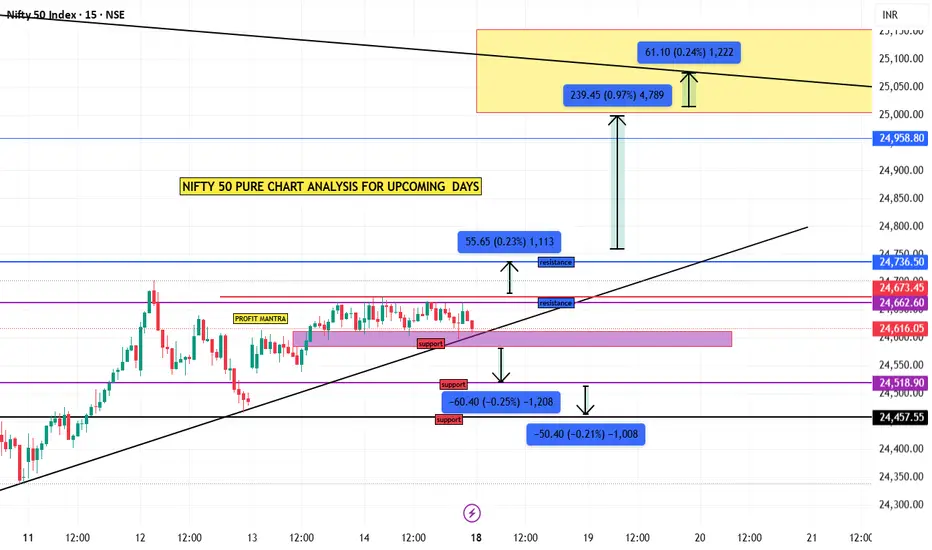
nifty 50 simple analysispure price action chart analysis. here nifty 50 behave sideways
in 15 minute time frame, see chart you can understand.
Nifty 50 Intraday Expiry for 14/08/25 ⚡ Trade Setups with Precise Stop Loss Rules
A) BULLISH BREAKOUT (PREFERRED):
✅ Trigger: Hourly candle CLOSE > 24,700 (breakout confirmation).
🎯 Targets:
T1: 24,800
T2: 24,950 (triangle high)
❌ STOP LOSS: Below the LOW of breakout candle (e.g., if breakout candle low = 24,685, SL = 24,684).
B) BEARISH BREAKDOWN:
✅ Trigger: Hourly candle CLOSE < 24,465 (breakdown confirmation).
🎯 Targets:
T1: 24,350
❌ STOP LOSS: Above the HIGH of breakdown candle
🚫 STRICT NO-TRADE ZONES (NTZ):
Upper NTZ: 24,535 – 24,700
→ Avoid longs/shorts. Wait for confirmed breakout/breakdown.
Lower NTZ: 24,535 – 24,465
→ Avoid premature shorts. Only trade on confirmed close < 24,465.
Price Bias: Bullish Edge: Repeated tests of 24,700 suggest weakening resistance. Breakout likely if volumes surge.
Bearish Caution: Failure below 24,535 may accelerate selling toward 24,350.
📅 Critical Notes:
Expiry + Holiday Risk:
15th Aug (Fri): Weekly Expiry + Independence Day Holiday (Market Closed).
16th–17th Aug (Sat–Sun): Weekend closure.
🛑 NO BTST: Square off all positions by day’s close (14th Aug). Holding overnight into expiry + 3-day break = unacceptable risk!
Disclaimer:
This idea is for educational purposes only. The market outlook involves substantial risk, especially during expiry and holidays. Do NOT hold positions overnight. Trade with strict stop losses, and adjust position sizes to volatility. Consult a financial advisor if needed. Jai Hind! 🇮🇳"
Happy Independence Day! Celebrate freedom, trade disciplined.
Key Tip: Trail SL to breakeven at T1 to protect profits.

14 Aug 2025 - Change of stance on Nifty at 24500 levelsNifty Stance Bullish 🐂
Nifty changed its stance from bearish to bullish on 12th August, Tuesday. If you are following me on Trading view, you would have got the email once this EMA crossover happened. Interestingly, Nifty made this reversal after a decent trend of 473 points.
Even though the reversal came, Nifty is still unable to break out from the resistance level of 24620. We are still hovering around 40 points away from the last crossover signal at 24580.
US markets, which are hitting a new high every day, compare this to our markets, which are tired and lacking momentum. We might need fresh triggers to escape from these levels and the US-India trade deal could be a big reason.
A possible trigger could be either a monetary policy relaxation (reduction of repo rates) or a fiscal policy relaxation (decrease in taxes) to boost production/consumption. We cannot reduce our repo rates, as the current 5.5% rate is only 1% higher than the US Fed rate of 4.5%. If we reduce our repo further, our debt and money market will crash, which points us to the only option of a tax cut.

Nifty swing Pullback Failure 15mins Hello,
Nifty again bounce from previous low/support levels of 24350 to high of 24700 and pullback is failed and falled again CMP 24510 ......50SMA support and RSI adjusted from overbought also more than 50% retracement near by 61% reatrce making it good Pullback Reversal Set up for swing+postional

NIFTY Analysis 12 AUGUST, 2025 ,Morning update at 9 ami am going out of india for 20 days ,today is my last update ,
Bullish Move
if Sustain above 24693 possible rally towards 24799
If Bn pattern appears on 5M chart high probability of short covering
Extended target to 24906 if momentum strong.
Bearish Move
Fail to hold above 24632 possible slip to 24520.
If 24520 breaks, next support will be 24445 and 24358.
Sideways
Price oscillates between 24632–24693 without breakout.
Low probability moves, better for quick scalps
