Nifty Intraday levels - 11Aug 2025Nifty for tomorrow
Bullish Scenario - If NIFTY breaks 24370, it could rally towards 24,400 or higher, 24435
Bearish Scenario - Failure to hold 24349.20 may lead to a test of 24307 or lower 24270
Note: Monitor global cues and intraday volume for confirmation of trends, and book profits every 30 points, as we are getting very few trending moves.
Niftylevels

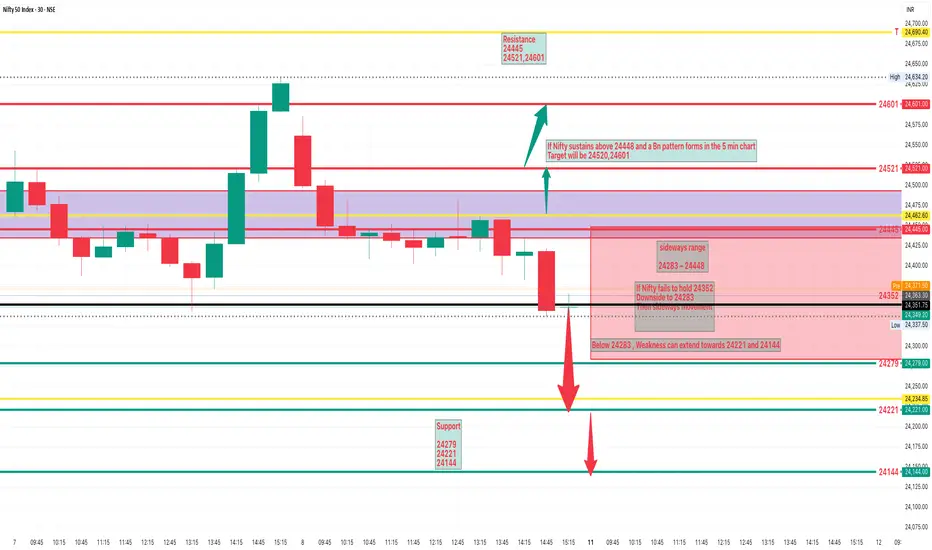
NIFTY Analysis 11 AUGUST, 2025 ,Morning update at 9 amBase Timeframe: 4-hour chart and some time from 30 minut time frame
Formula Used:
(High + Low) / Closing Price = Squre root of Previous Day Closing Level
This formula is used to calculate key reference levels
Extra Filter for today Level making ,6 Support and Resistance levels derived from last three days price action on above formula
Expected Opening Around 24388
Initial Move Possible rise to 24441
Key Trading Triggers
Bullish Scenario
If Nifty sustains above 24448 and bn pattern forms in the 5 min chart
targatw will be 24520, 24601
Bearish Scenario
If Nifty fails to hold 24352
Downside to 24283
Then sideways movement
Support:
24279
24221
24144
Resistance:
24445,24521,24601
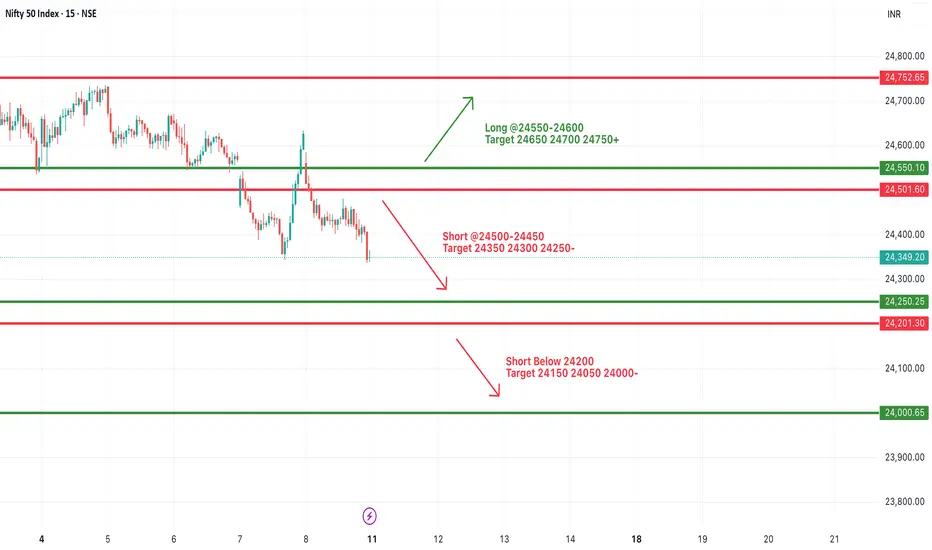
#NIFTY Intraday Support and Resistance Levels - 11/08/2025Nifty is expected to open slightly gap-up, suggesting a positive but cautious start to the session. On the upside, a sustained move above 24,550–24,600 may trigger further momentum toward 24,650, 24,700, and 24,750+.
On the downside, weakness could develop if the index trades below 24,500–24,450, which may lead to declines toward 24,350, 24,300, and 24,250-. A breakdown below 24,200 could further extend the fall toward 24,150, 24,050, and 24,000-. The 24,500 zone will act as a pivot, and traders should watch for price action confirmation before entering positions, keeping strict stop-losses in place and booking profits at targets.
Nifty Levels and Ideas for the Next Week (11th Aug - 14 Aug )Although there was a huge sell off seen on 8th August Friday, But a recovery can be witnessed in Nifty - that too in the case if it strongly surpasses the Resistance levels which have turned stronger now - the 24480 - 24560 - 24640 levels are stacked on above the other - breaking these levels in continuation may not be possible in the current ongoing downtrend market. But nothing is impossible. In contrary some more fall can't be denied - yes but before that an upward retracement can be seen and there might be some Sell on Rise scenarios may occur, which then can take the Nifty towards 2429 and then 24200 levels too. 24150-24200 may act as a good and strong support area.
Let's see how this analysis plays out for the market in upcoming week.
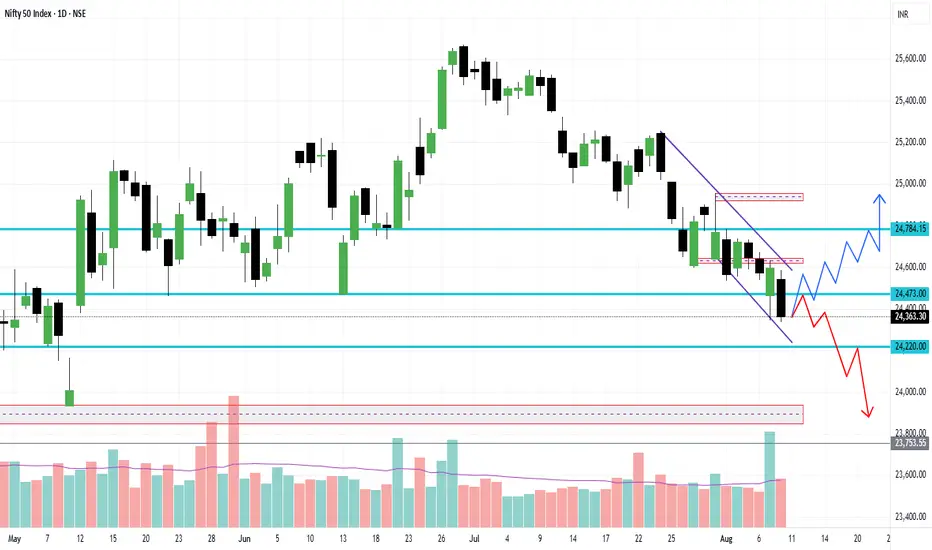
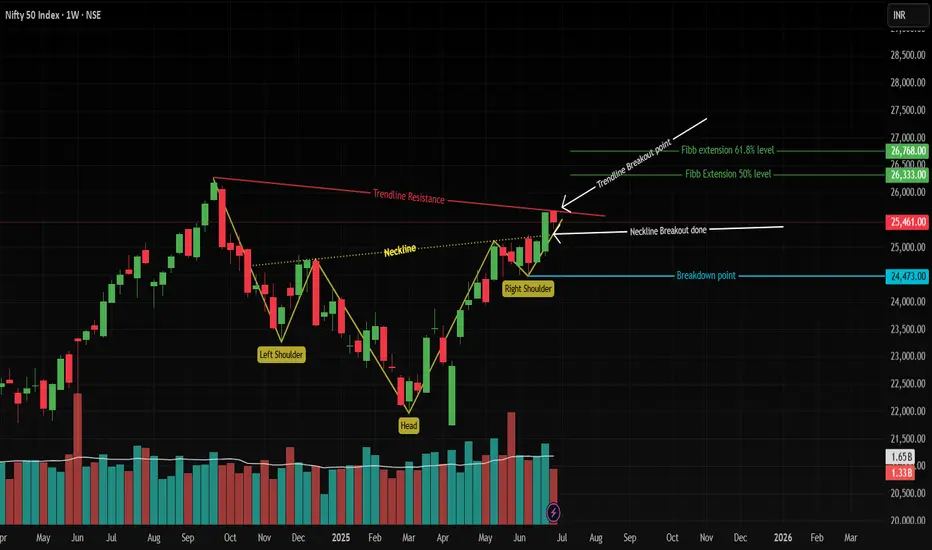
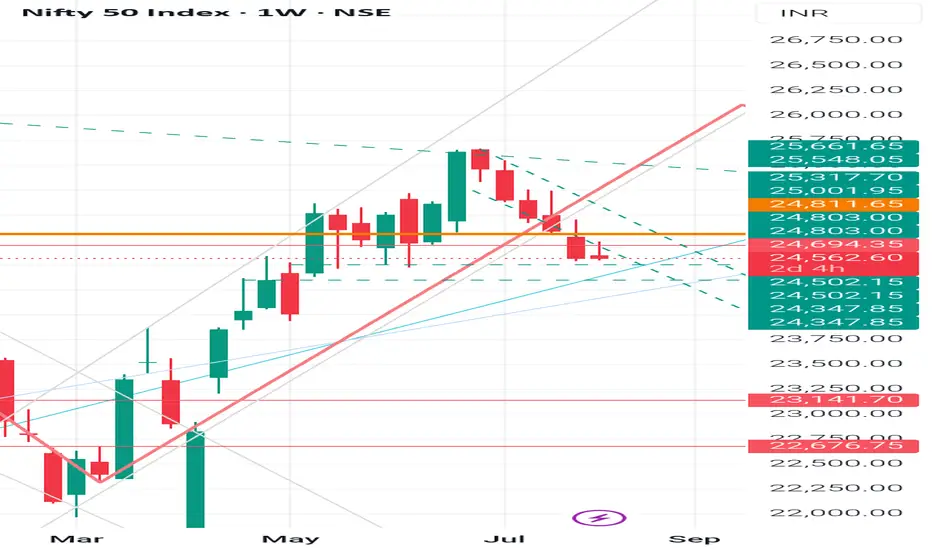
Nifty 50 Weekly: Inverted H&S Breakout Confirmation Awaited!Pattern & Breakout:
Inverted Head & Shoulders formed on the weekly chart (bullish reversal pattern). ✅
Neckline breakout occurred last week, but confirmation pending! This week failed to close above breakout level.
Confluence Alert: Weekly close above breakout level = Trendline resistance (red) breakout! 🚀
Targets (If Confirmed):
50% Fib extension: 26,333 📈
61.8% Fib extension: 26,768 🎯
(Fib drawn from 3rd March 2025 swing)
Key Invalidation:
Right Shoulder Low: 24,473 (blue line). Break below = pattern failed! ⚠️
Action Plan:
Wait for weekly close ABOVE neckline breakout.
Enter longs on confirmation (targets: 26,333 → 26,768).
Stop loss: Below 24,473.
Disclaimer:
This analysis is for educational purposes only. Trade at your own risk. Past performance isn’t indicative of future results. Always conduct your own research or consult a financial advisor. 📉💰
Boost visibility: 👍 Like | 💬 Comment | 🔔 Follow
Nifty Big Gapdown expectedNifty has broken down it's crucial level with negative sentiment of market linked with tarriff war.
SL and target has been mentioned in chart.
Note: This analysis is for Educational Purpose Only. Please invest after consulting a professional financial advisor.

NIFTY MATHEMATICAL LEVELS FOR EXPIRYThese Levels are based on purely mathematical calculations.
Validity of levels are upto expiry of current week.
How to use these levels :-
* Mark these levels on your chart.
* Safe players Can use 15 min Time Frame
* Risky Traders Can use 5 min. Time Frame
* When Candle give Breakout / Breakdown to any level we have to enter with High/Low of that breaking candle.
* Targets will be another level marked on chart
* Stop Loss will be Low/High of that Breaking Candle.
* Trail your SL with every candle.
* Avoid Big Candles as SL will be high then.
* This is one of the Best Risk Reward Setup.
For Educational purpose only
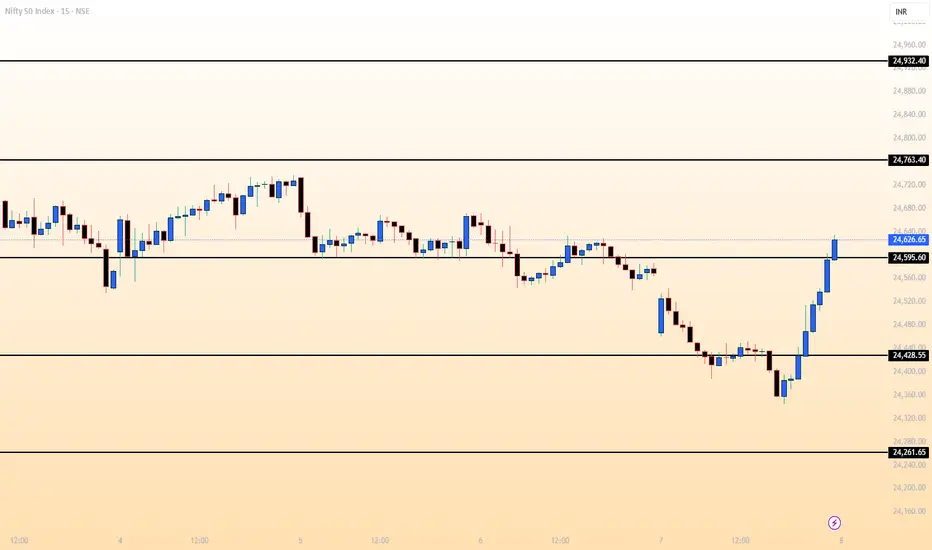
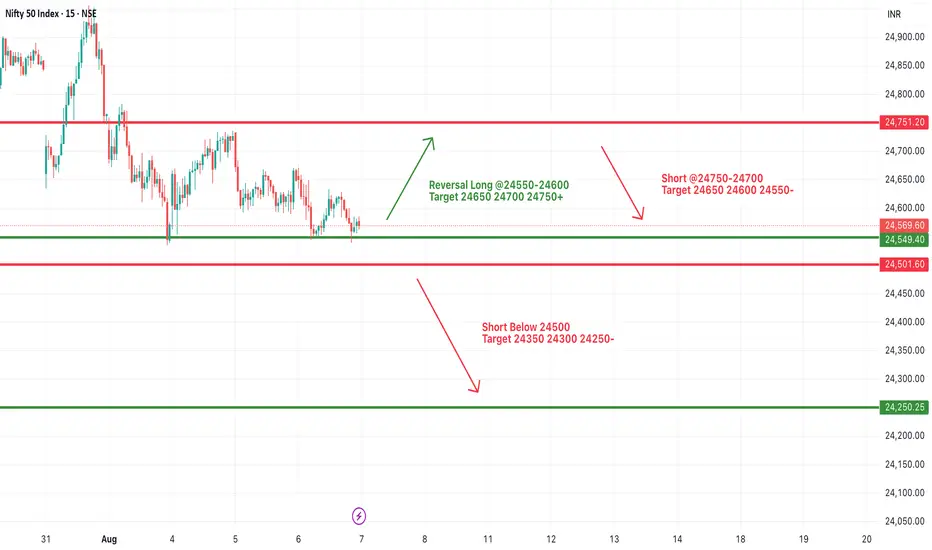
#NIFTY Intraday Support and Resistance Levels - 07/08/2025Nifty is expected to open flat near the 24,550–24,570 range, showing signs of consolidation after recent volatile moves. This zone is likely to act as a key intraday support level, and price action here will be crucial in determining further direction.
If Nifty manages to hold above the 24,550–24,600 level and shows reversal signs, a bounce back can be anticipated. In such a case, the index may move upward toward 24,650, 24,700, and eventually 24,750+. This upside move would indicate strength returning at lower support levels.
However, if Nifty fails to sustain above 24,550 and breaks below the 24,500 level, it could trigger a downward move. A short-side opportunity may emerge below 24,500, with potential targets at 24,350, 24,300, and 24,250-. On the other hand, any bounce near 24,550–24,600 could provide a reversal long setup targeting 24,650, 24,700, and 24,750+.
Expecting a nice move on Nifty weekly expiry 07/08/2025.Nifty for the last three days is forming an inside candle, chances of it moving either side is high.
If the market starts trading below 24510, it may test the pervious support around 24230 and another levels below it.
On the higher side, trade can only be initiated only once 24650 levels are taken out.
In case of a gap down wait for the retest of the support zone that will act as the resistance now. Enter trade only once the setup triggers.
Major resistance levels :- 24660, 24733
Support levels :- 24500 (psycological level), 24228
Hourly Moving averages are above the closing price while the Daily 100 EMA is around the closing leves, which can act as the support else it can come to test the 200 EMA (24200).
Wait for the price action near the levels before entering the market.
Nifty : Make or break support 24500Nifty is trading near it's crucial support 24500.
It's Very strong support level.
If this level breaks down and it sustains the day closing below this we may see further down trend.
Let's hope for the best closing for few trading sessions. Here are the levels to watch and learn.
Resistance 1 - 24700
Resistance 2- 24820
Support 1- 24500
Support - 24350
Disclaimer: The views are personal and strictly for learning purpose, we never post any trading advice.
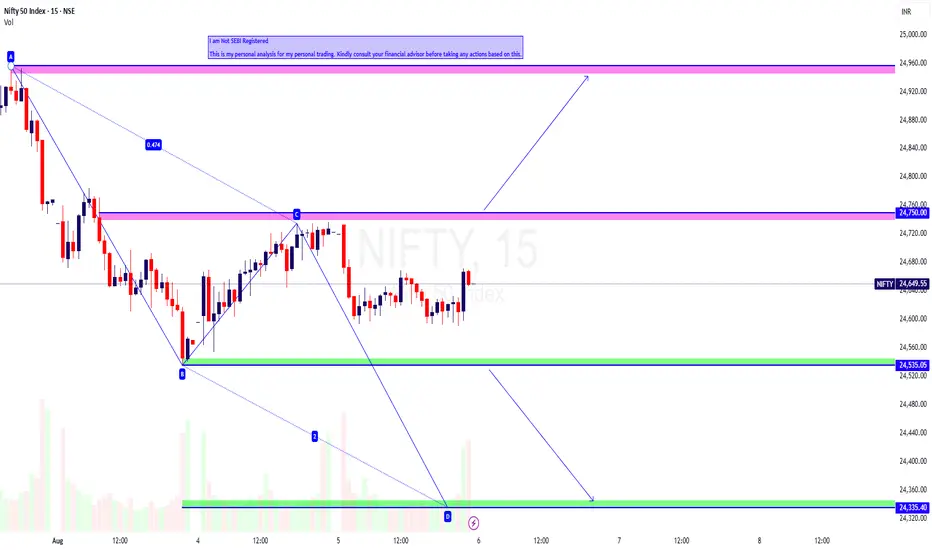
NIFTY Intraday Trade Setup 06 Aug 2025NIFTY Intraday Trade Setup 06 Aug 2025
Buy-Above 24750
Invalid-Below 24700
T- 24950
Bearish- Below 24530
Invalid-Above 24580
T- 24335
NIFTY has closed on a bearish note with 0.3% cut today. It has made 2 consecutive inside candles in daily TF. 24500 zone will be a confluence zone, due to multiple supports taken earlier. Below 24400 index can escalate, and index may start an impulsive move. On flat opening above 24750 index may give a reversal move towards 25k. Below 24530 index will be simple short towards 24335 zone as per ABCD pattern. Plan on 15 Min candle closing.
In case of a big gap up/down, wait till 10 o'clock and mark the high and low of the trading range (5MIN). Trade on this range breakout.
==========
I am Not SEBI Registered
This is my personal analysis for my personal trading. Kindly consult your financial advisor before taking any actions based on this.
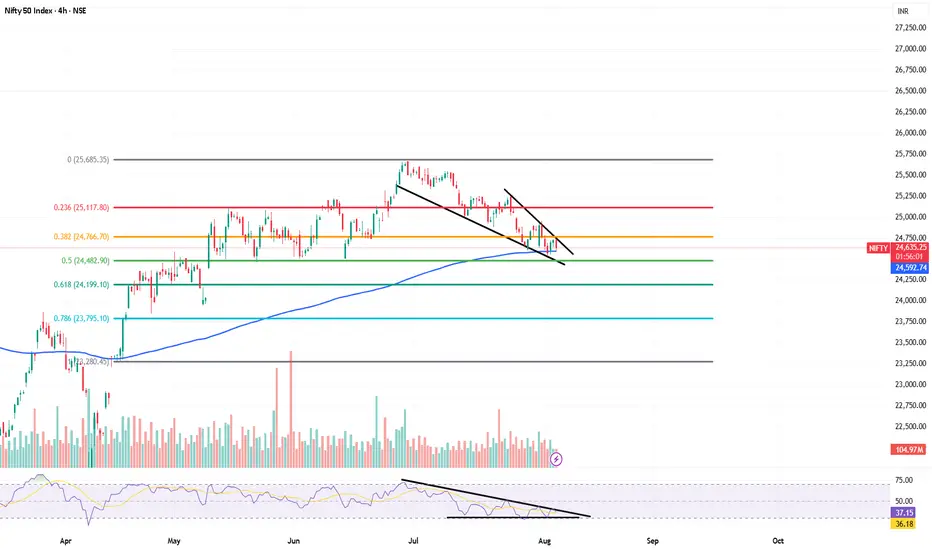
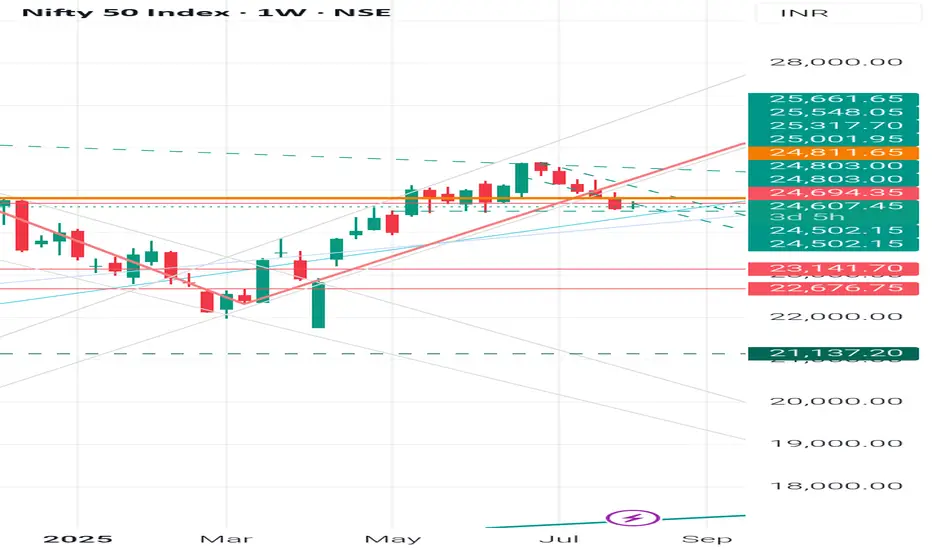
Nifty Bullish Confluence Set up ( Swing+ positional)Hello,
Nifty spot 24610 from low of 21780 made high around 25650 april to june in 2 months now Its retrace to 24600 i.e almost more than 50% retracement another is RSI squezze with bullish divergence in lowertimeframe with EMA 200 support and making pattern of falling wedge .
expecting bullish reversal set up for new lifetime high possibilties in next 2 months
Nifty: open is equal to high 5th Aug25Dear Friends, hope you are healthy and becoming wealthy 🙏
As updated in my recent Ideas on trading view,: The nifty have been making a pattern and in downtrend channel.
Today 5th August 2025: it's open = high and from the opening level it went down,
Weekly charts also shows weakness. Stay cautious while making a position.
Overall weakness can be seen at the charts-
It's major levels are:
Support 24360
Resistance 24980
👉It's only for learning purpose, before making any position please consult your investment advisor.
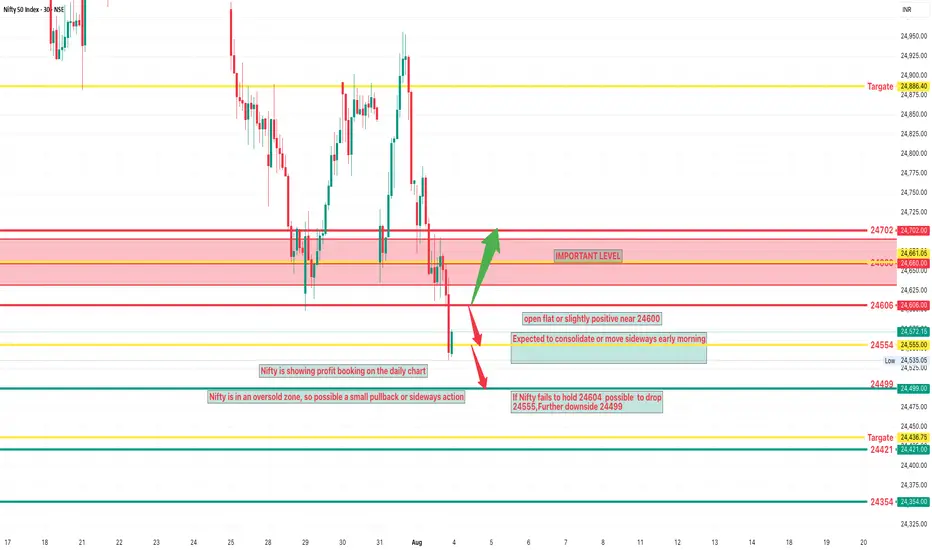
NIFTY Analysis 4 AUGUEST, 2025 ,Morning update at 9 amHowever, Nifty is in an oversold zone, so a small pullback or sideways action is likely.
Opening Expectation:
Likely to open flat or slightly positive near 24600.
Expected to consolidate or move sideways early in the day.
Bullish Scenario:
If a bb pattern forms around 24600 on the 5-min chart expect an upward move.
Potential targets: 24662 and 24702.
Bearish Scenario:
If Nifty fails to hold 24604 likely to drop:
First target: 24554
Further downside: 24499
Key Support & Resistance Levels (Unique & Precise):
Type Levels
Support 24,499 , 24421 ,24354
Resistance 24606 , 24660 , 24702
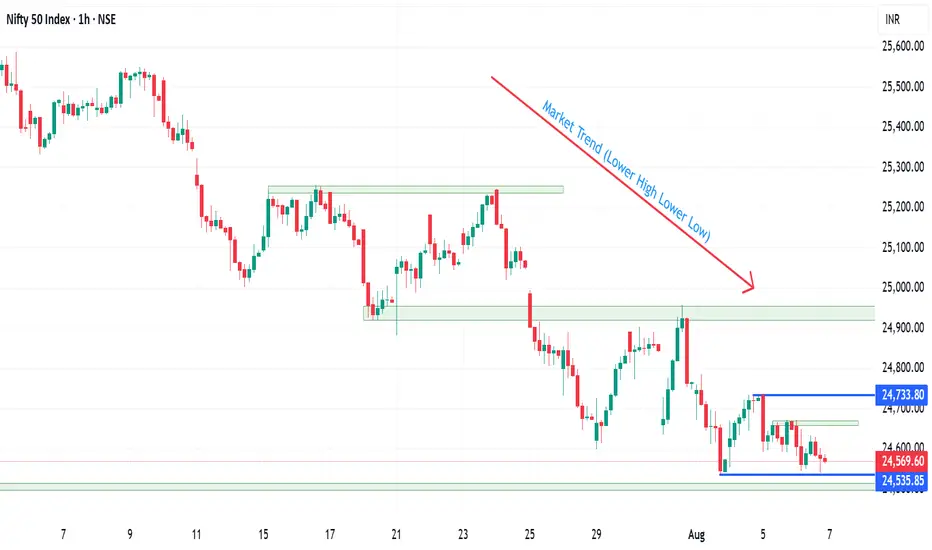
Nifty levels for next week (4th August 2025 onwards)Nifty is in a clear downtrend, important levels are marked on the chart.
A break below 24550 may bring the 24460 level and a break further may show the 24300 levels too on the chart. It may not be seen in a single day but can be visible in few trading sessions.
An up move is possible only above 24630 level that too if price sustains above this level else it may bring more selling from upper levels..
Let's see how it turns out..
01 Aug 2025 - Nifty still riding on the short wave, down 490pts Nifty Stance Bearish 🐻
Our last signal crossover was on 24th July when we went short, see the red marker. From there, Nifty has fallen 1.96% ~ 490pts and it has been on a nice downward slope.
On 31st Jul, 14.03, we were almost ready for the bullish crossover, but the 14.19 candle saved us, which drove Nifty down 41pts. In fact, Nifty fell over 165pts after the 2pm hammer candle pattern. Even though a technical analyst could take credit for the nice price predictions, most of these moves are actually due to Trump's tariffs and the failed trade deals.
Trump accusing us of buying oil from Russia is actually a "bad actor", because it could pave the way to sanctions on Indian exporters and financial transactions. Basically, the US has ended up sanctioning every country dealing with its enemies.
I wrote a detailed article on this topic three days ago, just google for "US India Trade Tariff at 25% + Penalty. Time for us to step up" to read this article.
From here, if Nifty drops to 24250 levels in the current series, it would be the best-case scenario. The challenge for that would be the rumours and gossip on the trade deal could create huge short-covering and false signals. Hope the simple EMA crossover chart pattern holds its ground.

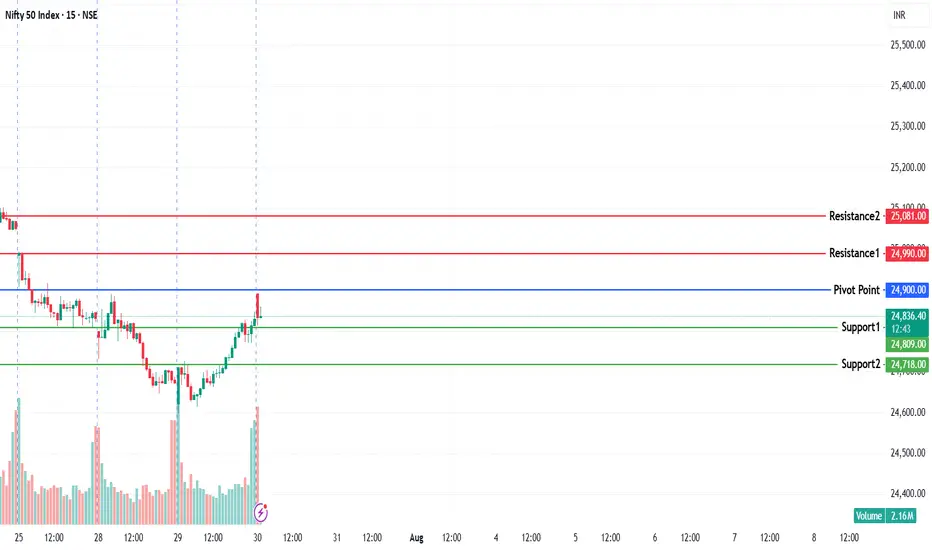
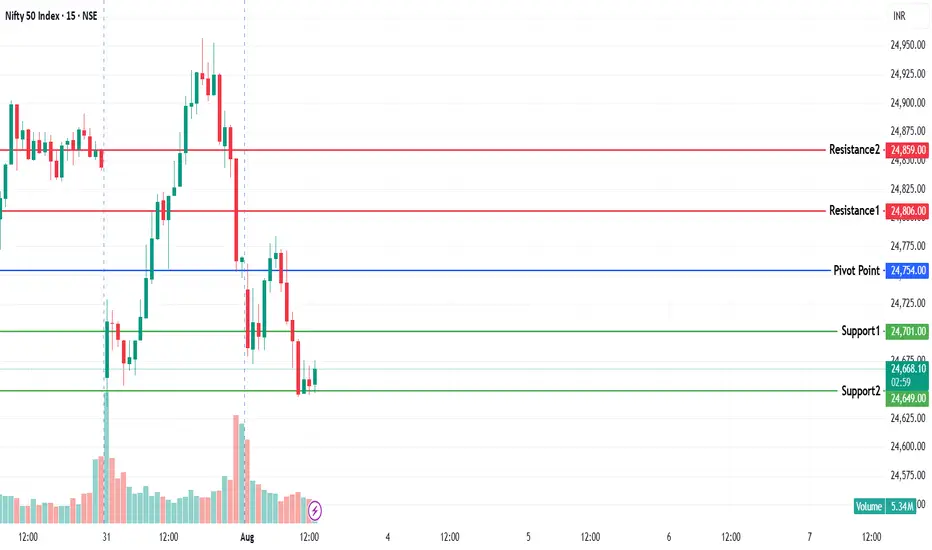
NIFTY KEY LEVELS FOR 01.08.2025NIFTY KEY LEVELS FOR 01.08.2025
If the candle stays above the pivot point, it is considered a bullish bias; if it remains below, it indicates a bearish bias. Price may reverse near Resistance 1 or Support 1. If it moves further, the next potential reversal zone is near Resistance 2 or Support 2. If these levels are also broken, we can expect the trend.
If the range(R2-S2) is narrow, the market may become volatile or trend strongly. If the range is wide, the market is more likely to remain sideways
📢 Disclaimer
I am not a SEBI-registered financial adviser.
The information, views, and ideas shared here are purely for educational and informational purposes only. They are not intended as investment advice or a recommendation to buy, sell, or hold any financial instruments.
Please consult with your SEBI-registered financial advisor before making any trading or investment decisions.
Trading and investing in the stock market involves risk, and you should do your own research and analysis. You are solely responsible for any decisions made based on this research.
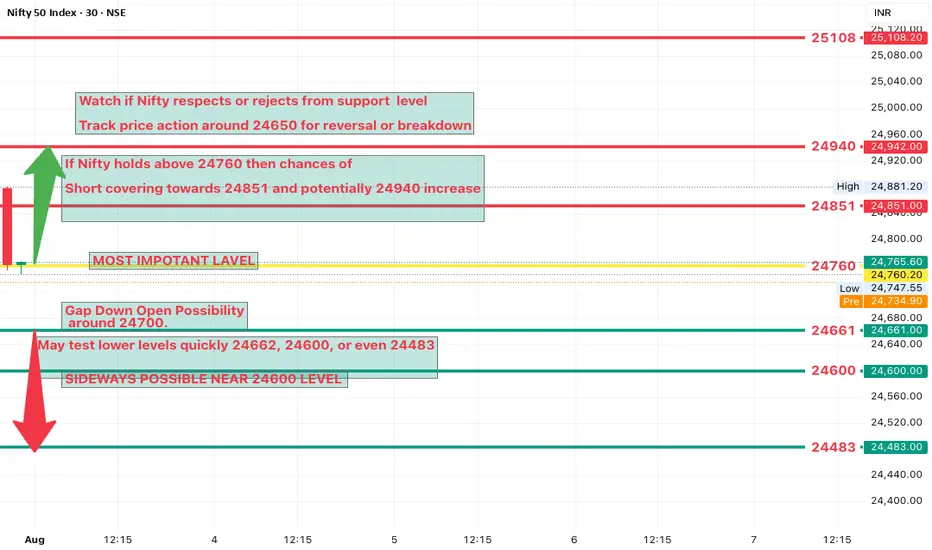
NIFTY Analysis 1 AUGUEST, 2025 ,Morning update at 9 amIF YO LIKE THESE LEVEL SAY THANK YOU
Expected Scenarios:
Gap-Down Open Possibility:
Likely around 24700.
May test lower levels quickly: 24662, 24600, or even 24483.
Bearish Setup to Watch:
On the 5-min chart, watch near 24650:
If a Bearish Bottleneck Pattern forms Nifty may slip towards:
24602, and even 24500.
Recovery Watch:
If Nifty holds above 24760 then chances of:
Short covering towards 24851 and potentially 24940 increase.
Critical Levels (Exclusive Support & Resistance):
Support 24661 , 24600 ,24483
Resistance. 24851,24940,25108
Nifty opens below 24700 Wait for 24662 or 24600 test
Bearish bottleneck at 24650 Go short for 24602 24500
Nifty holds above 24760 Look for long towards 24851 24940
Nifty reclaims 24851 with strength Possibility of rally to 25108
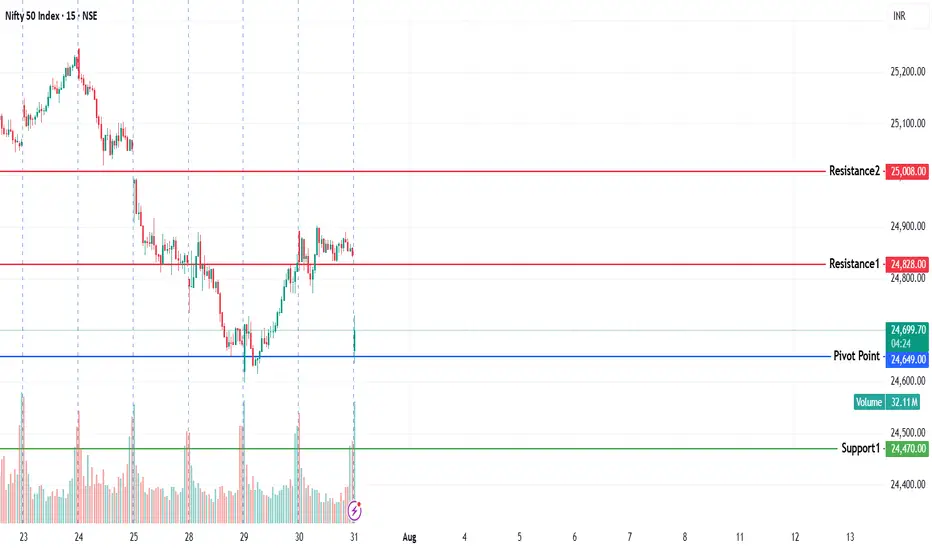
NIFTY KEY LEVELS FOR 31.07.2025NIFTY KEY LEVELS FOR 31.07.2025
If the candle stays above the pivot point, it is considered a bullish bias; if it remains below, it indicates a bearish bias. Price may reverse near Resistance 1 or Support 1. If it moves further, the next potential reversal zone is near Resistance 2 or Support 2. If these levels are also broken, we can expect the trend.
If the range(R2-S2) is narrow, the market may become volatile or trend strongly. If the range is wide, the market is more likely to remain sideways
📢 Disclaimer
I am not a SEBI-registered financial adviser.
The information, views, and ideas shared here are purely for educational and informational purposes only. They are not intended as investment advice or a recommendation to buy, sell, or hold any financial instruments.
Please consult with your SEBI-registered financial advisor before making any trading or investment decisions.
Trading and investing in the stock market involves risk, and you should do your own research and analysis. You are solely responsible for any decisions made based on this research.
NIFTY Analysis – 31 july 2025 ,Morning update at 9 amExpected Market Behavior
Nifty may open gap down near 24757
May slip towards 24620 and then 24481
Around 24620, expect sideways or consolidation
If a Bearish Bottleneck Pattern forms near 24620 (5-min chart), then Nifty may fall further toward 24450 to 24500
If Nifty sustains above 24922, it may trigger short covering toward 24995 and possibly 25097
Support
24757
24620
24481
Resistance
24922
24995
25097
Tariff news increases volatility
Causes gap-down openings or weak recovery
Top Sectors Affected by U.S. Tariffs on India
1. Pharmaceuticals
India is one of the largest exporters of generic drugs to the U.S.
Impact: U.S. tariffs can reduce competitiveness and margins
Key Stocks Affected:
Sun Pharma
Cipla
Dr. Reddy’s Labs
Lupin
Aurobindo Pharma
2. Textiles & Apparel
A large chunk of India’s textile exports (clothing, home textiles) go to the U.S.
Impact: High price due to tariffs = loss to competitors like Bangladesh, Vietnam
Key Stocks Affected:
Welspun India
Arvind
Raymond
Vardhman Textiles
KPR Mill
3. 💻 Information Technology (IT) Services
Though services usually aren’t taxed directly like goods, indirect restrictions (like visa issues or regulatory controls) can affect business.
Impact: If IT services are restricted, contract flow from U.S. reduces
Key Stocks Affected:
TCS
Infosys
Wipro
HCL Tech
Tech Mahindra
4. Steel & Metal Exports
U.S. often imposes duties on Indian steel and aluminum for protectionism.
Impact: Steel exports drop, prices fall
Key Stocks Affected:
Tata Steel
JSW Steel
Jindal Steel & Power
5. Auto Components
India exports automotive parts to U.S. automakers.
Impact: Higher cost for U.S. buyers may reduce demand
Key Stocks Affected:
Motherson Sumi
Bharat Forge
Sundaram Fasteners
6. Chemical & Specialty Chemical
India is a big player in specialty chemicals, also impacted by tariff or import restrictions.
Key Stocks Affected:
SRF
PI Industries
Aarti Industries
Navin Fluorine

Will 25 percent TARIFF put NIFTY under pressure!!??As we can see NIFTY remained sideways which was well anticipated as it is in a tight range. Now that POTUS TRUMP has announced 25 percent tariff with penalty that will be effective from AUG 1 can put NIFTY under pressure as much like CHINA's delay of tariff implementation, it was anticipated that INDIA's tariff might be delayed but its implemetation can create havoc in the market and that very havoc can give buying opportunity to many. IF NIFTY opens very weak, it is likely that it would start recovering from important demand zones. It would be better to stay away and watch market for tomorrow as it can decide further move so keep watching cautiously.

Nifty 50 Analysis and Market AnalysisIn this video, we have discussed -
What is the current structure of Nifty 50?
Smaller swing formations can lead to smaller correction.
Significance of current candles.
If the market continues to fall, then we can get Dow top.
People should not jump into trading just by seeing the green candles.

NIFTY KEY LEVELS FOR 30.07.2025NIFTY KEY LEVELS FOR 30.07.2025
If the candle stays above the pivot point, it is considered a bullish bias; if it remains below, it indicates a bearish bias. Price may reverse near Resistance 1 or Support 1. If it moves further, the next potential reversal zone is near Resistance 2 or Support 2. If these levels are also broken, we can expect the trend.
If the range(R2-S2) is narrow, the market may become volatile or trend strongly. If the range is wide, the market is more likely to remain sideways
📢 Disclaimer
I am not a SEBI-registered financial adviser.
The information, views, and ideas shared here are purely for educational and informational purposes only. They are not intended as investment advice or a recommendation to buy, sell, or hold any financial instruments.
Please consult with your SEBI-registered financial advisor before making any trading or investment decisions.
Trading and investing in the stock market involves risk, and you should do your own research and analysis. You are solely responsible for any decisions made based on this research.