#NIFTY Intraday Support and Resistance Levels - 30/07/2025After a strong recovery from recent lows, Nifty is expected to open flat today and may continue its upward momentum if key resistance levels are breached. The index is currently hovering near the upper end of its reversal zone.
Upside Levels:
A breakout above 25,000 could trigger bullish continuation.
If sustained, we can expect targets at 25,150, 25,200, and 25,250+.
This level is crucial for short-term trend reversal confirmation.
Reversal Buy Opportunity:
If Nifty takes support around 24,750–24,800, a reversal long can be initiated.
Expected targets for this setup: 24,850, 24,900, 24,950+.
Keep strict trailing stop loss as volatility may increase near upper resistance zones.
Reversal Short Setup:
If price fails to sustain above 24,900–24,950, a short opportunity may arise.
Expected downside targets: 24,850, 24,800, 24,750-.
This zone may act as a reversal point for sellers.
Breakdown Short Setup:
If Nifty breaks below 24,700, a strong downside move may begin.
In that case, expect targets at 24,600, 24,550, and 24,500-.
Summary:
Today’s session could turn directional after consolidation around key levels. Wait for confirmation near reversal zones before entering trades. Follow partial profit booking and trailing stop loss for intraday trades.
Niftylevels

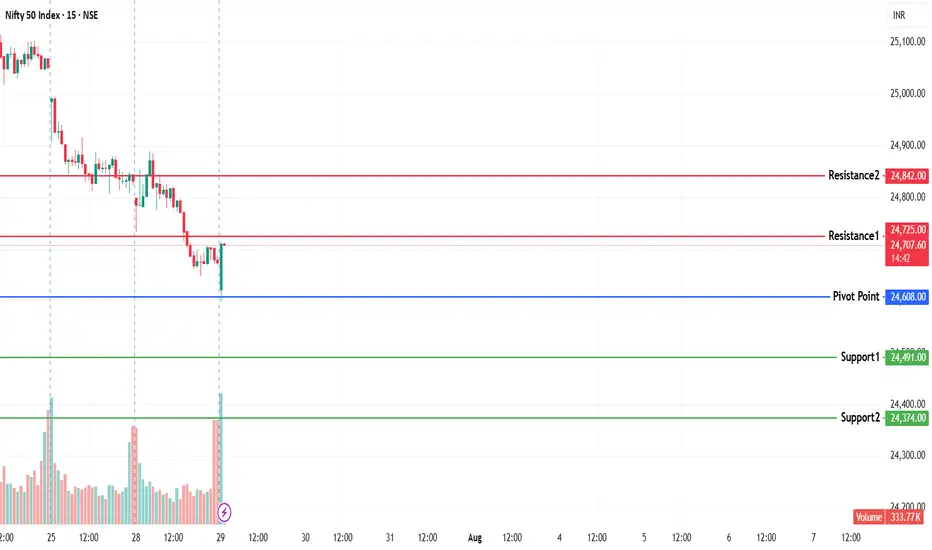
NIFTY KEY LEVELS FOR 29.07.2025NIFTY KEY LEVELS FOR 29.07.2025
If the candle stays above the pivot point, it is considered a bullish bias; if it remains below, it indicates a bearish bias. Price may reverse near Resistance 1 or Support 1. If it moves further, the next potential reversal zone is near Resistance 2 or Support 2. If these levels are also broken, we can expect the trend.
If the range(R2-S2) is narrow, the market may become volatile or trend strongly. If the range is wide, the market is more likely to remain sideways
📢 Disclaimer
I am not a SEBI-registered financial adviser.
The information, views, and ideas shared here are purely for educational and informational purposes only. They are not intended as investment advice or a recommendation to buy, sell, or hold any financial instruments.
Please consult with your SEBI-registered financial advisor before making any trading or investment decisions.
Trading and investing in the stock market involves risk, and you should do your own research and analysis. You are solely responsible for any decisions made based on this research.
Nifty analysisOnly for learning purpose:
Nifty is facing an immediate resistance near 24815
If it is broken then next resistance will be: 24990, 25250
Whether support is near 24475 we may see it on the daily charts.
NIFTY KEY LEVELS FOR 28.07.2025NIFTY KEY LEVELS FOR 28.07.2025
If the candle stays above the pivot point, it is considered a bullish bias; if it remains below, it indicates a bearish bias. Price may reverse near Resistance 1 or Support 1. If it moves further, the next potential reversal zone is near Resistance 2 or Support 2. If these levels are also broken, we can expect the trend.
If the range is narrow, the market may become volatile or trend strongly. If the range is wide, the market is more likely to remain sideways
📢 Disclaimer
I am not a SEBI-registered financial adviser.
The information, views, and ideas shared here are purely for educational and informational purposes only. They are not intended as investment advice or a recommendation to buy, sell, or hold any financial instruments.
Please consult with your SEBI-registered financial advisor before making any trading or investment decisions.
Trading and investing in the stock market involves risk, and you should do your own research and analysis. You are solely responsible for any decisions made based on this research.

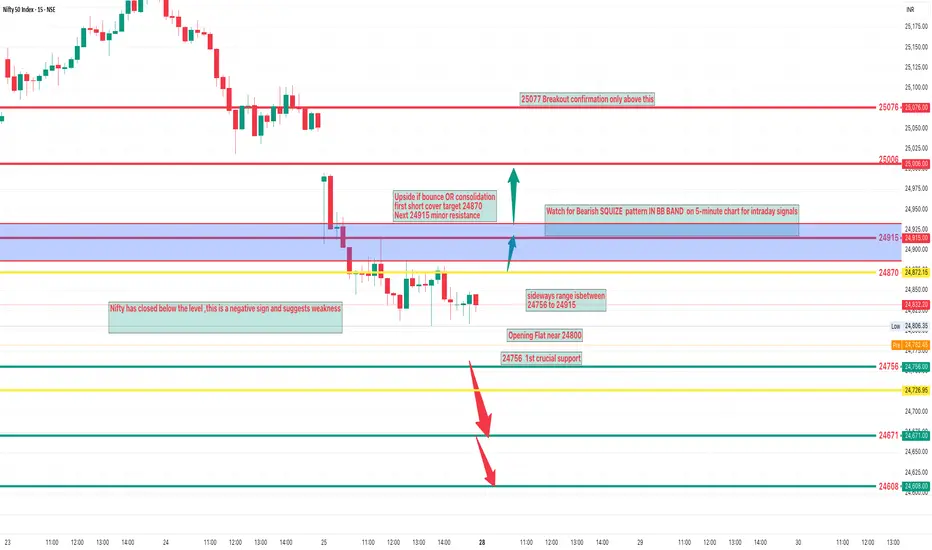
NIFTY Analysis – 28 july 2025 ,Morning update at 9 amExpected Opening & Movement Zones
Likely Opening Flat near 24800.
Immediate Downside Target (if weak)
First: 24756 important support.
Then: 246721– next support.
Upside if bounce or consolidation
First short-cover target: 24870.
Next: 24915 – minor resistance.
24756,Near today's flat open 1st crucial support
24671 If bottleneck confirmed –test this zone
24608 Extended weakness zone
Resistance Levels
24915 Short covering resistance
25,006 Important psychological and swing resistance
25076 Breakout confirmation only above this
the sideways range is likely between
24756 to 24915
Nifty may consolidate in this zone before giving any big move.
NIFTY Intraday Trade Setup For 28 Jul 2025NIFTY Intraday Trade Setup For 28 Jul 2025
Sell_1- From 24990
Invalid-Above 25040
T- 24800
Bearish-Below 24800
Invalid-Above 24850
T- 24620
NIFTY has closed on a bearish note, ended near lowest point of the week. Index has closed below 50 and 21 EMA both. Its sell on rise market till it is below 50 EMA. Support lies near 24150, 24450 will be a confluence zone in between. Following the sell on rise approach, On Monday 25k zone will be a resistance area to plan a short. On flat opening, below 24800 will be a simple short planning towards 24600 zone.
In case of a big gap up/down, wait till 10 o'clock and mark the high and low of the trading range (5MIN). Trade on this range breakout.
==========
I am Not SEBI Registered
This is my personal analysis for my personal trading. Kindly consult your financial advisor before taking any actions based on this.

Zero-Day Options (0DTE)🔍 What Are Zero-Day Options (0DTE)?
The term “0DTE” stands for Zero Days to Expiration. These are options contracts that expire on the same day you buy or sell them.
In simple words, if today is Thursday and you’re trading a weekly Nifty or BankNifty option that expires today — you're trading a 0DTE option.
This type of option:
Has no time left beyond today.
Is highly sensitive to price movement.
Is extremely risky and extremely rewarding.
Earlier, we only had Thursday expiry for weekly options. But now, due to growing popularity, exchanges have introduced:
Nifty 50 expiry: Monday to Friday (Daily)
Bank Nifty expiry: Tuesdays and Thursdays
Fin Nifty expiry: Tuesdays
Sensex expiry: Fridays
This means 0DTE trading can now happen almost every day!
📈 Why 0DTE Trading Has Become So Popular
Zero-Day Options are now one of the most actively traded instruments — both by retail and institutional traders. Here’s why:
1. Small Premiums, Big Potential
Since the option expires today, its price (premium) is very low — sometimes just ₹5 or ₹10. If the market moves in your favor, that ₹10 option can quickly become ₹50 or ₹100.
That’s a 5x to 10x return, sometimes in just 15-30 minutes.
2. No Overnight Risk
You’re in and out the same day. No gap-ups, no global tension ruining your position overnight.
3. Scalping Friendly
Perfect for intraday traders who don’t want to hold positions for long.
4. Lots of Movement Near Expiry
Prices jump fast because time is running out. This gives more opportunities — but also more chances to get trapped.
5. Better Tools & Platforms
With modern brokers offering real-time data, scalping tools, and fast execution — more traders are trying 0DTE.
💼 How Do 0DTE Options Work?
Let’s take a simple example:
Today is Thursday, and Nifty is trading around 22,000.
You think it will rise, so you buy a 22,100 Call Option (CE) at 11 AM for ₹15.
If Nifty rises 50 points in the next 30 minutes, your option may become ₹45.
That’s 200% return.
But… if Nifty remains flat or falls, your option may go to ₹0 by the end of the day.
What Makes Them Move So Fast?
There are 3 reasons:
Time Decay (Theta): Since it's the last day, every minute that passes reduces the option's value if there's no movement.
Volatility: Even small market moves can cause big percentage changes in premium.
Greeks Sensitivity: Delta, Gamma, and Vega — all move faster near expiry.
🔁 Most Common 0DTE Strategies
1. Directional Option Buying
Buy a Call or Put based on price action.
Works best when there's momentum or breakout.
Example: Buy 22,100 CE at ₹10 → Nifty moves up → Exit at ₹50.
👍 High reward
👎 High risk (can go to zero)
2. Straddle/Strangle Selling (Non-Directional)
Sell both Call and Put at the same or nearby strikes.
You win if the market stays in range.
Example: Sell 22,000 CE and 22,000 PE → Market closes at 22,000 → Both go to zero.
👍 Profit from time decay
👎 If market breaks out in any direction, huge loss
3. Iron Condor
Sell OTM Call and Put spreads to capture decay in a defined range.
Lower risk, but also lower return.
👍 Safer than naked straddle
👎 Limited reward
4. Scalping with 1-2 Candle Momentum
Monitor breakouts on 1-min or 3-min chart.
Take quick entries and exits with small quantities.
👍 Quick gains
👎 Requires sharp execution and discipline
🏦 Who Uses 0DTE — Institutions or Retail?
🔹 Institutions:
Use algos to sell options in range.
Make profit from premium decay.
Use 0DTE to hedge portfolios or capture intraday IV changes.
🔹 Retail Traders:
Use for quick profits or gambling.
Often go for cheap out-of-the-money options.
Tend to overtrade without understanding risk.
⚠️ Risks Involved in 0DTE Trading
Let’s be honest — 0DTE options are not safe for everyone.
Here are the major dangers:
1. Time Decay (Theta Burn)
Every minute, the option loses value unless the market moves.
2. Fast Premium Erosion
Flat markets = quick loss. A ₹10 option can go to ₹0 in 15 minutes.
3. No Margin for Error
You need to be right on direction, timing, AND speed. All three.
4. Emotional Stress
Prices jump fast. Without discipline, you’ll end up revenge trading.
5. Overtrading
Traders often re-enter after loss without a plan — increasing risk.
🎯 Real-World Example of a 0DTE Trade
Let’s say it's Tuesday, and you’re trading BankNifty (expires today).
10:00 AM: BankNifty at 47,200
You buy 47,300 CE at ₹12
10:30 AM: BankNifty jumps 80 points
Your CE becomes ₹42
You exit — 250% return
But…
If BankNifty remained flat or dropped, that ₹12 option may go to ₹3 or even ₹0.
Same day. Same strike. Two opposite outcomes.
💡 Tips for Beginners to Trade 0DTE Safely
Start with Small Capital
Never risk your full capital on one trade.
Set Hard Stop-Loss
Exit if your option loses 40-50%. No second thoughts.
Trade in Breakout Zones
Avoid choppy ranges — they kill premiums.
Watch Open Interest + Price Action
See where the buyers/sellers are active.
Trade First Hour or Last Hour
That’s when you get big movements and clear setups.
Avoid Trading Just for Fun
0DTE is not for boredom. It’s for precision and skill.
Do Not Hold Till 3:30 PM
If you’re an option buyer, premiums usually die in the last 15 minutes.
🧠 Should You Trade 0DTE Options?
✅ YES — if:
You have solid technical analysis
You understand risk management
You can stick to a strict plan
You are okay with losing 100% on a bad trade
❌ NO — if:
You are emotionally reactive
You don’t track charts closely
You trade with borrowed or large capital
You don’t know how option Greeks work
🏁 Final Words
Zero-Day Options are not just another strategy. They are a whole new mindset of trading.
If used with the right knowledge, strict rules, and patience, they can become a powerful weapon in your trading toolbox. But if misused, they are the fastest way to drain your account.
Respect the instrument. Learn the rules. Start small. Scale with confidence.
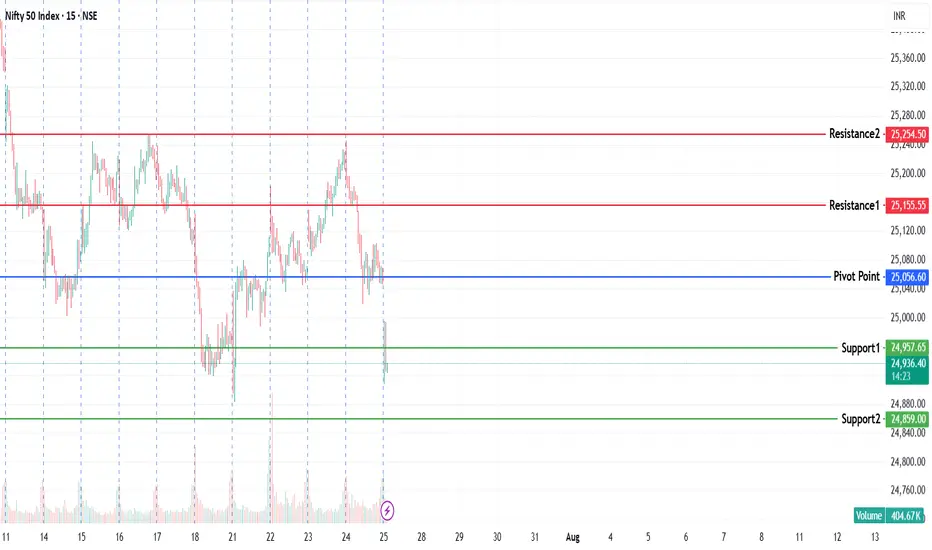
NIFTY KEY LEVELS FOR 25.07.2025NIFTY KEY LEVELS FOR 25.07.2025
If the candle stays above the pivot point, it is considered a bullish bias; if it remains below, it indicates a bearish bias. Price may reverse near Resistance 1 or Support 1. If it moves further, the next potential reversal zone is near Resistance 2 or Support 2. If these levels are also broken, we can expect the trend.
If the range is narrow, the market may become volatile or trend strongly. If the range is wide, the market is more likely to remain sideways
📢 Disclaimer
I am not a SEBI-registered financial adviser.
The information, views, and ideas shared here are purely for educational and informational purposes only. They are not intended as investment advice or a recommendation to buy, sell, or hold any financial instruments.
Please consult with your SEBI-registered financial advisor before making any trading or investment decisions.
Trading and investing in the stock market involves risk, and you should do your own research and analysis. You are solely responsible for any decisions made based on this research.
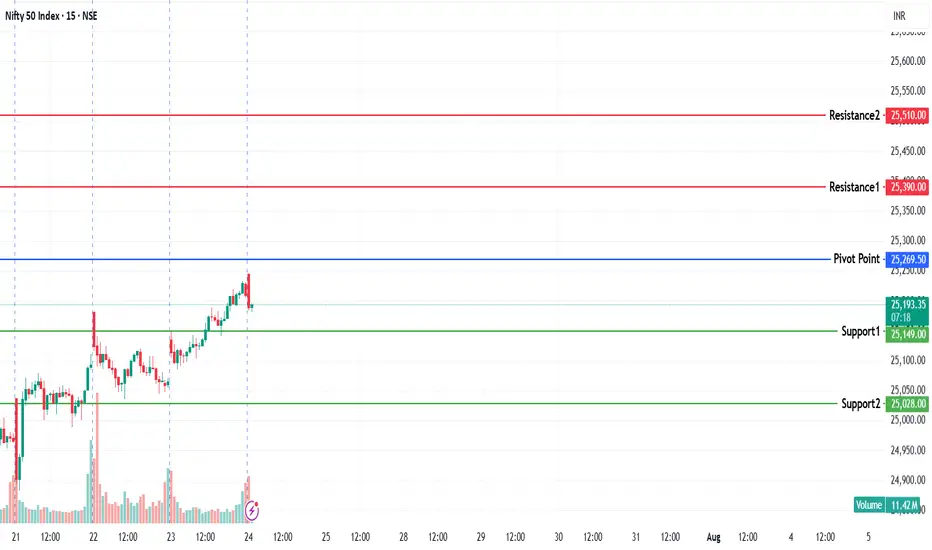
NIFTY KEY LEVELS FOR 24.07.2025NIFTY KEY LEVELS FOR 24.07.2025
If the candle stays above the pivot point, it is considered a bullish bias; if it remains below, it indicates a bearish bias. Price may reverse near Resistance 1 or Support 1. If it moves further, the next potential reversal zone is near Resistance 2 or Support 2. If these levels are also broken, we can expect the trend.
If the range is narrow, the market may become volatile or trend strongly. If the range is wide, the market is more likely to remain sideways
📢 Disclaimer
I am not a SEBI-registered financial adviser.
The information, views, and ideas shared here are purely for educational and informational purposes only. They are not intended as investment advice or a recommendation to buy, sell, or hold any financial instruments.
Please consult with your SEBI-registered financial advisor before making any trading or investment decisions.
Trading and investing in the stock market involves risk, and you should do your own research and analysis. You are solely responsible for any decisions made based on this research.
niftyin nifty tomorrow may be gap up and sideways. we can see a doji candle tomorrow. be cautious on upside.may be a we see reversal from friday.
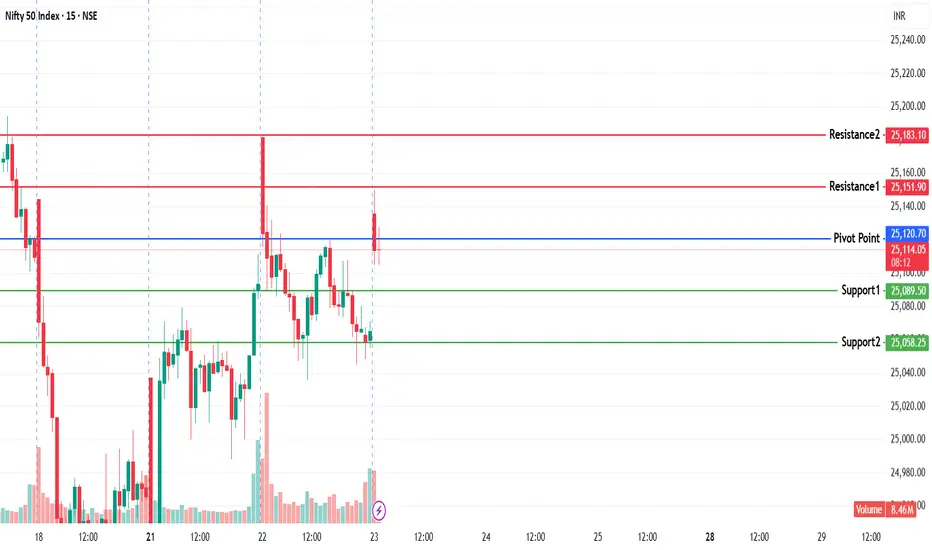
NIFTY KEY LEVELS FOR 23.07.2025NIFTY KEY LEVELS FOR 23.07.2025
If the candle stays above the pivot point, it is considered a bullish bias; if it remains below, it indicates a bearish bias. Price may reverse near Resistance 1 or Support 1. If it moves further, the next potential reversal zone is near Resistance 2 or Support 2. If these levels are also broken, we can expect the trend.
If the range is narrow, the market may become volatile or trend strongly. If the range is wide, the market is more likely to remain sideways
📢 Disclaimer
I am not a SEBI-registered financial adviser.
The information, views, and ideas shared here are purely for educational and informational purposes only. They are not intended as investment advice or a recommendation to buy, sell, or hold any financial instruments.
Please consult with your SEBI-registered financial advisor before making any trading or investment decisions.
Trading and investing in the stock market involves risk, and you should do your own research and analysis. You are solely responsible for any decisions made based on this research.
nifty1. if nifty touch raising channel resistance tomorrow then pattern will change then nifty is sideways to bullish in short-term .
2. if nifty touch resistance on 23 july then only we get perfect entry for short.
note: on 23 july we can see doji candle in daily .if not then wait.
tomorrow nifty is bullish. any day we see a doji candle above 25300. then we can sell on next day or on the same day after 3pm.
if you want to short on top then keep eye on 23 july. on 23 if touch rising channel resistance then we can short.
but,
on 23 nifty is sideways and form a doji candle in daily basis.

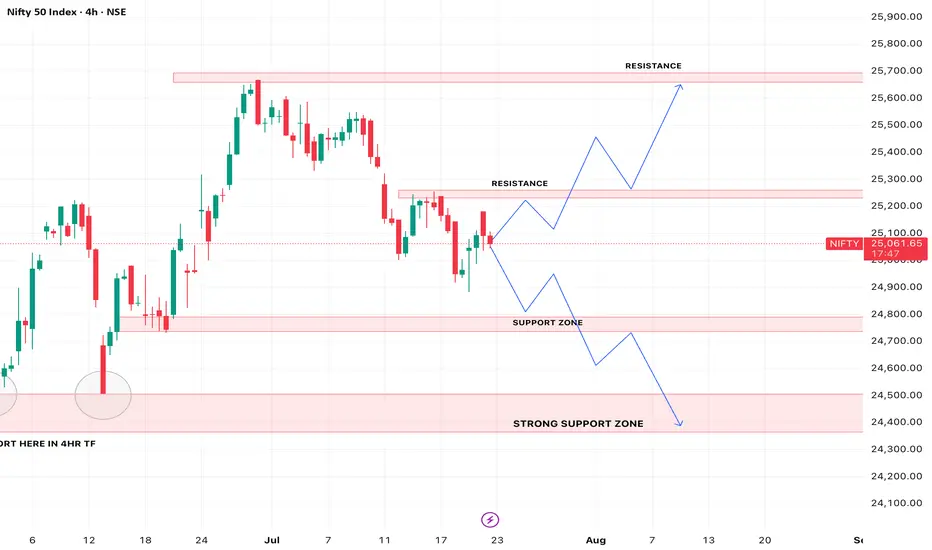
NIfty50 analysis for 23/07/2025nifty has been in a bearish trend over the past week and recently faced a strong rejection from the 25180–25200 zone, which aligns with a key resistance level on the daily time frame. price action suggests a possible retracement toward the 24780–24800 support zone. this area holds significance as a potential demand zone. it’s crucial to observe price behavior around this level — a strong reaction here could offer clues for the next directional move. wait for confirmation before taking any fresh positions.
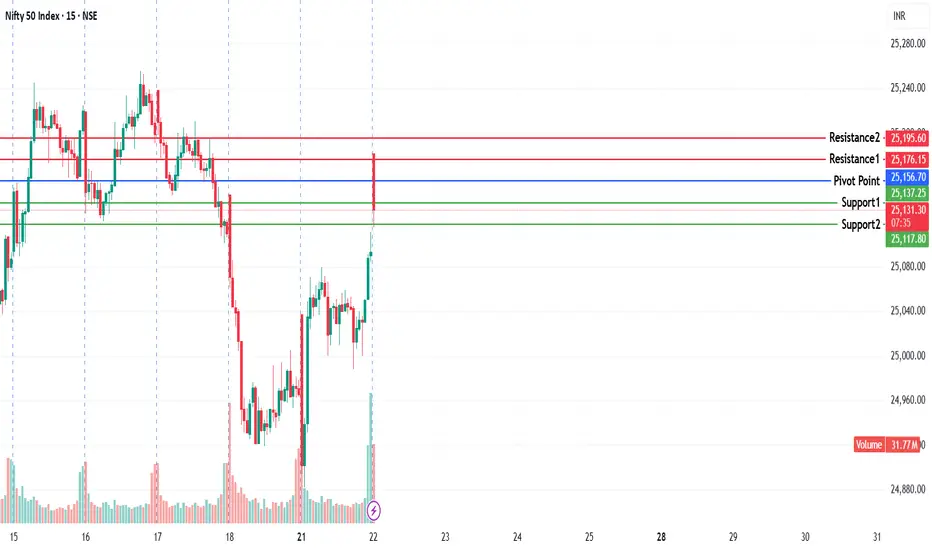
NIFTY KEY LEVELS FOR 22.07.2025NIFTY KEY LEVELS FOR 22.07.2025
If the candle stays above the pivot point, it is considered a bullish bias; if it remains below, it indicates a bearish bias. Price may reverse near Resistance 1 or Support 1. If it moves further, the next potential reversal zone is near Resistance 2 or Support 2. If these levels are also broken, we can expect the trend.
If the range is narrow, the market may become volatile or trend strongly. If the range is wide, the market is more likely to remain sideways
📢 Disclaimer
I am not a SEBI-registered financial adviser.
The information, views, and ideas shared here are purely for educational and informational purposes only. They are not intended as investment advice or a recommendation to buy, sell, or hold any financial instruments.
Please consult with your SEBI-registered financial advisor before making any trading or investment decisions.
Trading and investing in the stock market involves risk, and you should do your own research and analysis. You are solely responsible for any decisions made based on this research.
NIFTY Analysis – 22 july 2025 ,morning update at 9 amMarket Status
Nifty closed below 22%
But short covering is strong, so market may open higher.
Expected Movement:
Market may open near 25150.
If it holds 25150 and forms a bottleneck pattern, it may move up:
First Target 25218
If breakout happens 25298
Situation
Nifty holds 25150 THEN Buy above 25218 for 25298
Nifty breaks below 25150 THEN Sell for target 25013, 24896
Price goes sideways THEN Wait and trade only after breakout
Sideways (Consolidation) Zone:
Sideways Zone ---- Between 25013 and 25218
Because
25013 is strong support (buyers defend here)
25218 is strong resistance (sellers may come in)
Price may move up and down within this range before breakout OR breakdown

NIFTY KEY LEVELS FOR 21.07.2025NIFTY KEY LEVELS FOR 21.07.2025
If the candle stays above the pivot point, it is considered a bullish bias; if it remains below, it indicates a bearish bias. Price may reverse near Resistance 1 or Support 1. If it moves further, the next potential reversal zone is near Resistance 2 or Support 2. If these levels are also broken, we can expect the trend.
If the range is narrow, the market may become volatile or trend strongly. If the range is wide, the market is more likely to remain sideways
📢 Disclaimer
I am not a SEBI-registered financial adviser.
The information, views, and ideas shared here are purely for educational and informational purposes only. They are not intended as investment advice or a recommendation to buy, sell, or hold any financial instruments.
Please consult with your SEBI-registered financial advisor before making any trading or investment decisions.
Trading and investing in the stock market involves risk, and you should do your own research and analysis. You are solely responsible for any decisions made based on this research.

NIFTY Intraday Trade Setup For 21 Jul 2025NIFTY Intraday Trade Setup For 21 Jul 2025
Bullish-Above 25015
Invalid-Below 24965
T- 25150
Bearish-Below 24910
Invalid-Above 24960
T- 24640
NIFTY has closed on a slight bearish note with 0.72% cut last week. Index has reached 50 EMA in daily TF which is placed near 24900. A bounce from EMA can be expected. However below 24900 index may dive in the next week also. On a flat opening above 25015 a bullish move towards 25150 can be expected. Intraday resistance is placed at the 25150 as per half bat pattern. On a flat opening below 24910 index will test 24640. Plan trades on 15 Min candle close.
In case of a big gap up/down, wait till 10 o'clock and mark the high and low of the trading range (5MIN). Trade on this range breakout.
==========
I am Not SEBI Registered
This is my personal analysis for my personal trading. Kindly consult your financial advisor before taking any actions based on this.

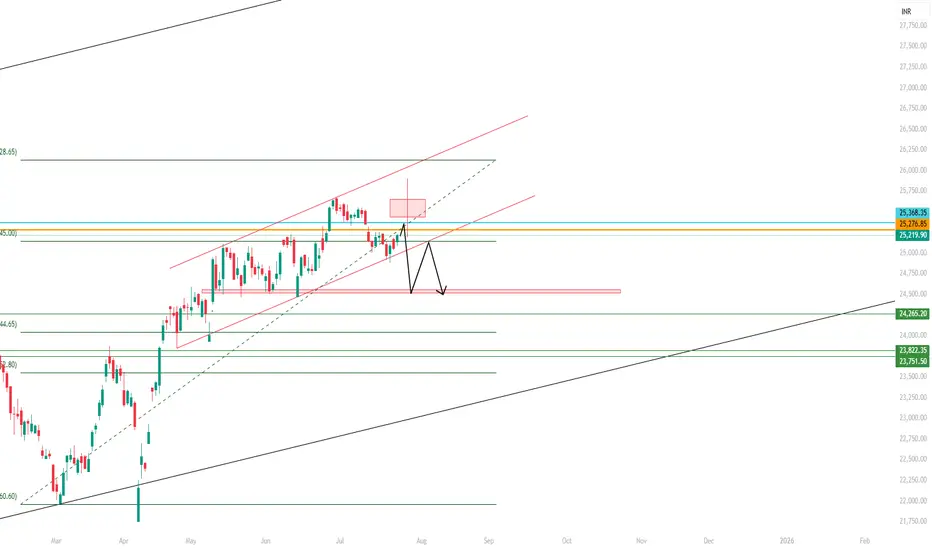
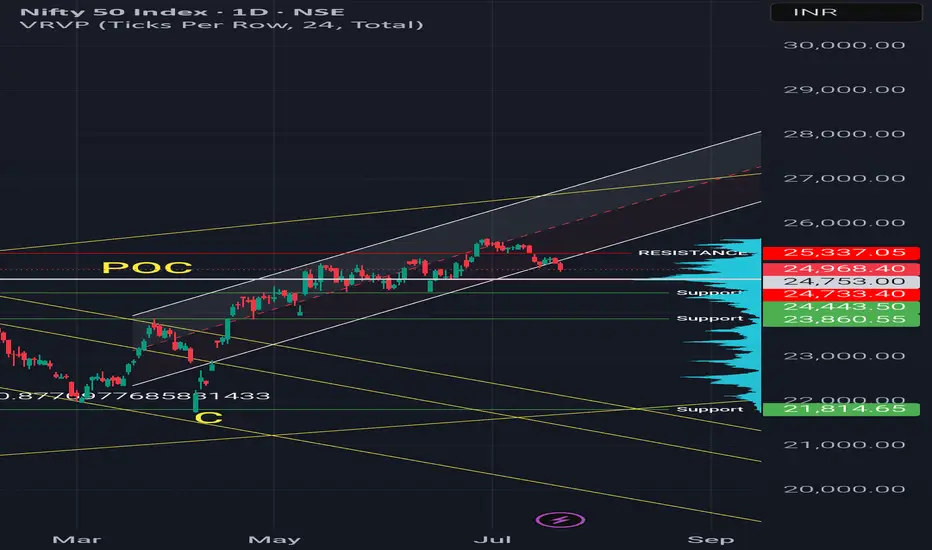
Regression channel breakout - Short term Shift1. Price is out of regression channel — signaling short-term weakness.
2. POC around 24,750 — That is most traded level.
Option Chain Data:
Call writing at 25,300 & 25,500 — clear resistance
But
Yesterday we got positive earnings of ICICI & HDFC Bank.
There is a expectation of pullback as long as nifty is above 24450, long term view is positive
niftynifty on 2 support zone rising channel and fibbo 60%. nifty may be reverse from here upto 25400. may be on august 1 week. we see nifty 24550-24500 level.

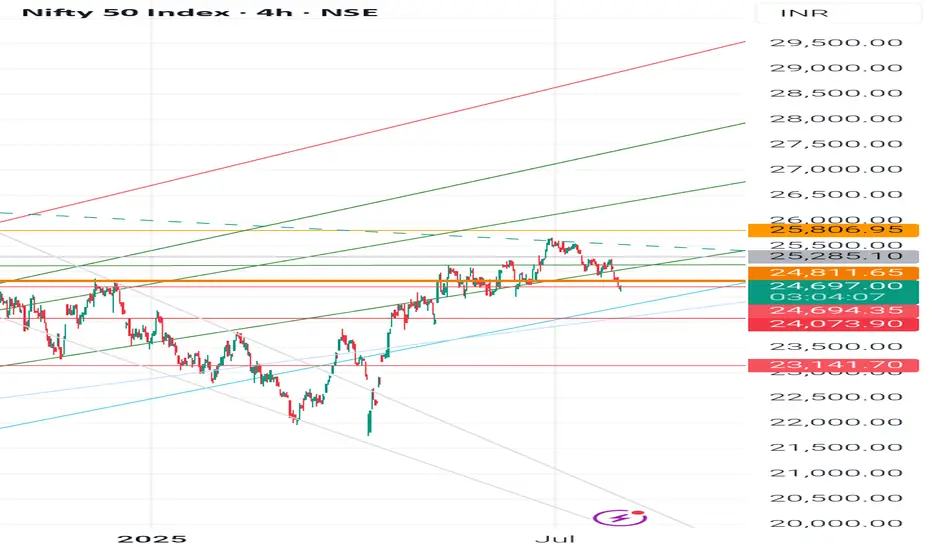
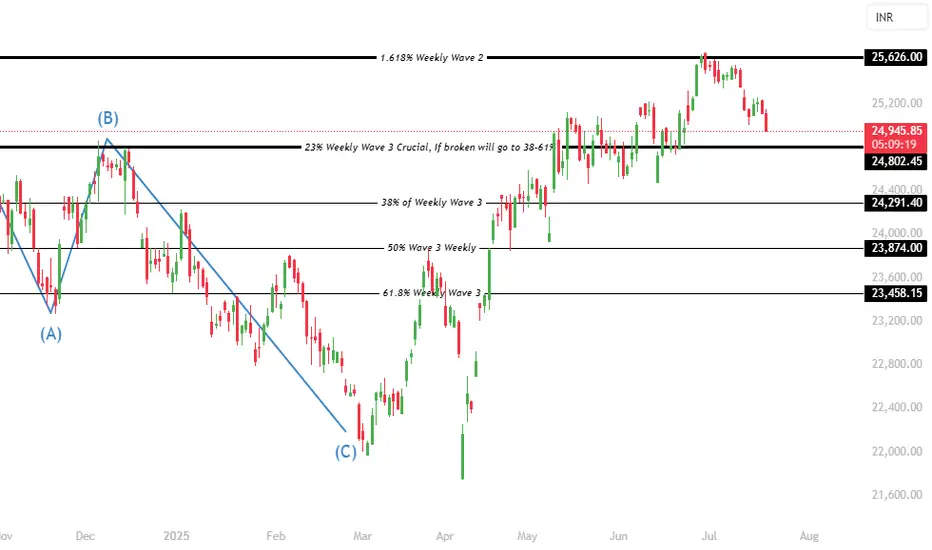
Nifty 50 Trend Analysis A detailed wave analysis in larger times frames indicates that nifty is beginning to trigger a sharp or moderate momentum deep correction. The correction & downtrend can last upto 23874 & 23458 potentially. In a downtrend, institutions will sell on every rise, hence its not the right time to make new investments directly in the stocks. Currently nifty is trading at 25073 and this swing momentum can go upto 24802 without reversals, and 24802 will play a crucial role but since the wave 3 has completed its maximum levels we need to brace for 23874 & 23458.
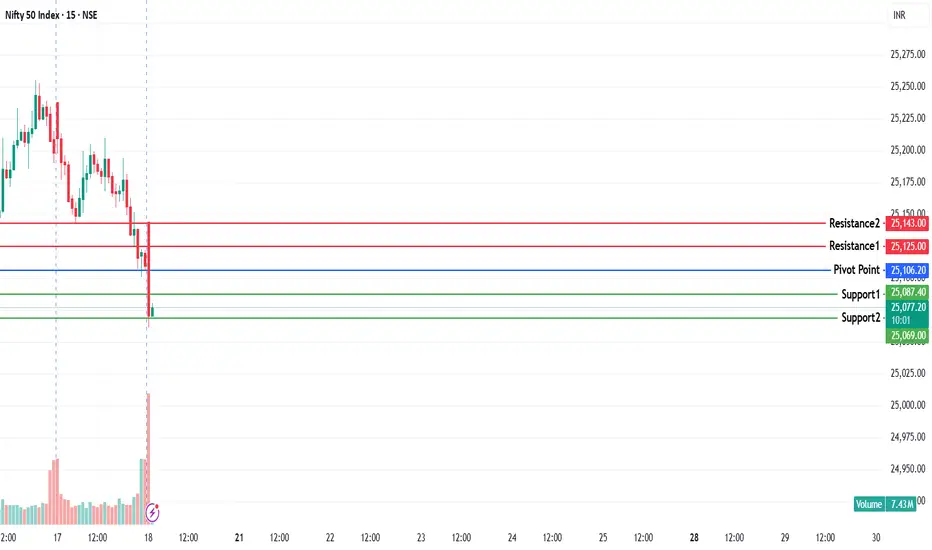
NIFTY KEY LEVELS FOR 18.07.2025NIFTY KEY LEVELS FOR 18.07.2025
If the candle stays above the pivot point, it is considered a bullish bias; if it remains below, it indicates a bearish bias. Price may reverse near Resistance 1 or Support 1. If it moves further, the next potential reversal zone is near Resistance 2 or Support 2. If these levels are also broken, we can expect the trend.
If the range is narrow, the market may become volatile or trend strongly. If the range is wide, the market is more likely to remain sideways
📢 Disclaimer
I am not a SEBI-registered financial adviser.
The information, views, and ideas shared here are purely for educational and informational purposes only. They are not intended as investment advice or a recommendation to buy, sell, or hold any financial instruments.
Please consult with your SEBI-registered financial advisor before making any trading or investment decisions.
Trading and investing in the stock market involves risk, and you should do your own research and analysis. You are solely responsible for any decisions made based on this research.
NIFTY Analysis – 18 july 2025 ,morning update at 9 amTechnical Summary
Daily Candle:
Nifty formed a negative candle after a Doji, indicating potential weakness or indecision turning bearish.
which is a sign of weakness.
Expected Opening:
May open flat near 25143 (critical level).
Upside move possible to 25218, but likely to consolidate.
Key Observation:
If Nifty fails to sustain above 25143, downside possible towards:
25023 (1st support)
24931 (2nd support)
Strategy Advice:
Wait for a clear pattern formation.
Use BOD (Buy on Dip) or SOR (Sell on Rise) strategy.
Scalping preferred due to expected sideways move.
oday's market likely to be range-bound to weak unless strong buying comes above 25143.
Avoid aggressive trades early. Watch for confirmation.
Scalping with tight SL or quick exits is preferred.
What is Sideways or Consolidation?
Sideways market = Price moves between a narrow range without clear direction.
Consolidation = Market takes a pause after a trend (up or down) and moves within a range before the next breakout.
Today's Expected Sideways / Consolidation Range in NIFTY (Spot):
Range Type Price Range (Spot)
Sideways Zone 25143 to 25218
Lower Consolidation Range 25023 to 25143
Expanded Range (if breakout) 24932 to 25278

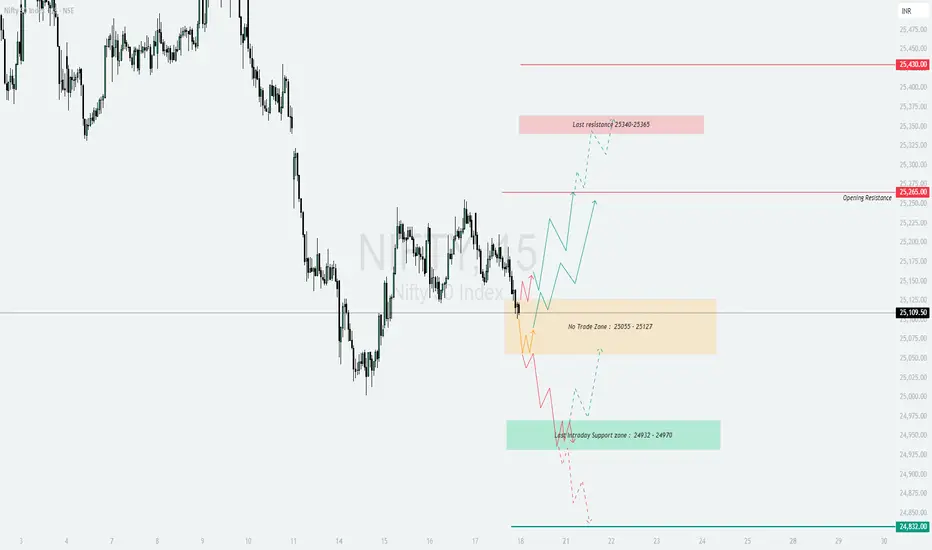
NIFTY - Trading levels and plan for 18-July-2025📊 NIFTY INTRADAY TRADING PLAN – 18-Jul-2025
Gap Opening Consideration: 100+ points from previous close
📍 KEY LEVELS TO MONITOR
🟥 Last Resistance: 25,340 – 25,365
🟥 Major Resistance: 25,430
🟧 Opening Resistance: 25,265
🟨 No Trade Zone: 25,055 – 25,127
🟩 Last Intraday Support Zone: 24,932 – 24,970
🟢 Major Support: 24,832
🚀 SCENARIO 1: GAP-UP OPENING (Above 25,365) 📈
(Gap-up considered as 100+ points above previous close)
If Nifty opens above 25,365 , it indicates bullish strength. Wait for a pullback near 25,340–25,365 for potential long entries.
If price sustains, expect a possible rally toward 25,430+ , which is the next resistance zone.
Avoid chasing entries; use 15–30 min candle confirmation to avoid false breakouts.
Options Strategy: Focus on ATM or slightly OTM Call Options or try a Bull Call Spread for limited risk.
⚖️ SCENARIO 2: FLAT OPENING (Between 25,055 – 25,127) 🟠
(Flat range aligns with the No Trade Zone )
This is a tricky zone with indecision between bulls and bears. Avoid initiating any trade immediately.
If Nifty breaks and sustains above 25,127 , bullish bias may emerge toward 25,265 – 25,340 .
On breakdown below 25,055 , a short trade setup opens targeting 24,932 – 24,970 zone .
Wait for clear hourly close before taking action in either direction.
Options Strategy: Consider Strangle or Iron Fly strategies for range-based volatility exploitation.
📉 SCENARIO 3: GAP-DOWN OPENING (Below 24,932) 🚨
(Gap-down considered below previous close by 100+ points)
If Nifty opens below 24,932 , monitor price action near the 24,832 major support .
If the support fails and prices break down below 24,832 , expect further downside pressure.
However, if price finds buying interest at 24,832 and bounces, you may consider scalping long with tight stop loss.
Options Strategy: Deploy ATM or ITM Put Options or Bear Put Spreads to play downside with defined risk.
💡 RISK MANAGEMENT & OPTIONS TRADING TIPS
🛑 Never risk more than 1–2% of your capital on any single trade.
⏳ Avoid entering trades during the first 15–30 minutes ; let volatility settle.
📉 Use Hourly candle close to determine validity of breakouts/breakdowns.
⚖️ Prefer spread strategies like Bull Call or Bear Put to cap your risk.
🧠 Avoid revenge trading after losses—stick to your trading plan.
📌 SUMMARY & CONCLUSION
Bullish View: Above 25,365, look for long opportunities up to 25,430 with stop-loss below 25,340.
Range-Bound View: Between 25,055–25,127 (No Trade Zone) – wait for breakout/breakdown confirmation.
Bearish View: Below 24,932 – focus on support at 24,832; breach can accelerate fall.
Action Plan: Wait for price behavior near key levels before committing capital.
⚠️ DISCLAIMER: I am not a SEBI-registered analyst. This analysis is for educational and informational purposes only. Please consult your financial advisor before taking any trade or investment decisions.