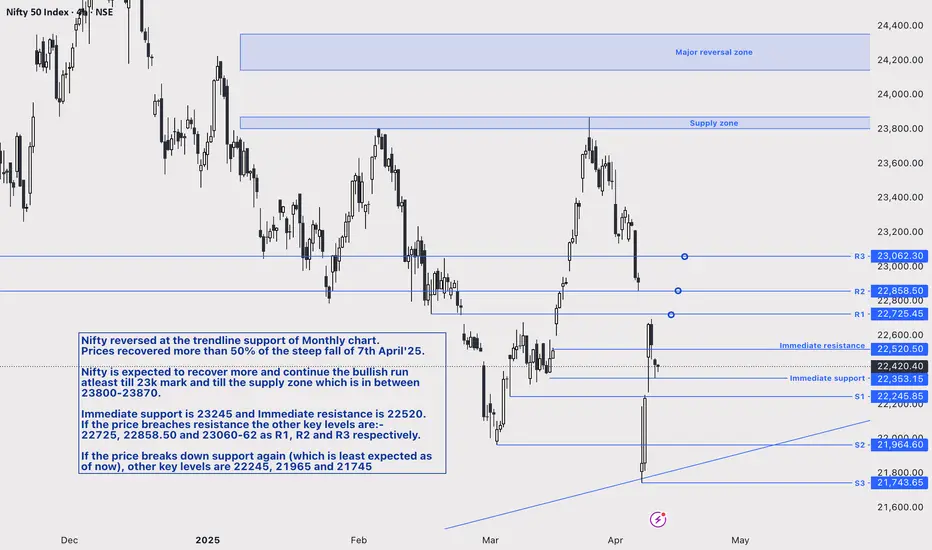
Nifty key levels for this weekNifty reversed at the trendline support of the Monthly chart.
Prices recovered over 50% of the steep fall of 7th April'25.
Nifty is expected to recover more and continue the bullish run at least until the 23k mark and until the supply zone, which is between 23800 and 23870.
Immediate support is 23245 and Immediate resistance is 22520.
If the price breaches resistance the other key levels are:-
22725, 22858.50 and 23060-62 as R1, R2 and R3 respectively.
If the price breaks down support again (which is least expected as of now), other key levels are 22245, 21965 and 21745
Prices in spot.
Niftylevels
Nifty 50 Technical Analysis (as of May 12, 2025)Nifty 50 Technical Analysis - May 12, 2025
Current Market Overview:
Closing Price: The Nifty 50 closed at 24,924.70, up 916.70 points (+3.82%), marking its best single-day performance in four years.
Day Range: Low: 24,378.85 | High: 24,944.80
52-Week Range: Low: 21,281.45 | High: 26,277.35
Market Sentiment: The market exhibited strong bullish momentum, driven by positive global cues, including a ceasefire between India and Pakistan and optimism around US-China trade negotiations
Chart for your reference

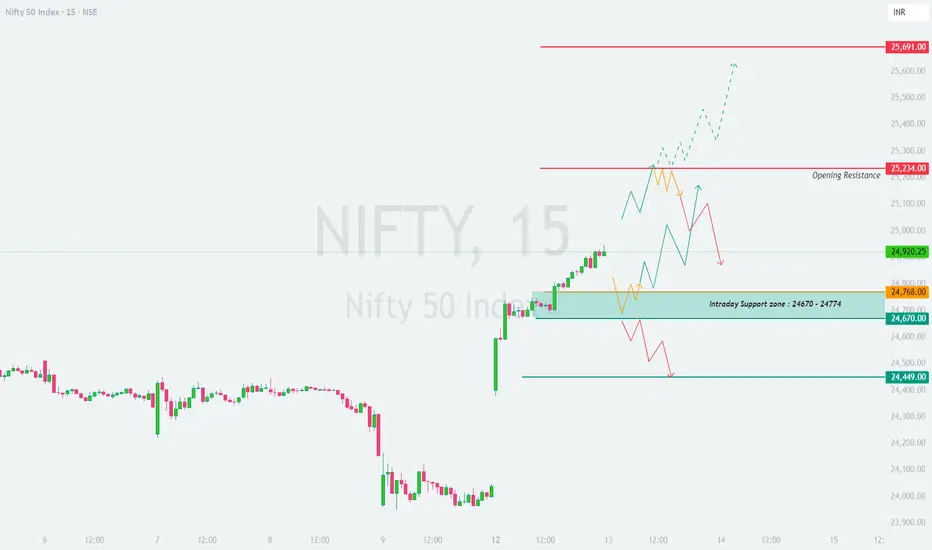
NIFTY : Trading Levels and Plan for 13-May-2025📈 NIFTY TRADING PLAN – 13th May 2025 (15-Min Chart Analysis)
Nifty closed at 24,920 on 12-May-2025. The recent structure shows a sharp bullish move with resistance forming near 25,234 and support around 24,670–24,768 .
The market is currently at a decision point, and the next move will depend heavily on where it opens. Below is a breakdown for each type of opening with actionable trade plans.
🟢 SCENARIO 1: GAP-UP OPENING (Opening Above 25,020)
(Gap up of 100+ points from previous close)
A gap-up above 25,020 places Nifty near the Opening Resistance zone at 25,234 . This is a crucial level that must be watched for either rejection or breakout.
If the index opens between 25,020 and 25,234 , wait and observe the first 15–30 minutes. Avoid jumping into a trade unless a clear bullish structure is formed.
A breakout and sustained move above 25,234 with strong candles can trigger a rally toward 25,691 . In such a case, long trades can be initiated with SL below 25,180 .
If price shows signs of rejection (wicks, bearish engulfing) near 25,234 , aggressive traders can look for a reversal trade with targets around 24,920 – 24,768 .
Avoid initiating trades at the opening candle in this zone — wait for follow-through confirmation.
👉 Educational Insight: Gap-ups near resistance zones often trap early buyers. Let the market confirm direction before committing.
🟨 SCENARIO 2: FLAT OPENING (Between 24,820 – 25,020)
(Open within previous close ±100 pts)
Flat openings inside the current range should be treated cautiously. Price is already in an indecisive zone.
Watch price behavior near 24,920 (previous close). If the index builds higher lows and breaks 25,020 with strength, it may attempt to test 25,234 .
On the downside, if the structure weakens and slips below 24,820 , we can see a dip toward the Intraday Support Zone of 24,670–24,768 .
Only trade breakout above 25,020 or breakdown below 24,768 with structure confirmation. This avoids getting trapped in sideways moves.
Avoid trades in tight 30–40 point ranges — these tend to chop traders with frequent reversals.
👉 Educational Insight: During flat opens, it’s best to let the initial price range form before making directional bets. Often, first 30–45 mins help define the day’s range.
🔻 SCENARIO 3: GAP-DOWN OPENING (Below 24,820)
(Gap down of 100+ points from previous close)
If Nifty opens below 24,820 , it will test the Intraday Support zone of 24,670 – 24,768 . This zone may offer a technical bounce.
Look for bullish reversal candles (hammer, morning star, bullish engulfing) in this zone. If seen, consider a long trade with target toward 24,920 and SL below 24,650 .
If this support zone breaks, and price sustains below 24,670 , expect further downside toward 24,449 .
In case of a breakdown below 24,670 followed by a retest and rejection from below, one may go short for intraday targets.
Avoid knife-catching on gap-downs. Let market absorb selling pressure first — wait for exhaustion or structure to form.
👉 Educational Insight: In gap-down scenarios, panic can create exaggerated moves. Patience and confirmation-based entries are key for safety.
🧠 RISK MANAGEMENT & OPTIONS TRADING TIPS:
Trade ATM or slightly ITM options to manage decay and increase responsiveness.
Never buy deep OTM options unless a very strong trending day is expected.
Use underlying index levels to define stop-loss — not just premium.
Keep maximum 2% of your capital at risk per trade .
Set alerts at key levels like 25,234, 24,768, and 24,670 to stay ahead of triggers.
Avoid overtrading. 1–2 good trades a day are more than enough.
Use a trailing SL once in profit zone to protect gains.
📌 SUMMARY & CONCLUSION:
🔸 Resistance Levels: 25,234 and 25,691
🔸 Support Zone: 24,670 – 24,768
🔸 Breakout Zone: Above 25,234
🔸 Breakdown Zone: Below 24,670
🔸 No Trade Zone: 24,820 – 25,020 (until clear move)
🧭 The market is currently resting just below a resistance zone. Confirmation-based breakout or pullback setups around key zones will offer the best opportunities. Don’t anticipate direction — let the market tell you.
⚠️ DISCLAIMER:
I am not a SEBI-registered analyst . The above trading plan is shared solely for educational purposes. Always consult a registered financial advisor before taking any trading or investment decision. Trade at your own risk with proper analysis and risk control.
Nifty Update: Key Supply Zone Test Ahead – Time to Book Partial On 27th February, I shared a detailed analysis explaining why Nifty was likely to take support from the Monthly Demand Zone .
At that time, the entire market was extremely bearish. FIIs were selling heavily, and most people believed that catching the bottom was impossible. But as demand and supply zone traders , we trusted the footprints of smart money—and as expected, Nifty took support exactly at that zone and reversed.
Today, Nifty is trading just below 5% of its all-time high . This shows the power of demand zones, which are not just random boxes but clear evidence of institutional activity.
Now, let's focus on the current market development .
📈 Nifty Nearing a Critical Supply Zone 📉
If you look at the chart, you'll see that Nifty is now approaching a Daily Supply Zone (Drop-Base-Drop) Which have strong follow-through, making this a strong resistance area .
In addition, I’ve marked a Weekly Supply Zone (Drop-Base-Rally) on the chart. Interestingly, the daily supply zone lies inside this weekly supply zone , creating a powerful confluence of resistance. This stacking of zones increases the probability of price facing rejection in this area.
📊 What Should Traders Do?
If you are holding profitable positions in stocks, this could be a good time to book partial profits .
Be prepared for a possible price rejection from the daily and weekly supply zone .
However, it’s not guaranteed that Nifty will fall from here. Price can also break through the zone, but as traders, capital protection comes first .
The most likely scenario is a small pullback , not a major fall. After the pullback, Nifty may resume its upward move.
Always focus on high-probability setups and manage your risk smartly.
📢 Conclusion:
Nifty is at a crucial supply zone cluster. A pullback is likely, so this could be a smart time to lock in some gains. Watch price action closely and adjust your strategy accordingly.
Lastly, Thank you for your support. Feel free to ask if you have questions.
“Trade what you see, not what you hear. The chart always whispers before the news screams.” 📊🔥
This analysis is purely for educational purposes and is not intended as a trading or investment recommendation. I am not a SEBI registered analyst.

Nifty Reversal Watch: Key Demand Zones & Moving Average in FocusAs a pure technical analyst, I rely solely on what the charts reveal, ignoring the noise of news and fundamentals. Charts tell the story in advance.
As a demand and supply zone trader, my primary focus is on identifying key areas where institutional activity is likely to drive price action. Today, we’ll analyze the Nifty 50 through the lens of demand zones and then complement it with traditional technical analysis using moving averages. This analysis aims to provide clarity on potential reversal zones and market behavior.
📊 Demand Zones: The Foundation of Analysis
Monthly & Quarterly Demand Zones : On the monthly timeframe, I’ve identified a critical demand zone. When we zoom into the quarterly timeframe, this zone aligns perfectly, creating a high-confluence area. These zones represent institutional footprints (Banks, mutual funds, etc. ), indicating where smart money is likely to step in. These are not just traditional lines or boxes on the chart; they are the footprints of institutions that control the market.
Significance of Demand Zones : Demand zones are areas where buyers are expected to dominate, often leading to price reversals. The confluence of monthly and quarterly demand zones increases the probability of a strong support level.
Current Price Action : Nifty is currently hovering near these demand zones, suggesting a potential bottom formation.
📊 Traditional Technical Analysis: Moving Averages
Now, let’s analyze the market through the lens of traditional technical analysts who rely on moving averages.
EMA 20 on Monthly Timeframe : The 20-period EMA on the monthly chart acts as a reliable support level historically. Since 2004, price reversals have consistently occurred near this moving average, marked by green circles on the chart.
EMA 20 as a Magnet : The EMA 20 on the monthly timeframe is equivalent to the 400-period EMA on the daily timeframe, representing the average price of almost 400 days. In trending markets, price always reverts to its average, making this a critical level to watch.
Historical Exceptions : While there are rare instances (marked by red circles) where Nifty has broken below the monthly EMA 20, the presence of demand zones adds an extra layer of support, reducing the likelihood of a significant breakdown.
Current Price Action : Nifty is currently near the monthly EMA 20, which coincides with the monthly and quarterly demand zones.
📊 Combining Both Approaches
High-Confluence Area : The alignment of monthly and quarterly demand zones with the monthly EMA 20 creates a high-confluence area. This increases the likelihood of a strong support level and a potential Bottom.
Risk Management : While the setup appears promising, it’s crucial to manage risk effectively. Always use strict stop-loss orders and avoid over-leveraging. Even high-probability setups can fail, especially when market sentiment is overwhelmingly negative.
📊 Conclusion
The Nifty 50 is at a critical juncture, with multiple technical indicators pointing towards a potential reversal or consolidation. The confluence of demand zones and the monthly EMA 20 provides a high-probability setup. However, always remember that no setup is foolproof, and risk management is crucial, it’s essential to remain cautious as markets can sometimes defy all technical setups.
This analysis is purely for educational purposes and is not intended as trading or investment advice. I am not a SEBI-registered analyst.
Lastly, thank you for your support.
"The market is a master of patience; trade with discipline, not emotion." 🚀📊

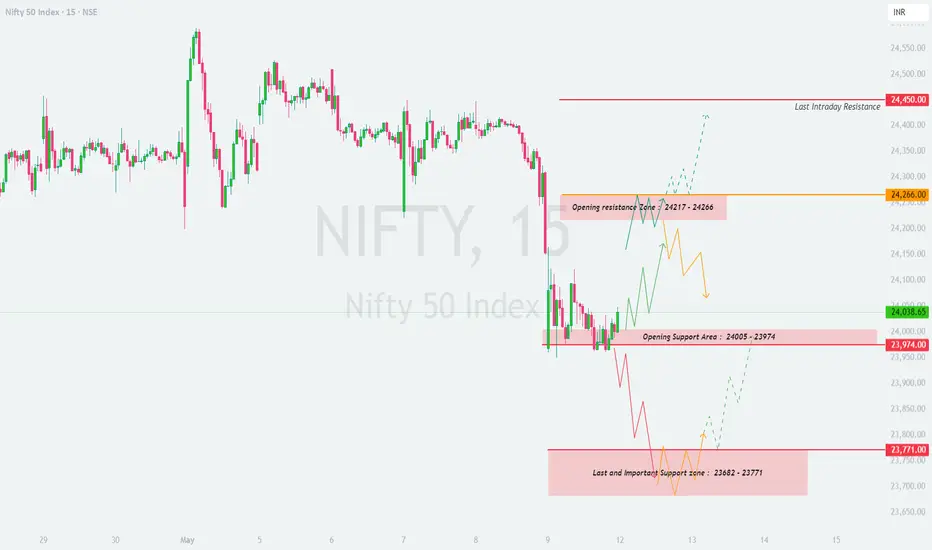
NIFTY : Trading levels and Plan for 12-May-2025📊 NIFTY Trading Plan for 12-May-2025 (15-min Chart)
We’re currently trading near the 24,038 level . The chart suggests clearly defined support and resistance zones which will guide our trading actions depending on the opening. Remember: we define a gap opening as 100+ points away from the previous close.
🟢 SCENARIO 1: Gap-Up Opening (Above 24,266)
If Nifty opens with a gap-up above the Opening Resistance Zone (24,217 – 24,266) and sustains above it:
Watch for price action near 24,266 – if it holds, bulls might push toward the last intraday resistance of 24,450 .
Ideal entry: On retest of 24,266 with a strong bullish candle.
Targets: 🎯 24,375 – 24,450
Stop Loss: 🔻 Below 24,200 on an hourly candle close.
However, if price opens above but slips back below 24,217, it might indicate a false breakout. In that case, wait for confirmation before taking aggressive trades.
🟨 SCENARIO 2: Flat Opening (Between 24,038 and 24,100)
A flat opening would place us within the current trading range. This is a zone of indecision, so patience is key.
Observe how price reacts near the Opening Resistance Zone (24,217 – 24,266) and Opening Support Zone (24,005 – 23,974) .
Bullish bias above 24,100 with confirmation candle targeting 24,217 and eventually 24,266.
Bearish bias only below 23,974 – look for breakdown and confirmation for short opportunities.
Avoid trades within this tight zone until a breakout or breakdown happens with volume.
Wait at least 15–30 mins post-opening for direction clarity. Let the market show its hand.
🔻 SCENARIO 3: Gap-Down Opening (Below 23,900)
This could lead to a test of the Last Support Zone: 23,682 – 23,771 . This zone is crucial.
If the index opens below 23,900 and heads toward 23,771–23,682, expect demand from this support.
Look for bullish reversal candles in this zone for a possible intraday bounce.
If breakdown happens below 23,682 with volume and a 15-min close, market could slide further towards 23,550–23,450 levels.
Avoid catching falling knives. Wait for confirmation (hammer, bullish engulfing).
Be cautious on put side here unless breakdown sustains – whipsaws are common near strong supports.
📘 Risk Management Tips for Options Traders 🧠
Avoid buying deep OTM options. Stick to ATM or slightly ITM contracts for better delta and lower decay.
Always define your risk with stop-loss based on candle closes (ideally 15 or 1-hour).
Don’t trade just on gap logic. Wait for the price to respect or reject key levels.
Trail your profits instead of aiming for unrealistic targets. Consistency > Jackpot.
Position sizing is key. Never risk more than 1–2% of your capital on a single trade.
📌 Summary & Conclusion:
Key Levels to Watch: 👀
🔸 Opening Resistance Zone: 24,217 – 24,266
🔸 Opening Support Zone: 24,005 – 23,974
🔸 Major Support Area: 23,682 – 23,771
🔸 Upside Resistance: 24,450
This is a day to let the market settle in early trades. Direction will be determined by breakout or breakdown from the marked zones . Don’t chase; instead react to the market’s structure with discipline.
⚠️ Disclaimer:
I am not a SEBI-registered analyst. All views shared here are for educational purposes only. Please consult your financial advisor before taking any position. Trade at your own risk.
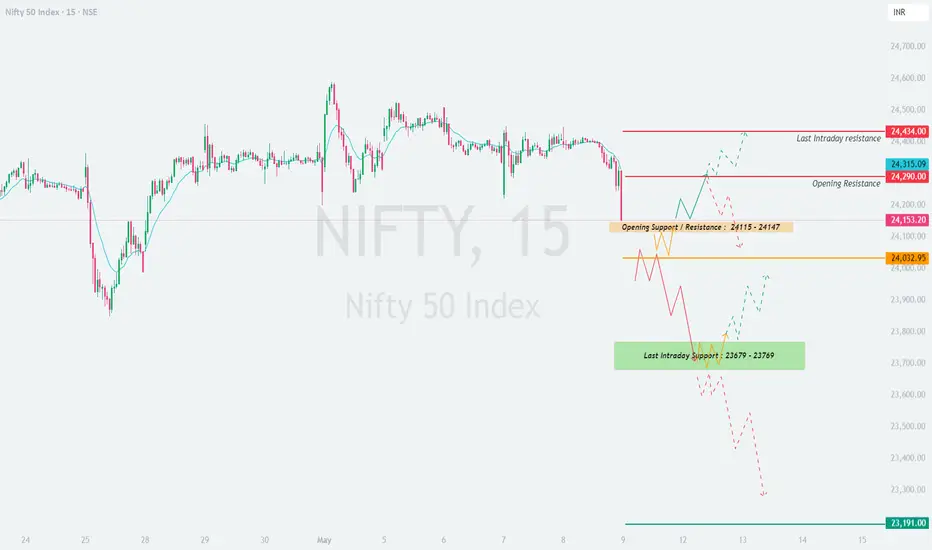
NIFTY : Trading Levels and Plan for 09-may-2025📊 Nifty Trading Plan for 09-May-2025
Timeframe: 15-Min | Previous Close (Approx.): 24,153.20
🔎 Key Technical Levels to Watch:
🔴 Opening Resistance: 24,290
🟧 Opening Support / Pivot Zone: 24,115 – 24,147
🟩 Immediate Support Zone: 24,000 – 24,032
🟦 Last Intraday Support Zone: 23,679 – 23,769
🟢 Major Support Level (Further Down): 23,191
📌 Sideways Resistance Zone (Higher Resistance): 24,434 – 24,480
🟢 1. Gap-Up Opening (📈 Opening above 24,253 — Gap of 100+ Points)
If Nifty opens significantly above 24,253, it will likely be challenging the Opening Resistance level of 24,290 from the start. A gap of this nature indicates strong initial buying interest.
✅ Plan of Action:
- If Nifty opens and sustains above 24,290, the initial move might extend towards the Sideways Resistance Zone (Higher Resistance) of 24,434 – 24,480.
- Educational Insight: When a gap up occurs directly into a resistance level (like 24,290), it's crucial to observe the first 15-30 minutes. Look for either:
- Continuation: Strong bullish candles breaking above 24,290 with good volume, confirming buyer strength. In this case, longs can be considered with a stop-loss below the opening range low, targeting 24,434.
- Rejection: If Nifty struggles at 24,290 or shows signs of weakness (e.g., long upper wicks, bearish engulfing patterns on the 15-min chart), it could be a sign of profit-booking or sellers stepping in. Shorts could be initiated below 24,250 (confirming the gap fill has started) for targets of 24,147 and then the Immediate Support Zone of 24,000 – 24,032.
- Avoid chasing the gap immediately. Wait for price to settle and provide a clear signal. A retest of the breakout level (24,290 if breached) from above would offer a better risk-reward entry for longs.
🟡 2. Flat Opening (🔄 Between 24,053 – 24,253)
A flat opening, likely within the range of the Opening Support / Pivot Zone (24,115 – 24,147) and the Opening Resistance (24,290), suggests initial indecision. The previous close of ~24,153 falls into this scenario.
✅ Plan of Action:
- The zone of 24,115 – 24,147 will be key.
- Bullish View: If Nifty holds above 24,147 and shows strength, longs can be initiated for a target of the Opening Resistance at 24,290. A convincing break above 24,290 could then target the Sideways Resistance Zone of 24,434 – 24,480.
- Bearish View: If Nifty breaks below 24,115 and sustains, it would indicate weakness. Shorts can be considered with targets at the Immediate Support Zone of 24,000 – 24,032.
- Educational Insight: Flat openings often lead to range-bound behavior initially. It's wise to wait for a breakout from the first 30-60 minutes range. Trading within the range can be risky unless clear support/resistance flips are observed on smaller timeframes. The direction of the break from this initial balance will likely set the tone for a significant portion of the session.
🔴 3. Gap-Down Opening (📉 Opening below 24,053 — Gap of 100+ Points)
A gap-down opening below 24,053 would mean Nifty is opening near or below the Immediate Support Zone of 24,000 – 24,032. This indicates significant selling pressure from the outset.
✅ Plan of Action:
- If Nifty opens below 24,032, watch how it reacts to this level.
- Potential Reversal: If the market finds support around 24,000 – 24,032 (e.g., forms a hammer, bullish engulfing, or double bottom on the 15-min chart), a bounce-back towards the gap-fill (towards 24,115 – 24,147) can be anticipated. Longs can be taken with strict stop-loss below the day's low.
- Continuation of Selling: If Nifty decisively breaks below 24,000 and sustains, further selling pressure can drag it towards the Last Intraday Support Zone of 23,679 – 23,769. In this case, short positions can be considered on a pullback to the breakdown level (around 24,000) or on continuation patterns.
- Educational Insight: Large gap downs can sometimes lead to sharp, short-covering rallies if they land in a strong support area. However, it's crucial not to try and "catch a falling knife." Wait for the price to stabilize and show signs of reversal (like a clear basing pattern or bullish candle formations) before considering long trades. If selling momentum is strong, attempting to go long too early can lead to quick losses.
💡 Risk Management Tips for Options Trading:
📏 Position Sizing is Key: Never allocate more than a small percentage of your trading capital (e.g., 1-2%) to a single trade. This helps in surviving drawdowns.
🎯 Define Stop-Loss Before Entry: For option buyers, this could be a percentage of premium (e.g., 20-30%) or based on the underlying spot Nifty level. For sellers, define the maximum acceptable loss or the spot level at which you'll exit.
⏳ Be Mindful of Time Decay (Theta): Especially when buying options, time decay accelerates as expiry approaches. Avoid holding onto losing OTM (Out-of-the-Money) options for too long, hoping for a turnaround.
🛡️ Consider Hedging for Volatility: If volatility is expected to be high or if you are unsure of the direction, consider strategies like spreads (bull call spread, bear put spread) or iron condors to limit risk.
💨 Don't Fight Strong Momentum: If the market is trending strongly, trading against the trend (e.g., buying puts in a strong uptrend) is generally a lower probability trade for option buyers unless a clear reversal is confirmed.
📖 Understand Option Greeks: A basic understanding of Delta, Gamma, Theta, and Vega can significantly improve your decision-making in options trading.
📌 Summary & Conclusion:
Nifty stands at a point where the immediate direction will be heavily influenced by the opening. The pivot zone around 24,115 – 24,147 is crucial for flat openings.
For Gap-Up openings , the ability to conquer and hold above 24,290 will be tested, with 24,434 – 24,480 as the next target. Failure could lead to a gap fill.
For Flat opens , range-bound action between 24,032 and 24,290 is possible initially. A breakout from this range will offer clearer directional cues.
For Gap-Downs , the 24,000 – 24,032 support zone is critical. A hold could offer a bounce, while a break could accelerate selling towards 23,679 – 23,769.
Always prioritize setups that offer good risk-reward ratios, wait for confirmation, and manage your risk diligently.
📢 Disclaimer:
I am not a SEBI-registered analyst. The above trading plan is intended purely for educational and informational purposes. It is based on technical analysis of the provided chart and should not be construed as financial advice. Trading in the stock market involves significant risk, and you may lose money. Please consult with your financial advisor before making any trading or investment decisions.
Fresh Possible Supply Zones Spotted! | 15-Min Chart Analysis🟣 Nifty 50 Index – Fresh Possible Supply Zones Spotted! | 15-Min Chart Analysis
📅 Date: May 7, 2025 | 🕒 Timeframe: 15-Minute
Hello Traders 👋
Today’s chart highlights two potential supply zones on the Nifty 50 index that could play a crucial role in the short-term price movement. Supply zones are areas where sellers have previously stepped in, often leading to price reversals or consolidations. As price approaches these levels again, we may witness similar behavior.
🔲 Supply Zone 1: 24,558.35 – 24,589.15
This upper zone formed after a strong up-move followed by aggressive selling pressure. It indicates the presence of strong sellers. If Nifty retests this area, look for signs of reversal like bearish candles or rejection wicks.
🔲 Supply Zone 2: 24,391.30 – 24,449.60
A more recent and sharper reaction zone. This is where we saw an intraday rejection today, suggesting sellers are active even at slightly lower levels. This could act as the first resistance on any intraday pullback.
🧠 What Should Traders Watch For?
Wait for price to enter the supply zone and show signs of rejection.
Use confirmation tools like candlestick patterns, RSI divergence, or volume drop.
Ideal for sell-on-rise setups with proper stop loss above the supply zone.
Avoid trading blindly inside the zone—confirmation is key.
📌 Note: These zones are not guaranteed reversal points but serve as high-probability areas for potential resistance. Combine them with your strategy for better results.
💬 Feel free to drop your thoughts or ask questions in the comments. Follow for more such real-time chart breakdowns.

NIFTY daily Retrace 61% from bottomHello everyone,
Nifty spot 24340 consolidating since 2 weeks within range of 24000 to 24500 rsi negative divergnve is there on daily time aong with fibbonacci 61% retrace from bottom volume is not supporting bullish breakout away from 200 ema can expect bearish move till 23500 trendline support.

Bank nifty Futures 08.05.25Expecting a gap up to flat opening. May get a morning move on the upside. However overall, we have a bearish structure on higher TF. My strategy for the day will be to sell on rise. Incase I do not get a downward move will prefer to stay out of the markets.

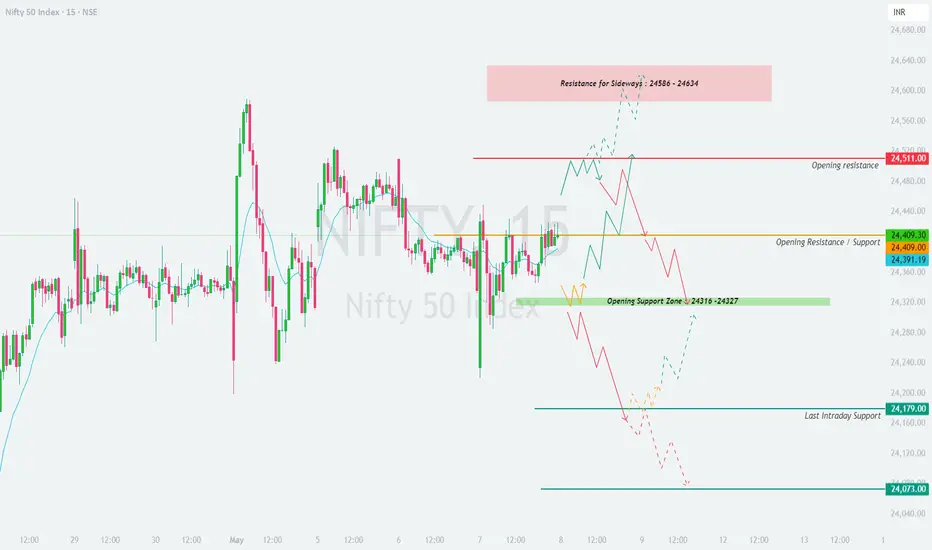
NIFTY : Trading Levels and Plan for 08-May-2025📊 Nifty 50 Trading Plan for 8-May-2025
Timeframe: 15-Min | Previous Close: 24,409.30
🔎 Key Technical Levels to Watch:
🔴 Opening Resistance: 24,511
🟧 Opening Resistance / Support: 24,409
🟩 Support Zone: 24,320 – 24,280
🟦 Last Intraday Support: 24,179
🟢 Major Support Level: 24,073
📌 Sideways Resistance Zone: 24,586 – 24,634
🟢 1. Gap-Up Opening (📈 Opening above 24,509 — Gap of 100+ Points)
If Nifty opens above 24,509, it is entering the Opening Resistance Zone . A strong open near or within 24,586 – 24,634 (marked as Sideways Resistance) needs cautious handling.
✅ Plan of Action:
- Avoid chasing longs immediately into this resistance zone.
- Wait for the first 15–30 minutes to observe whether buyers sustain above 24,586.
- If price consolidates above 24,586 and gives a breakout with volume, it may test higher levels intraday.
- However, if price faces rejection (like long upper wicks or bearish engulfing candles), initiate shorts below 24,511 for targets of 24,409 and possibly 24,320 – 24,280.
📝 Educational Insight: Gap-up openings into resistance zones often trap late buyers. Wait for confirmation in the form of retests or strong follow-through candles before taking trades.
🟡 2. Flat Opening (🔄 Between 24,309 – 24,509)
If Nifty opens flat near 24,409 (previous close), the market will likely consolidate in the initial minutes.
✅ Plan of Action:
- Observe the price action within the first 15-minute candle.
- If price sustains above 24,409, look for a move toward 24,511. A breakout above that may attempt to test the 24,586 – 24,634 resistance zone.
- On the downside, if price breaks and sustains below 24,320, expect selling pressure towards 24,179.
- Be flexible and neutral at open. Let the initial 30-minute range define the trend.
📝 Educational Insight: Flat opens offer great opportunity to play breakout/breakdown setups. Wait for a strong directional move from the initial balance zone before entering trades.
🔴 3. Gap-Down Opening (📉 Opening below 24,309 — Gap of 100+ Points)
A gap-down open below 24,309, especially near or under the support zone of 24,320 – 24,280, demands caution and strategic planning.
✅ Plan of Action:
- If the price opens around 24,280 – 24,179 zone, check for immediate bounce or sideways consolidation.
- A bullish reversal candle (hammer, bullish engulfing) around this zone can lead to a bounce back towards 24,409.
- However, if price breaks 24,179 decisively, and a 15-min candle closes below it, a quick slide towards 24,073 is likely.
- Do not catch falling knives—wait for a retest or formation of a base.
📝 Educational Insight: Gap-downs often create panic, but they also offer the best risk-reward trades if reversal patterns form near strong support zones. Let the market show you the strength.
💡 Risk Management Tips for Options Trading:
📏 Size your positions properly: Never risk more than 1–2% of your capital in one trade.
🕒 Time your trades: Avoid aggressive buying post 11:30 AM unless clear direction emerges.
📉 Avoid averaging losing positions in options; take the SL and re-enter with structure confirmation.
🛠️ Prefer hedged strategies like spreads or iron condors if volatility is high.
🔁 Use time-based exits (e.g., square off by 3:00 PM if momentum stalls).
📌 Summary & Conclusion:
Nifty is at a critical juncture with clear supply at 24,511 – 24,634 and support at 24,320 – 24,073.
For Gap-Up openings , caution near resistance is key—wait for breakout confirmation.
For Flat opens , let the range develop before breakout trades.
For Gap-Downs , avoid emotional trades—wait for proper reversal signals near 24,179 or 24,073.
Focus on quality setups, defined risk, and disciplined exits.
📢 Disclaimer:
I am not a SEBI-registered analyst. The above trading plan is intended purely for educational purposes. Please consult with your financial advisor before taking any trading or investment decisions.
Rising Wedge Breakout or Trap?📈 Nifty 50 – Rising Wedge Breakout or Trap? 🔍
🗓️ 2nd May 2025 | 15-Min Chart Analysis
The Nifty 50 has been respecting a rising wedge pattern over the past few sessions. Today, we witnessed a sharp bounce from the lower trendline with a strong bullish candle and volume spike — just enough to test the upper boundary of the wedge!
💡 Key Observations:
Price touched the upper trendline resistance – caution advised 🚨
Volume spike hints at possible breakout attempt or smart money exit
Watch closely: A breakout with volume = bullish continuation 📈
A rejection here = possible reversal 📉
🔔 My Take:
Momentum is strong, but the structure looks fragile. If it breaks out and sustains above the wedge, we could see a 100–150 point move. Else, a reversal towards 24,300 or below is also on the cards. Stay alert.
📊 Always trade with proper risk management.
📌 What’s your view? Breakout or fakeout? Drop your thoughts below!

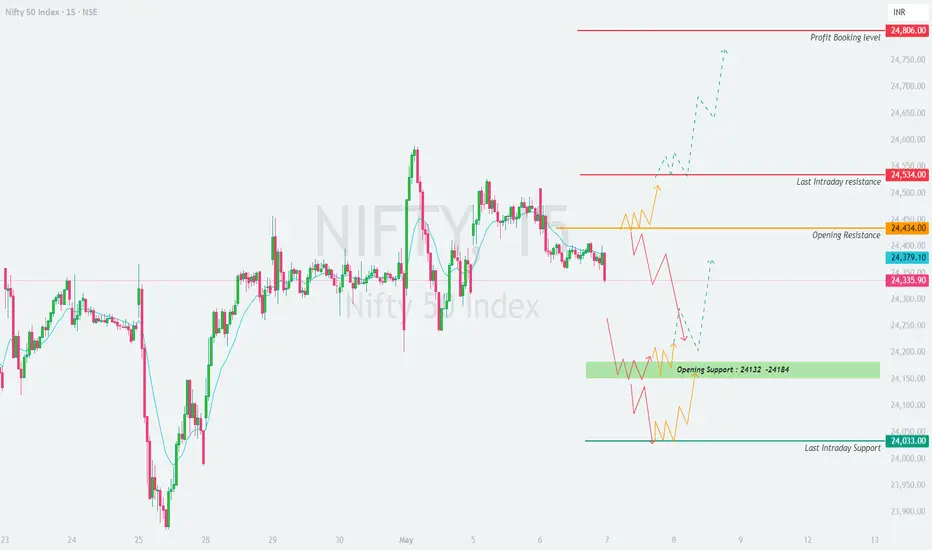
NIFTY : Trading Levels and Plan for 07-May-2025📆 NIFTY 15-Min Trading Plan for 7-May-2025
(Structure-Oriented | 100+ Point Gap Consideration | For Educational Purpose Only)
📍 Previous Close: 24,335.90
📌 Important Levels to Watch:
🟧 Opening Resistance: 24,434
🟥 Last Intraday Resistance: 24,534
🟢 Opening Support: 24,132 – 24,184
🟩 Last Intraday Support: 24,033
🔴 Profit Booking Zone: 24,806
🟩 Scenario 1: Gap-Up Opening (Above 24,434) 🚀
A gap-up opening above 24,434 indicates bullish strength as it breaches the Opening Resistance .
If the index sustains above 24,434 for the first 15–30 mins, there's a high probability of continuation toward 24,534 (Last Intraday Resistance) .
A breakout above 24,534 with a strong 15-min candle may trigger a rally toward the Profit Booking Level near 24,806 .
Be cautious if the price hits 24,534 quickly at open—it may reverse from this level. Wait for rejection candles (e.g., long wicks or bearish engulfing) before taking short trades.
If price opens above 24,434 but falls back below it, it could signal a false breakout . This might bring the index back inside the previous range.
📚 Educational Insight: Gap-ups directly into resistance zones require confirmation. Never chase the open blindly—observe structure, momentum, and volume before initiating trades.
⚖️ Scenario 2: Flat Opening (Between 24,300 – 24,434) ⏸️
A flat open in this range implies a neutral stance. Avoid rushing into trades during the first 15 minutes.
If the price breaks and sustains above 24,434 , it could test 24,534 and beyond. Wait for a clear candle close above 24,434 before initiating a long.
If price fails to breach 24,434 and starts forming lower highs, bearish momentum may drag the index toward 24,184–24,132 Support Zone .
Watch this support area closely—if price forms a reversal pattern like a hammer, morning star, or bullish engulfing, long trades can be considered with a stop below 24,132.
No trade is better than a bad trade inside a consolidation zone. Wait for structure to build.
📚 Educational Insight: Flat openings are indecisive. Be a sniper, not a machine gun—wait patiently for range breakouts or breakdowns before deploying your capital.
🟥 Scenario 3: Gap-Down Opening (Below 24,184) 📉
A gap-down below the Opening Support Zone (24,132–24,184) shows weakness. Watch how the price behaves in this zone.
If Nifty holds above 24,132 and shows a bullish reversal pattern, a long trade can be attempted targeting a re-test of 24,300–24,434 zone.
However, if 24,132 is breached and the index sustains below it, it opens the gates for a deeper correction toward the Last Intraday Support at 24,033 .
A decisive breakdown below 24,033 can accelerate selling, especially if supported by volume and broader market weakness.
Avoid catching falling knives—wait for signs of reversal before going long in falling markets.
📚 Educational Insight: Gap-downs often trigger panic—but also provide the best risk-reward setups at support zones if price reacts positively. Let the candles speak before you act.
🛡️ Options Trading Risk Management Tips 🧠
⏰ Avoid trading options in the first 15 minutes —premiums are inflated and prone to quick decay or reversal.
💡 Use ATM or ITM strikes for directional trades; they offer better delta and require smaller moves to gain.
🔐 Consider using spreads (Bull Call / Bear Put) to reduce cost and cap risk.
✋ Don’t average losing trades. Define a stop-loss either on the premium (20–30%) or index level.
📓 Maintain a trade journal—it improves discipline and helps refine your setups.
🔢 Risk only 1–2% of total capital per trade. Avoid revenge trading after a loss.
🧘♂️ Be emotionally detached. Don’t treat the market like a casino—stick to a rule-based system.
📌 Summary & Conclusion:
✅ Gap-Up Above 24,434: Watch for bullish continuation toward 24,534–24,806. Confirm breakout with structure.
✅ Flat Opening (24,300–24,434): Be patient; wait for range breakout or breakdown to develop a clean setup.
✅ Gap-Down Below 24,184: Keep eyes on 24,132 and 24,033 for support. Strong bounce or breakdown will guide direction.
🎯 Focus on key zones, be structure-oriented, and never compromise on risk management. Let price action dictate your entries and exits.
⚠️ Disclaimer:
I am not a SEBI-registered analyst. The above trading plan is purely for educational purposes. Always consult with your financial advisor before making any investment or trading decisions.
Nifty projected target could be near 30,500.Nifty is currently trading at 24,346. After breaking out above the 23,800 level, it has been consolidating within a range over the past few days. If you’ve already bought Nifty, here’s a key suggestion: there may be a slight correction ahead, with potential support around the 23,800 level. From there, the next target appears to be around 25,500. If Nifty manages to break above 26,277 and successfully retests that level as support, the next projected target could be near 30,500.

$NSE:NIFTY - Analysis For Tomorrow!🚨 Nifty 50 Breakout Incoming? | Symmetrical Triangle on 15-min Chart.
NSE:NIFTY is consolidating within a symmetrical triangle pattern on the 15-minute chart — a classic setup that often leads to a strong breakout or breakdown.
📊 Chart Setup:
Pattern: Symmetrical Triangle (Neutral)
Price Action: Compressing between rising support & falling resistance
View : Price nearing the tip — breakout imminent
✅ Bullish Scenario:
Breakout above 24,541
Targets: 24,666 → 24,737
✅ Watch for volume confirmation and follow-through candles
❌ Bearish Scenario:
Breakdown below 24,383
Targets: 24,186 → 24,041
❗ Confirm with a breakdown candle + failed retest
🔑 Key Support & Resistance:
Resistance: 24,541 | 24,666 | 24,737
Support: 24,383 | 24,186 | 24,041
📌 Note: Symmetrical triangles are neutral patterns. Wait for a confirmed breakout/breakdown with strong volume before entering a trade.

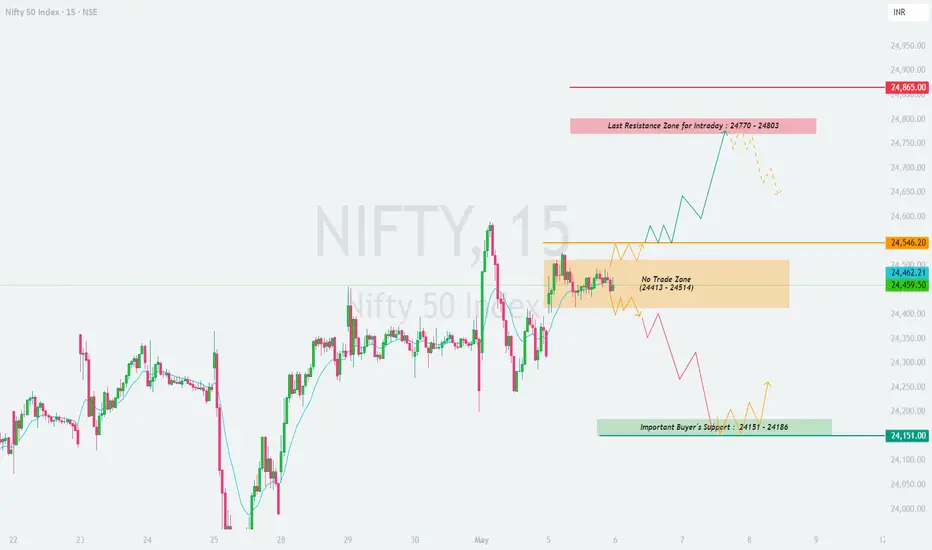
NIFTY : Trading Levels and Plan for 06-May-2025📅 NIFTY 15-Min Trading Plan for 6-May-2025
(Gap Opening Consideration: 100+ Points | Structure-Oriented Plan | For Educational Purpose Only)
📍 Previous Close: 24,459.50
📌 Important Levels to Watch:
🟧 No Trade Zone: 24,413 – 24,514
🟨 Crucial Resistance: 24,546
🟥 Last Resistance Zone for Intraday: 24,770 – 24,803
🟩 Important Buyer's Support: 24,151 – 24,186
🔻 Strong Breakdown Level: Below 24,151
🟩 Scenario 1: Gap-Up Opening (Above 24,546) 🚀
If Nifty opens with a gap-up above 24,546, it would mean the market has bypassed the No Trade Zone and broken out of immediate resistance.
Observe the first 15 minutes. If the price holds above 24,546, we could see a continuation move toward 24,770 – 24,803, which is the Last Resistance Zone for Intraday .
This zone may invite profit booking or supply pressure. If price reaches here too fast and starts rejecting (long upper wicks or bearish engulfing candles), consider booking longs or trailing your stop-loss.
Only a strong 15-min candle close above 24,803 can open gates for a rally toward 24,865 and beyond—though chances are slim unless macro triggers support it.
If price fails to sustain above 24,546 and slips back below it, expect a drop back into the No Trade Zone. Be cautious of false breakouts and whipsaws.
📚 Educational Insight: A gap-up directly into or above resistance needs volume and confirmation to sustain. Patience during the first 15-min bar is essential to avoid being trapped in fake momentum.
🟨 Scenario 2: Flat Opening (Within 24,413 – 24,514) ⚖️
A flat open in this zone means the market is indecisive and in a No Trade Zone . Avoid taking fresh positions unless the price gives a clear breakout or breakdown.
For bullish continuation, price must break and sustain above 24,546 with strong 15-min candle body and volume. Entry above 24,546 with SL below 24,500 may offer 1:2 RR toward 24,770+.
If price breaks down below 24,413, momentum may build on the downside and attract sellers, especially if broader indices turn weak.
A breakdown from this zone can push the price toward the Buyer's Support Zone at 24,151 – 24,186. Watch for bounce signals (e.g., hammer or bullish engulfing) in this area.
If price keeps consolidating between 24,413–24,514, stay out of the market—this is a chop zone. Wait for structure confirmation.
📚 Educational Insight: No Trade Zones are like neutral battlegrounds—wait for one side (bulls/bears) to clearly dominate before committing capital.
🟥 Scenario 3: Gap-Down Opening (Below 24,413) 📉
A gap-down below 24,413 can trigger early selling and bring the index toward the next key demand zone of 24,151 – 24,186.
This Buyer's Support Zone is crucial—look for strong bullish reversal candles in this area to go long with defined stop loss below 24,151.
If this zone fails to hold, and price sustains below 24,151, expect fresh downside selling with increased momentum.
Avoid shorting aggressively into support—wait for retest and rejection before building bearish positions.
Reversals from support zones often provide the best intraday buying opportunities if supported by structure and volume.
📚 Educational Insight: Strong supports can reverse price swiftly. It's better to wait for price to react at these levels before deciding on your position. Don’t chase fear-based trades.
🛡️ Risk Management Tips for Options Traders 📉📈
Avoid trading options within the first 5–15 minutes ; premiums are inflated and often trap traders in wrong momentum.
Focus on structure-based trades rather than emotions. Confirm breakout or breakdown with volume and candle body.
Define your maximum loss per trade (1–2% of capital) and respect it.
Prefer ATM/ITM options for directional trades and use hedged positions (spreads) in volatile sessions.
Always use stop-loss on premium or index level basis , and don’t average into losing trades.
Maintain a trade journal to track your psychology, setups, and performance over time.
📌 Summary & Conclusion:
✅ Gap-Up Above 24,546: Watch for sustained move toward 24,770–24,803. Be alert for resistance at those highs.
✅ Flat Opening in 24,413–24,514: Stay away unless a breakout or breakdown occurs. Wait for structure confirmation.
✅ Gap-Down Below 24,413: Watch for support action at 24,151–24,186 zone. Possible low-risk buying opportunity if reversal confirms.
🎯 Focus on structure, not speculation. Let the chart guide you—not emotions. Manage risk like a pro and avoid overtrading.
⚠️ Disclaimer:
I am not a SEBI-registered analyst. The above content is for educational purposes only. Please consult with your financial advisor before making any trading or investment decisions.
#nifty50 ANALYSIS FOR TOMORROWNSE:NIFTY
#nifty50 ANALYSIS FOR TOMORROW 🔺
❇️ IMPORTANT LEVELS 🚀
❇️ Support: 24268-24196-24101
❇️ Resistance: 24432-24528-24601-24675
👉🏻 PURPLE LINE: 24364-24310 is a key level for selling.
👉🏻 thetradeforecast 🇮🇳

Nifty tgt 30000 market on fire modeNifty is currently trading at 24,445. It is expected to first approach the 24,800 level. A minor correction may occur at that point. However, if Nifty subsequently breaks above the 26,000 level, there is a strong likelihood that it could advance toward the 30,000 mark.

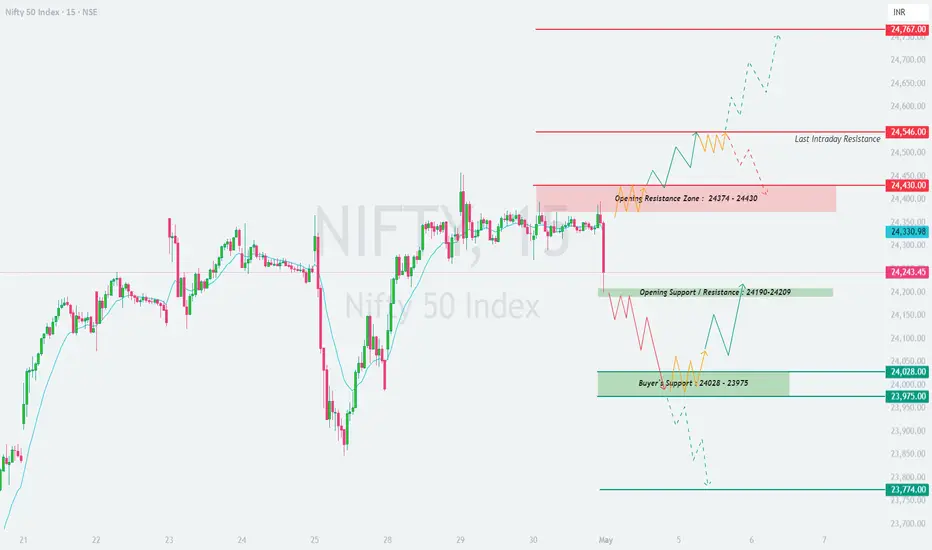
NIFTY : Trading Levels and Plan for 02-May-2025📊 NIFTY 15-Min Trading Plan for 2-May-2025
(Chart-Based | Gap Opening = 100+ Points)
📍 Previous Close: 24,243.45
📌 Key Chart Zones & Levels:
🔴 Last Intraday Resistance: 24,546
🟥 Opening Resistance Zone: 24,430 – 24,374
🟩 Opening Support/Resistance Zone: 24,209 – 24,190
🟢 Buyer's Support Zone: 24,028 – 23,975
🔻 Extreme Downside Support: 23,774
🟥 Scenario 1: Gap-Up Opening (Above 24,430) 🚀
If Nifty opens above 24,430 , we are opening directly into the resistance supply zone . Avoid blind longs here as sellers may initially step in.
A sustainable bullish structure above 24,430 with follow-through candles and volume is a must for any breakout trade toward 24,546 (Last Intraday Resistance).
If price rejects the zone and slips back under 24,374, expect a pullback toward 24,330–24,243 zone.
For upside targets beyond 24,546, strong momentum must be visible. Only then can traders look for 24,767 as an extension level.
If the gap-up fades quickly and dips below 24,374, this is a warning for potential "gap fade" sell-off.
📚 Educational Insight: Gaps into resistance need extra caution. Early buyers often get trapped. Let the structure form before committing to trades.
🟨 Scenario 2: Flat Opening (Between 24,209 – 24,430) ⚖️
A flat open puts Nifty inside the consolidation or decision zone . Expect both buyers and sellers to remain active here.
Avoid early trades in the first 15–30 minutes. Let price test the upper resistance (24,430) or lower support (24,209).
If Nifty breaks and sustains above 24,430, trend may attempt to reach 24,546 and possibly 24,767.
If Nifty dips below 24,209, a quick move toward 24,028 – 23,975 zone is possible. Look for bullish reversal candles here before buying.
Range-bound price action likely unless breakout or breakdown triggers with strength. Stay reactive, not predictive.
📚 Educational Insight: Neutral opens often give the best trade setups—but only after price reacts to zone boundaries. Wait for confirmation.
🟩 Scenario 3: Gap-Down Opening (Below 24,209) 📉
A gap-down below 24,209 brings immediate attention to 24,028 – 23,975, a critical Buyer's Support Zone .
If price shows reversal patterns (bullish engulfing, hammer) near this zone with good volume, long entries with stops below 23,975 are favorable.
Failing to hold 23,975 will open gates to a deeper fall toward 23,774, the next visual support.
Avoid aggressive long trades just because prices are lower—structure matters more than location.
Breakdown below 23,975 with strong bearish candles can trigger fresh short trades targeting 23,774 or even lower zones.
📚 Educational Insight: Gaps into demand zones offer great risk-reward, but only if supported by price confirmation. Avoid catching falling knives without structure.
🛡️ Options Risk Management Tips for Intraday Traders 🧠
Never trade naked options blindly in high IV zones. Use spreads (like bull call or bear put) for defined risk setups.
Don’t jump into trades in the first 5–10 minutes—option premiums are inflated. Let them settle.
Always trade with a defined stop loss . Avoid averaging losses.
Keep daily loss limits (e.g., 2% of capital) and walk away once hit. Discipline is key.
Avoid overleveraging OTM options; go ITM for directional conviction or use hedge legs.
Know when NOT to trade—sideways and indecisive markets destroy premium buyers.
Don’t convert intraday trades into swings emotionally. Stick to your plan.
📌 Summary & Conclusion 📝
✅ Gap-Up Opening: Watch 24,430–24,546 zone for reversal or breakout confirmation. Avoid aggressive longs without strength.
✅ Flat Opening: Neutral zone. Best setups may form after breakout/breakdown. Wait for edge-based reactions.
✅ Gap-Down Opening: Focus on 24,028–23,975 demand zone for reversal. Fresh shorts only below 23,975.
🎯 Trade with structure, confirmation, and risk control . Let price come to your plan—don’t chase emotions.
⚠️ Disclaimer:
I am not a SEBI-registered analyst. This analysis is intended solely for educational purposes. Please consult a certified financial advisor before making any trading or investment decisions.
banknifty 30.04.25Expecting a gap down opening and maybe a downward movement. However, I will stick to Buy on Dips until and unless there is something I see on OF or MP. Will be carefully looking for any signs of absorption or trapping of sellers

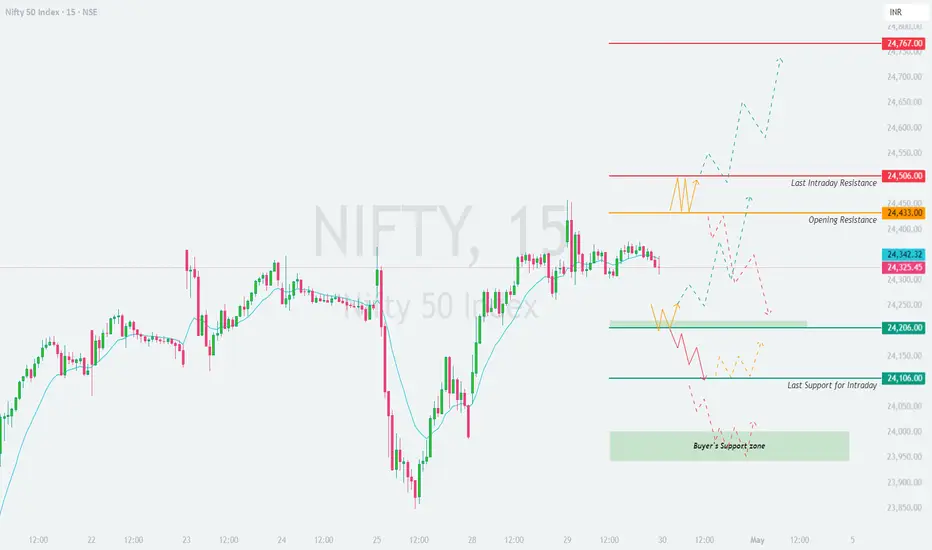
NIFTY : Trading levels and Plan for 30-Apr-2025📈 NIFTY 15-Min Trading Plan for 30-Apr-2025 📈
(Chart-Based | Gap Opening Defined as 100+ Points)
📍 Previous Close: 24,325.45
📌 Key Zones & Levels on Chart:
🔴 Last Intraday Resistance: 24,506
🟧 Opening Resistance: 24,433
🔵 CMP Reference Zone: 24,342.32
🟩 Important Support: 24,206
🔽 Last Support for Intraday: 24,106
🟢 Buyer's Support Zone: 23,950 – 24,050
🟥 Scenario 1: Gap-Up Opening (Above 24,433)
If Nifty opens above 24,433 , it indicates bullish sentiment and price will open near or above the Opening Resistance level.
Watch for price consolidation or bullish structure above 24,433 —this signals strong buyer conviction.
Sustained price action above 24,433 may push Nifty toward 24,506, which is the Last Intraday Resistance .
If momentum continues with volume, the upside extension is possible towards 24,767, the next visible resistance.
On the flip side, a rejection from 24,506** or false breakout above 24,433 may invite selling pressure back into 24,342–24,300 range. Avoid aggressive longs if price gets trapped above resistance zones.
📚 Educational Note: In a gap-up scenario, avoid buying immediately at open. Wait for retracement or consolidation for a better risk/reward entry.
🟨 Scenario 2: Flat Opening (Between 24,206 – 24,433)
A flat opening between 24,206–24,433 places Nifty within a neutral or decision zone.
It’s wise to avoid trades in the first 15–30 minutes and let a clear trend develop.
If price breaks above 24,433 with bullish candles and volume, it confirms strength, and can be bought into, targeting 24,506 – 24,767.
However, a breakdown below 24,206 will push Nifty toward 24,106, where the Last Support for Intraday is located.
Price reactions near these edges offer directional trades, but center-zone trades can lead to whipsaws.
📚 Educational Note: Neutral zone opens often lead to rangebound setups—it's better to wait for range breakouts or rejections at extremes.
🟩 Scenario 3: Gap-Down Opening (Below 24,206)
A gap-down below 24,206 suggests bearish momentum. Watch for early reactions at 24,106, the Last Support for Intraday .
If this level fails to hold, expect prices to test the Buyer’s Support Zone between 23,950–24,050 .
A reversal trade can be taken from this demand zone only if bullish candles (e.g., hammer or bullish engulfing) appear , along with rising volume.
However, if selling continues below 23,950, it could lead to further downside panic and breakdown structure.
Avoid knife-catching unless a solid reversal structure forms. Shorts can be re-entered on pullbacks to 24,106 after breakdown.
📚 Educational Note: Bearish gap-downs can give strong follow-through moves but can also trap sellers if reversal zones hold firm. Wait for confirmation.
🛡️ Options Risk Management Tips for Intraday Traders 🧠
Always trade with a defined stop-loss —preferably based on candle structure or volatility-based levels.
Don’t overtrade. 2–3 quality trades per day are better than chasing every move.
In high IV environments, prefer spreads (Bull Call / Bear Put) over naked options to reduce premium decay.
Use deep OTM options only for directional plays when momentum is strong and in your favor.
Avoid entering options trades in the first 5–10 minutes of the day—premiums are inflated due to uncertainty.
Always have a capital allocation strategy ; avoid putting more than 2% of capital in any single high-risk intraday options trade.
Don’t emotionally convert intraday trades into swing positions. Have a plan before the market opens.
📌 Summary & Conclusion 🎯
✅ Gap-Up Opening: Focus on 24,433 breakout. Above 24,506, trend may extend. But watch for false breakouts.
✅ Flat Opening: Avoid trading inside 24,206–24,433. Wait for breakout from the range.
✅ Gap-Down Opening: Focus on 24,106 support. Breakdown may bring 23,950–24,050 zone in play. Avoid longs without confirmation.
🧘♂️ Trade with patience and let the market give you setups—don’t rush into trades based on emotions. Structure, confirmation, and discipline are key.
⚠️ Disclaimer:
I am not a SEBI-registered analyst. This analysis is shared purely for educational purposes. Please consult a certified financial advisor before making any trading decisions.
#nifty50 ANALYSIS FOR TOMORROWNSE:NIFTY
#nifty50 ANALYSIS FOR TOMORROW 🔺
❇️ IMPORTANT LEVELS 🚀
❇️ Support: 24235-24086-23925-23807
❇️ Resistance: 24321-24450-24522
👉🏻 PURPLE LINE: 24235-24200 is a key level for buying and selling.
👉🏻 thetradeforecast 🇮🇳

NIFTY : Trading levels and plan for 29-Apr-2025📈 NIFTY 15-Min Plan for 29-Apr-2025 📈
(Chart-Based Educational View | Gap Opening >100 Points Considered)
➖➖➖➖➖➖➖➖
🔵 Previous Close: 24,312.90
⚡ Key Reference Levels:
🔴 Opening Resistance: 24,417 – 24,433
🟧 Opening Support/Resistance: 24,254
🟩 Last Intraday Support: 24,071 – 24,106
🟢 Major Resistance Above: 24,556
➖➖➖➖➖➖➖➖
🟥 Scenario 1: Gap-Up Opening (Above 24,400)
If Nifty opens above 24,400, especially near the 24,417–24,433 resistance zone, watch closely for price action.
If there’s rejection or bearish candles near this zone within the first 15–30 minutes, it could signal a good opportunity for short trades towards 24,307 and 24,254.
However, if Nifty sustains above 24,433 with strong bullish momentum and volume, a quick move towards 24,556 can occur.
In case of breakout buying, place a strict stop-loss just below 24,400 to protect from false breakouts.
📚 Educational Note: In gap-up scenarios near a resistance zone, the first bounce often traps aggressive buyers. Wait for confirmation (retest or strong breakout candle) before entry!
➖➖➖➖➖➖➖➖
🟨 Scenario 2: Flat Opening (Between 24,200–24,400)
If Nifty opens between 24,254–24,312, the market is likely to retest either side.
Key focus: 24,254 opening support level.
A bounce from 24,254 area can be bought for targets of 24,417–24,433 with stop-loss slightly below 24,240.
Breakdown and sustained trade below 24,254 can lead to a dip toward 24,106–24,071 zone. Short opportunities will arise if opening support fails clearly.
📚 Educational Note: In flat openings, traders must avoid rushing in. Let the market show clear strength or weakness around the immediate support/resistance levels.
➖➖➖➖➖➖➖➖
🟩 Scenario 3: Gap-Down Opening (Below 24,200)
If Nifty opens below 24,200, particularly around 24,100–24,070 zone, it would directly test the Last Intraday Support .
If there are bullish reversal signals (strong green candles or bullish divergence) around 24,071–24,106, a risky but rewarding buy opportunity can be considered.
However, failure to sustain above 24,071 will create strong bearish momentum aiming towards lower targets (like 23,950–23,900).
In gap-downs, extra caution must be applied. Avoid aggressive longs unless a strong reversal setup forms.
📚 Educational Note: Gap-downs often invite emotional trades. Avoid knife-catching unless the setup is clear and risk-reward is favorable.
➖➖➖➖➖➖➖➖
📌 Risk Management Tips for Options Trading 🛡️
Always define your stop-loss before entering a trade. Options premiums can decay rapidly!
Avoid trading within the first 5 minutes of opening volatility. Let the direction stabilize.
Prefer using spreads (like Bull Call Spread or Bear Put Spread) to reduce the impact of time decay and volatility crush.
Risk only 1–2% of your trading capital per trade. Survival is key over daily wins.
Exit if the trade doesn't behave as per your plan in the first 15-30 minutes after trigger.
➖➖➖➖➖➖➖➖
📜 Summary and Conclusion:
✅ Gap-Up Opening: Watch 24,417–24,433 zone carefully. Sell on rejection or buy breakout confirmation.
✅ Flat Opening: Key level is 24,254 – play the bounce or breakdown.
✅ Gap-Down Opening: 24,071–24,106 crucial for reversal or further fall.
🧠 Be patient, act only after clear confirmation, and strictly manage risk.
➖➖➖➖➖➖➖➖
⚠️ Disclaimer:
I am not a SEBI-registered analyst. This trading plan is shared purely for educational purposes. Please consult your financial advisor before taking any trading decision.
