NIFTY ON THE EDGE - BEARISH PRESSURE MOUNTING NEAR 24250Symbol - NIFTY50
CMP - 24245
The Nifty50 index has encountered significant sell-off near the 26300 level, its all-time high from September 2024. Following this peak, the index experienced a notable correction, currently trading approximately 10% below its previous high. This decline has been attributed to factors such as disappointing corporate earnings, elevated valuations, and geopolitical uncertainties. Despite these challenges, the index has shown resilience, supported by strong performances in domestic sectors like financials, consumer staples, and healthcare.
If bearish pressures persist and buyers fails to maintain above 24300-24400 levels, a further decline towards the 23000-22900 levels could occur. Conversely, sustained move above 24550 could pave the way for a potential rally, contingent on improved earnings and favorable macroeconomic conditions.
Key Resistance Levels: 24320, 24400
Key Support Levels: 24000, 23780, 23350
In summary, the Nifty50's near-term trajectory hinges on its ability to navigate key support and resistance levels, with broader market sentiment and sectoral performances playing pivotal roles in shaping its path forward. In my personal view, I am expecting a down move, and the index is likely to remain under bearish pressure in the coming sessions, especially if it fails to hold above 24300-24400 levels.
Niftylevels

Bank nifty Futures 28.04.25I would expect a gap down opening. however, incase not gap down I would still prefer to sell on rise. For this important locations/ absorption/ trap of buyers would be seen. In case I do not find things going as planed I will prefer to stay out. Bearishness is still predominant.

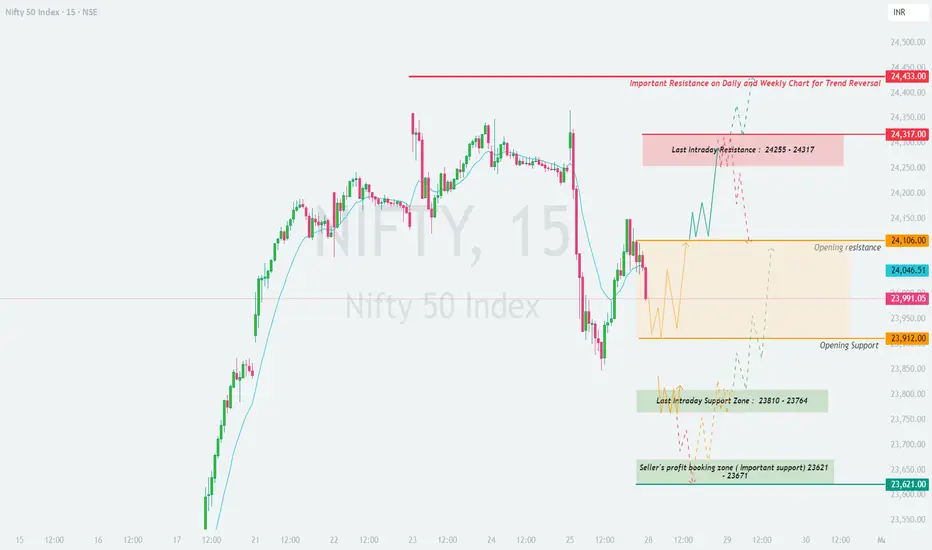
NIFTY : Trading Levels and Plan for 28-Apr-2025📊 Nifty 50 Trading Plan for 28-Apr-2025 (15-min TF Analysis)
Previous Close: 23,991.05
Key Zones:
🔴 Major Resistance Zone: 24,255 – 24,317
🟥 Critical Reversal Level: 24,433 (Daily and Weekly Importance)
🟧 Opening Resistance: 24,106
🟨 Opening Support: 23,912
🟩 Last Intraday Support Zone: 23,810 – 23,764
🟦 Important Support (Seller’s Booking Zone): 23,621 – 23,671
🟥 Scenario 1: Gap-Up Opening (Above 24,100)
If Nifty opens more than 100 points higher , around or above 24,100 , we will be near the Opening Resistance (24,106) or trying to push towards the Last Intraday Resistance Zone (24,255–24,317) .
If Nifty struggles near 24,106 and forms rejection candles (wicks, bearish engulfing), a low-risk short opportunity could arise aiming back towards 23,991–23,950 zones.
On the flip side, if price sustains and shows strength above 24,255 , a breakout trade can be initiated with an eye on the 24,433 critical resistance zone.
Strong bullish candles with volume confirmation are essential to attempt longs beyond 24,255 .
Be cautious around 24,433 as it is a major trend reversal zone on higher timeframes. Partial profit booking recommended.
🧠 Educational Tip: Gap-ups into major resistances often lead to profit booking unless there is a strong continuation pattern. Avoid buying blindly on opening candles without confirmation.
🟨 Scenario 2: Flat Opening (Between 23,900 – 24,100)
If Nifty opens flat or with a minor gap (within 100 points), we will remain between Opening Support (23,912) and Opening Resistance (24,106) .
If Nifty trades above 23,991 and crosses 24,046 with strength, a buy setup can be considered targeting 24,106 and potentially 24,255 .
If it fails to hold 23,991 and starts slipping below 23,950 , expect a quick dip towards the Opening Support (23,912) .
A confirmed breakdown below 23,912 could push the index lower toward the Last Intraday Support Zone (23,810–23,764) .
In a flat opening, trade based on clear breakout or breakdown of initial 15–30 minute range. No pre-commitment bias!
🧠 Educational Tip: Flat openings often lead to range-bound movements initially. Avoid over-trading inside choppy zones. Wait for clear directional cues.
🟩 Scenario 3: Gap-Down Opening (Below 23,900)
If Nifty opens below 23,900 , the focus immediately shifts to the Opening Support (23,912) and the Last Support Zones (23,810–23,764) .
If Nifty stabilizes around 23,810–23,764 with bullish reversal patterns (hammer, bullish engulfing), aggressive long entries could be initiated targeting 23,950–24,000 .
However, if breakdown continues below 23,764 , expect an extended fall toward the major support Seller's Profit Booking Zone (23,621–23,671) .
Look for strong price action near 23,621–23,671 as it may trigger a bigger reversal if buyers step in aggressively.
Avoid catching falling knives. Let price form a base before attempting counter-trend trades.
🧠 Educational Tip: In gap-downs, volatility spikes. Focus on fewer trades with better setups rather than forcing trades during emotional market reactions.
⚡ Risk Management Tips for Options Traders:
🔒 Always have a pre-defined stop loss . Never risk more than 1–2% of your trading capital on a single trade.
💸 In case of a flat or range-bound market, avoid holding naked option buys for too long as theta decay will eat premiums.
⚖️ Use option spreads (like bull call spreads or bear put spreads) to limit loss and protect against volatility crush.
📈 Stick to current week expiries for intraday trades but prefer next week expiry if volatility is extremely low.
⏳ Avoid trading in the first 5 minutes unless extremely clear breakout or breakdown is seen.
📌 Summary and Conclusion:
🟥 Gap-Up Opening: Watch 24,106 and 24,255 closely for breakout or rejection plays.
🟨 Flat Opening: Wait for clear breakout above 24,046 or breakdown below 23,912 .
🟩 Gap-Down Opening: Focus on price reaction around 23,810–23,764 and 23,621–23,671 .
Patience 🧘♂️, risk management 🛡️, and discipline 📚 are your best trading allies. Trade based on price action, not assumptions.
⚠️ Disclaimer: I am not a SEBI-registered analyst . All views shared are purely for educational purposes only . Please consult your financial advisor before taking any trading or investment decisions. 📚
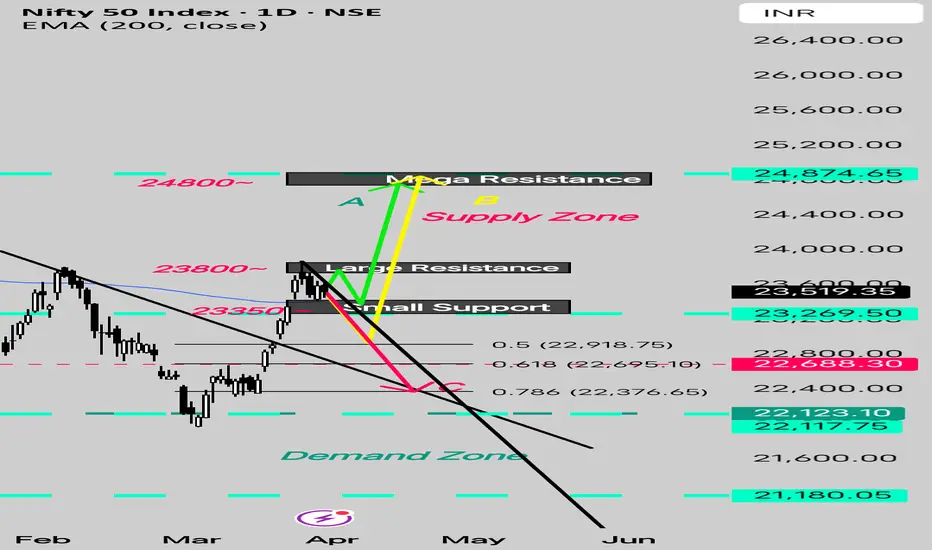
Nifty Finds a Minor Resistance at 23800, What Next?Scenario B From Last Weekly Analysis played out as expected and continues to be in the Play.
The Pullback from 23800 Zone has been shallow as week closed above the Minor Resistance turned Support at 23350 Zone, despite a Long Weekend.
This Indicates Bulls have some Conviction of taking Nifty higher from Minor Support at 23350 Zone.
However a Weekly Candle Suggests Indecision.
So Let's be prepared for 3 Scenarios like last Week.
Scenario A - Minor Support at 23350 (200DEMA) holds and Nifty Blasts off to Mega Resistance
Scenario B - Minor Support breaks and Nifty Goes for a Healthier correction towards 0.5 0.6 Fib retracement (23000) and takes support here.
Scenario C - Weakness in Price action with Nifty testing 22500 0.78 Fib retracement and Trendline, This would indicate prolonged period of Consolidation before next Trending Move.
Technical Analysis suggests that Scenario A is more likely to play out.
But as market always knows how to Surprise us, be prepared for either of The Scenarios A B C.
Share your Thoughts and Views to make most of this Article.
Nifty +2% move will happen from here!!! ReadyNIFTY is moving upwards after the morning fall
So I am targeting 24500 and above.
Try to catch with your model
Comment your thoughts

Nifty trade idea 1:2.5 RRNifty nice rejection from the OB
I am expecting market to reach 24500 area around +2% move.
It's my own view, probability is the way to win the game in long term.
Comment your thoughts.

Bank Nifty Futures 25.04.25Expecting a gap down opening. My Strategy will be to sell on rise. Will be following MP and OF. Will be taking Trades at important areas / as per absorption of buyers.

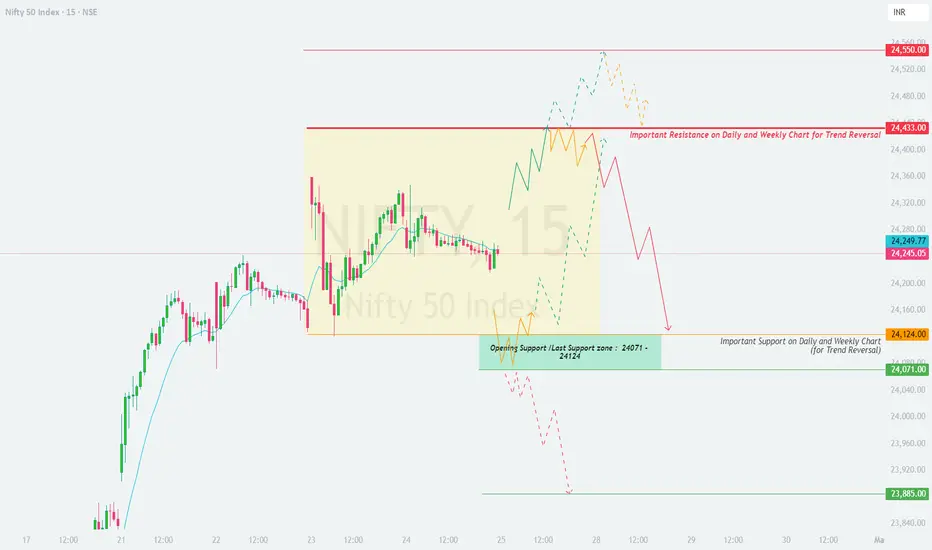
NIFTY : Trading Levels and Plan for 25-Apr-2025📊 NIFTY Intraday Trading Plan – 25-Apr-2025
Timeframe: 15-minute
Previous Close: 24,245.05
📍 Key Reference Zones from Chart:
🟧 Consolidation Range: 24,124 – 24,433
🔴 Major Resistance Zone: 24,433 – 24,550
🟩 Strong Support Zone: 24,071 – 24,124
🟥 Breakdown Area: Below 24,071
🟢 Potential Reversal Point: 23,885
🟥 Scenario 1: Gap-Up Opening (Above 24,345 – i.e., +100 points)
If Nifty opens above 24,345, it steps into the upper band of the prior consolidation, moving closer to the critical resistance zone of 24,433–24,550 . This area holds weight as it aligns with daily and weekly chart resistance .
If Nifty opens near 24,433 and shows signs of rejection (bearish candle patterns like shooting star, bearish engulfing), a mean-reversion short trade could be attempted. Potential targets: 24,303 and 24,245.
Only go long if the index sustains above 24,433 for 15+ minutes and builds strength. In such a case, the next target would be 24,550.
If it opens above 24,433 and directly spikes to 24,500+, avoid chasing. Wait for a pullback or base building] for better R/R entries.
💡 Educational Insight: High-resistance zones require confirmation. Gaps alone are not breakout signals – price must sustain above these levels with volume for reliable entries.
🟨 Scenario 2: Flat Opening (Between 24,145 – 24,345)
A flat opening places Nifty within the previous session's consolidation range, where sideways action has dominated. This is a tricky zone, best approached with caution and breakout confirmations.
Avoid trades in the immediate zone of 24,245 – 24,287 unless price gives a clear breakout or breakdown. This is a No Trade Zone .
If the index breaks above 24,303 with momentum and sustains, consider a long with target 24,433 and SL just below 24,280.
If Nifty breaks below 24,124, short entries could be initiated with targets at 24,071 and 23,885, provided the breakdown is supported by volume and wide candle closes.
This is an ideal situation for zone-to-zone scalping based on price behavior.
💡 Educational Insight: Inside consolidation zones, it's better to react than predict. Let price guide you through support/resistance breaks with follow-through.
🟩 Scenario 3: Gap-Down Opening (Below 24,145 – i.e., -100 points)
A gap-down places Nifty closer to the strong support zone of 24,071–24,124 . This is a demand area on both intraday and higher timeframes.
Watch for reversal patterns (like hammer or bullish engulfing) inside 24,071–24,124. This zone can offer high R/R intraday longs with targets at 24,245 and SL below 24,050.
If price breaks and sustains below 24,071, it opens doors for deeper correction toward 23,885. Avoid early shorts; wait for breakdown + retest + rejection pattern.
The zone 24,071–24,124 also aligns with weekly trend support, so expect volatility and fight here. Be patient.
💡 Educational Insight: Strong supports often show bounce-back reactions. Always wait for confirmation before initiating reversal trades.
🛡️ Options Trading Risk Management Tips:
📉 Avoid buying deep OTM options during sideways or slow markets. Use spreads for better theta control.
📆 Keep expiry day trades strictly defined – don’t average losing positions.
📈 In strong trends, consider buying ITM options or vertical spreads to capture the move without unlimited risk.
🧠 Don’t revenge trade. Respect stop losses and accept that every setup won't work.
💰 Never risk more than 2% of your capital in a single trade.
⏳ Allow the first 15–30 minutes for market to settle before taking directional trades, especially post gap openings.
📘 Summary & Conclusion:
🟥 Gap-Up: Watch 24,433 as key resistance. Short on rejection; long only if breakout sustains.
🟨 Flat Open: Avoid trades in no-trade zone. Breakout above 24,303 = bullish, breakdown below 24,124 = bearish.
🟩 Gap-Down: Strong support around 24,071–24,124. Long on bullish reversal, short below 24,071 for 23,885 target.
🎯 Trade with structure and patience. Avoid noise. Let the levels guide your actions, and not emotions or impulses.
⚠️ Disclaimer: I am not a SEBI-registered analyst . This trading plan is shared purely for educational purposes only . Please consult your financial advisor before making any trading or investment decision.
Bank nifty Futures 24.04.25Expecting a flat to a gap up opening. More likely a neutral/ balanced day. Buyers are going to struggle but may defend. So, need to be careful and watch OF and MP. We may get movement on both sides.

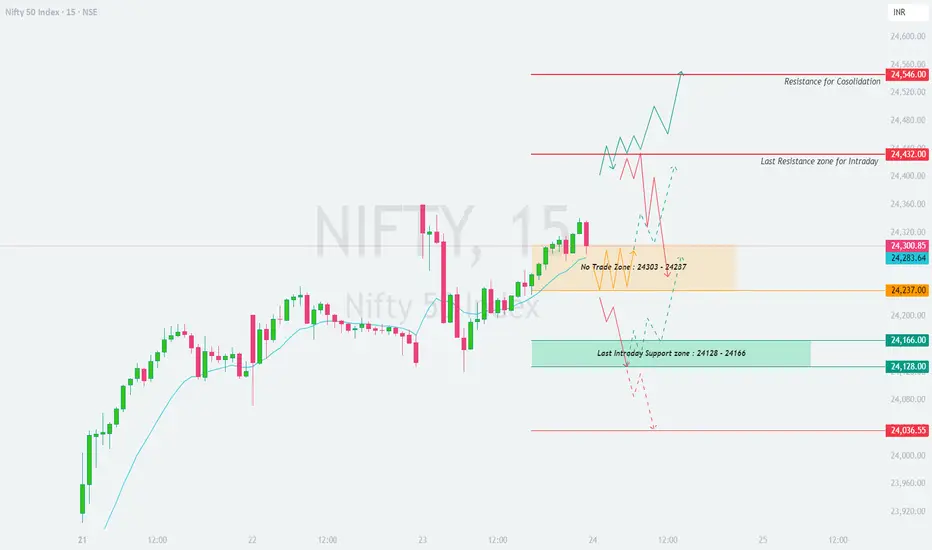
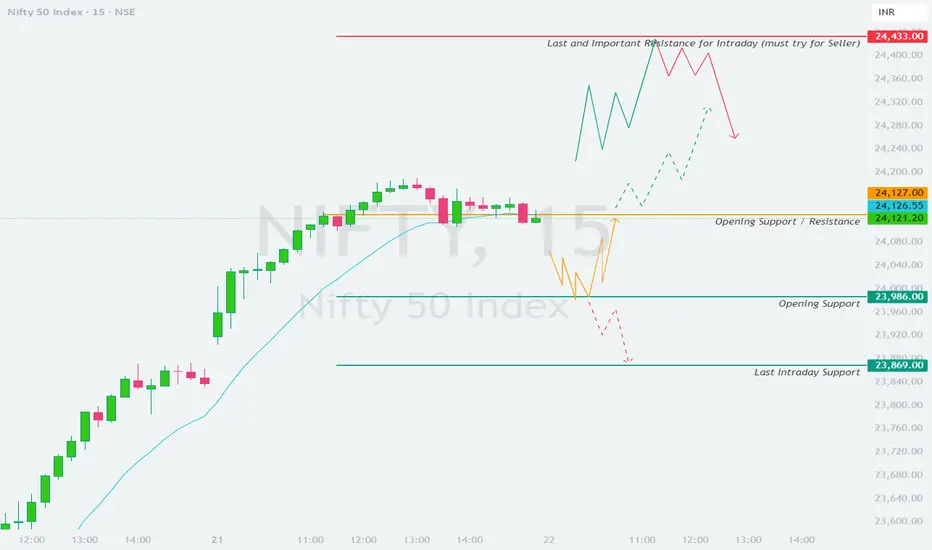
NIFTY : Trading Levels and Plan for 24-Apr-2025📊 NIFTY Intraday Trading Plan – 24-Apr-2025
Timeframe: 15-minute
Previous Close: 24,300.85
🔍 Key Zones from the Chart:
🟧 No Trade Zone: 24,287 – 24,303
🔴 Last Resistance for Intraday: 24,432
🟥 Resistance for Consolidation Breakout: 24,546
🟨 Immediate Support: 24,237
🟩 Last Intraday Support Zone: 24,128 – 24,166
🟥 Major Breakdown Level: 24,036.55
🟥 Scenario 1: Gap-Up Opening (Above 24,401 – i.e. +100 points)
If Nifty opens above 24,401, it is entering the upper band of the chart near the Last Resistance Zone . This area is sensitive and needs confirmation before aggressive trades.
If price shows rejection near 24,432 (like inverted hammer or bearish engulfing), it signals a mean reversion setup . Traders may short with targets at 24,303 and 24,237.
If price sustains above 24,432 and breaks out with volume, Nifty may rally toward 24,546. Wait for 15-min candle close above 24,432 before initiating long trades.
Avoid longs if price opens with a big green candle directly in the resistance – wait for consolidation or a pullback entry.
💡 Pro Tip: Avoid buying the first candle of a gap-up unless a pullback occurs. Let the bulls prove themselves beyond the resistance.
🟨 Scenario 2: Flat Opening (Between 24,287 – 24,401)
A flat opening brings Nifty within or around the No Trade Zone . This is a choppy zone due to overlapping candles and indecisiveness in previous sessions.
Avoid trades inside 24,287 – 24,303. Wait for either a breakout above 24,303 or a breakdown below 24,287 for directional clarity.
If price breaks above 24,303 and sustains, consider a quick long entry with target 24,432 and SL below 24,280.
If price slips below 24,287 and sustains, short setups activate toward 24,237 first, and potentially 24,166 later.
This is an ideal day for zone-to-zone scalping , with defined stop losses and profit targets.
💡 Pro Tip: Inside No Trade Zones, avoid impulsive entries. Use breakout-retest strategy or follow momentum confirmation before entering a trade.
🟩 Scenario 3: Gap-Down Opening (Below 24,200 – i.e. -100 points)
A gap-down below 24,200 puts Nifty directly near Intraday Support Zone (24,128 – 24,166) . This area can witness buyer interest, but if it breaks, the trend may shift bearish.
Look for reversal signs in the support zone (24,128 – 24,166). A bullish candle or divergence on RSI can trigger quick scalps toward 24,237.
If support fails and price sustains below 24,128, the next major breakdown level is 24,036.55. Short trades below 24,128 can be initiated with SL above 24,170.
Do not chase gaps down blindly – reversal or breakdown confirmation is crucial.
💡 Pro Tip: Buyer zones offer great reward-to-risk setups. Wait for bullish confirmation like hammer candles, bullish engulfing, or higher low formation before entering.
🛡️ Risk Management Tips for Options Traders:
✅ Always have a pre-defined SL for both directional and non-directional option strategies.
📉 Avoid naked option buying in choppy markets – use spreads (Bull Call / Bear Put) to minimize theta decay.
🕐 Don’t hold positions into the last 30 mins of expiry unless you’re in strong profit or have hedged protection.
💰 Never risk more than 2% of your capital in a single trade – it keeps your mindset calm and objective.
🔄 Adjust your trades as market structure changes – follow price, not your bias.
📘 Summary & Conclusion:
🟥 Gap-Up: Watch 24,432 as a decision point. Rejections offer shorting opportunity; Breakouts offer bullish setups.
🟨 Flat Open: Avoid trades in 24,287–24,303. Play breakout or breakdown from this zone with confirmation.
🟩 Gap-Down: Support expected near 24,128–24,166. Wait for bullish signs or short below breakdown levels.
🎯 The day should be traded zone-to-zone with proper confirmation. Patience in entries and discipline in exits is key to success. Avoid emotional trading.
⚠️ Disclaimer: I am not a SEBI-registered analyst . This trading plan is shared purely for educational purposes . Please do your own research or consult a qualified advisor before making any trading or investment decisions.
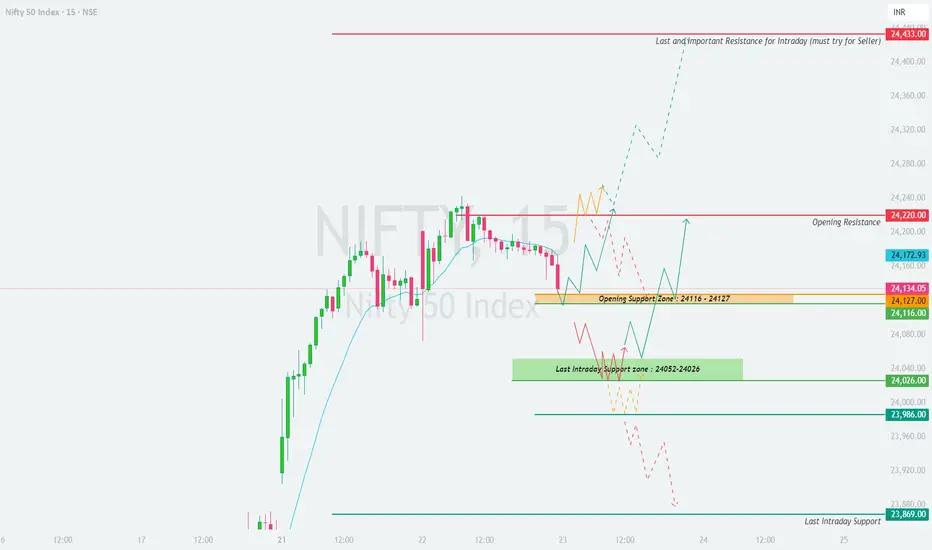
NIFTY : Trading levels and Plan for 23-Apr-2025📊 NIFTY Intraday Trading Plan – 23-Apr-2025
Timeframe: 15-minute
Previous Close: 24,134.05
📌 Key Zones Marked on the Chart:
🟥 Opening Resistance: 24,220
🔴 Major Resistance Zone (Short opportunity): 24,433
🟧 Opening Support Zone: 24,116 – 24,127
🟩 Last Intraday Support Zone: 24,052 – 24,026
🔵 Final Intraday Support: 23,869
🟥 Scenario 1: Gap-Up Opening (Above 24,234 – i.e. +100 points)
If Nifty opens above 24,234, it will be above the immediate resistance zone of 24,220. This brings it closer to the 24,433 level — a last-resort intraday resistance that’s a key zone for aggressive short sellers.
Watch for price behavior near 24,433. If Nifty gives wick rejections or bearish engulfing candles , this is a low-risk shorting opportunity.
Targets on downside would be 24,220 and 24,127, with a stop loss above 24,470.
If price consolidates above 24,433 for more than 30 minutes, expect a breakout toward 24,500+. Use a bull call spread instead of naked options to control risk.
💡 Educational Note: Strong opening gaps tend to invite profit booking near supply zones. Always wait for price confirmation before entering.
🟨 Scenario 2: Flat Opening (Between 24,127 – 24,220)
This scenario keeps Nifty in a neutral yet sensitive range between the support and resistance levels. Traders should be patient and wait for breakout or breakdown confirmation.
If Nifty breaks above 24,220 with volume, it may attempt 24,300–24,433. Buy with a tight SL of 24,170.
If Nifty sustains below 24,116, price may drift towards 24,052 – 24,026. Consider puts or bear spreads below 24,116.
Avoid initiating trades in the first 15 minutes. Let the market structure itself after opening volatility.
💡 Educational Note: In flat openings, the first 3 candles of the day often decide direction. Focus on volume and price range contraction or expansion for clues.
🟩 Scenario 3: Gap-Down Opening (Below 24,034 – i.e. -100 points)
A gap-down below 24,034 will place Nifty directly into the Last Intraday Support Zone: 24,052 – 24,026 . This is a critical area for reversal setups or further breakdown.
If this zone holds and we see a bullish hammer or strong green engulfing candle, a counter-trend bounce toward 24,116 is possible.
If Nifty breaks below 24,026 and sustains, watch for a fall to 23,986 or even 23,869. This is a bearish momentum zone.
Avoid long trades until the price forms a base above 24,026 again.
💡 Educational Note: A gap-down into a known support zone creates high emotion. Don’t be tempted to buy blindly – always wait for support-holding confirmation .
🛡️ Options Trading Risk Management Tips
Always use defined SL (stop loss) while trading directional options.
Avoid trading OTM options alone on Wednesdays and Thursdays due to higher theta decay.
Use spreads like Bull Call / Bear Put to reduce cost and hedge risk.
Do not take trades based on bias. Let price structure guide your decision.
Never risk more than 2–3% of your capital per trade , especially in volatile conditions.
📘 Summary & Conclusion
📍 Important Levels:
🔺 Resistance: 24,220 | 24,433
⚠️ Opening Support: 24,116 – 24,127
🔻 Lower Supports: 24,052 | 24,026 | 23,986 | 23,869
🎯 On 23-Apr-2025, observe the first 15-minute candle carefully for structure. Trade only on confirmed breakout/breakdown from defined zones .
Use well-hedged strategies when near volatile support/resistance levels. Keep emotions in check and stay adaptive.
⚠️ Disclaimer: I am not a SEBI-registered analyst . This trading plan is shared purely for educational purposes . Please consult your financial advisor before making any trading decisions.
Nifty interesting factMost of the times, Nifty used to test Simple Moving average 20, atleast once a week in 1Hour chart.Lets see what happens tomorrow.

Nifty50 Index Analysis 22nd AprilNifty50 Index Analysis 22nd April
Current resistance is minimal important.
Importance of the today's candle and it's closing.
What would be the next step and level to observe.
How to manage your stock selection on resistance.
Use resistance to re-select your sector and stocks.
- All above points are discussed in the above Video Analysis.

Bank nifty Futures 22.04.25Expecting a gap up opening. Will be following buy on dip. Will look for buying at important points and follow MP and OF. Expecting balanced day.

NIFTY : Trading Levels and Plan for 22-Apr-2025📘 NIFTY TRADING PLAN – 22-Apr-2025
📊 Index Spot Close: 24,121.20 | ⏱ Timeframe: 15-Min | 🚪 Gap Opening Threshold: 100+ Points
🔼 Scenario 1: Gap-Up Opening (Above 24,221+)
A gap-up opening above 24,221 will push Nifty into a zone where sellers will likely get active. The chart highlights 24,433 as a "must try for sellers" level — this acts as the last important intraday resistance. Sustained movement beyond this level would be a bullish breakout, but chances of intraday reversal increase as price nears this resistance.
📌 Plan of Action:
Wait for the first 15–30 minutes to settle the gap-up volatility. Don't chase the first green candle.
If price sustains above 24,221 and starts climbing toward 24,433, watch for a rejection wick or bearish engulfing candle near that level to plan shorts.
Ideal short opportunity arises if price touches 24,433 and then shows weakness — keep SL just above 24,460, target could be 24,280 → 24,127.
If price consolidates above 24,433 without signs of exhaustion, consider it a bullish continuation setup. In that case, adopt a breakout-retest strategy with SL below 24,400.
Aggressive buyers can look for retest around 24,221–24,280 zone for a possible long setup toward uncharted zones.
💡 Educational Insight:
Gap-ups near major resistances are tricky — markets often use such openings for distribution. Watch price behavior at key levels instead of assuming breakout or reversal in advance.
⚖️ Scenario 2: Flat Opening (Between 24,020 – 24,221)
A flat opening within this range keeps Nifty in the current supply zone. The chart shows that 24,127 acts as a critical structure – previously both as resistance and a congestion area.
📌 Plan of Action:
Let the market settle. If price holds above 24,127 for 15–30 minutes, intraday strength may follow toward 24,221 → 24,280.
Longs can be initiated above 24,150 with tight SL below 24,120 and targets near 24,221.
On the flip side, if Nifty starts rejecting 24,127, consider intraday shorts with SL above 24,150. Target on downside could be 24,000 → 23,986.
Be cautious about trading within a choppy range of 24,050–24,127 – breakout or breakdown from this area will provide cleaner moves.
Wait for directional confirmation through volume and momentum indicators like RSI or VWAP reaction.
💡 Educational Insight:
Flat openings near previous congestion levels often offer clean breakouts or breakdowns. Let the price action confirm direction – patience pays in such setups.
🔽 Scenario 3: Gap-Down Opening (Below 24,020–23,986)
A gap-down below the 23,986 support area would indicate potential profit booking or intraday reversal. The key support to monitor is 23,869 – labeled as "last intraday support" on your chart.
📌 Plan of Action:
Do not enter trades immediately on the gap-down. Let the price show its intent in the first 15–30 mins.
If price sustains below 23,986 and breaks 23,869, intraday weakness can accelerate with downside targets at 23,800 → 23,720.
Intraday shorts can be initiated on breakdowns below 23,869 with SL above 23,900.
If price bounces back and reclaims 23,986, avoid fresh shorts — this could be a trap for sellers.
Aggressive reversal traders can look for bullish price action near 23,869 — a hammer or bullish engulfing candle with volume might offer a low-risk bounce trade toward 24,000.
💡 Educational Insight:
Gap-downs into key support zones often trap emotional sellers. Let price confirm breakdown — don’t assume it. Wait for candle confirmation before acting.
🛡️ Risk Management Tips for Options Traders 💼🧠
✅ Don’t trade first 15–30 minutes — let the market show intent.
✅ Use ITM or ATM options for better delta and less time decay.
✅ Position sizing is key — don’t risk more than 1–2% of capital on one trade.
✅ Avoid revenge trading — step back after a loss and reassess.
✅ Avoid averaging losers — have a clear SL and respect it.
✅ Don’t chase moves — especially after gaps; wait for retests.
✅ Maintain a trading journal — log entry/exit and reason behind trade.
✅ In volatile markets, hedge directional bets with spreads if needed.
🧾 Summary & Conclusion 🧠📊
📍 Gap-Up (Above 24,221): Sellers may get active near 24,433; watch for reversal signs.
📍 Flat Open (24,020–24,221): Critical level is 24,127 — breakout leads to 24,280, rejection leads to 23,986.
📍 Gap-Down (Below 24,020): Breakdown below 23,869 can trigger further fall; else, watch for bounce attempts.
📍 Zone to Monitor Closely: 24,127 and 23,986 — act as pivotal levels for intraday structure.
🧘♂️ Final Note: Trade levels, not emotions. Capital protection is the first job of a trader. Stick to your process and trust your risk management — opportunities will come.
⚠️ Disclaimer:
I am not a SEBI-registered analyst . This trading plan is prepared purely for educational purposes only . Kindly consult with your financial advisor before making any investment or trading decisions. Markets involve risk — please use strict stop-loss and position sizing.
22 April nifty trading zone#Nifty50 #option trading
99% working trading plan
👉Gap up open 24238 above & 15m hold after positive trade target 24508,
👉Gap up open 24008 below 15 m not break upside after nigetive trade target 24008, 23853
👉Gap down open 24008 above 15m hold after positive trade target 24238 , 24508
👉Gap down open 24008 below 15 m not break upside after nigetive trade target 23853, 23653
💫big gapdown open 23853 above hold 1st positive trade view
💫big Gapup opening 24508 below nigetive trade view
📌 Trade plan for education purpose I'm not responsible your trade
More education follow & support me

NSE: ICICIPRULI Nears Key Resistance – Breakout Ahead?ICICIPRULI (NSE: ICICIPRULI) is consolidating near a critical resistance level of ₹606. For a bullish setup:
🔹 Trigger: Wait for a strong green candle closing decisively above ₹606 with elevated volume to confirm bullish conviction.
🔹 Targets: ₹643 (Initial) → ₹668 (Mid-Term) → ₹701 (Extended) → ₹776 (Final Target).
🔹 SL: Low of the breakout candle (strict risk management).
Why This Works:
Pure price-action strategy: Focus on key levels and volume-driven momentum.
Clear risk-reward hierarchy: Final target aligns with historical swing extensions.
This post is for educational/informational purposes only and not financial advice. Trading stocks/derivatives carries high risk. Past performance does not guarantee future results. Always conduct your own research and consult a licensed financial advisor before trading. The author assumes no responsibility for losses incurred based on this content.

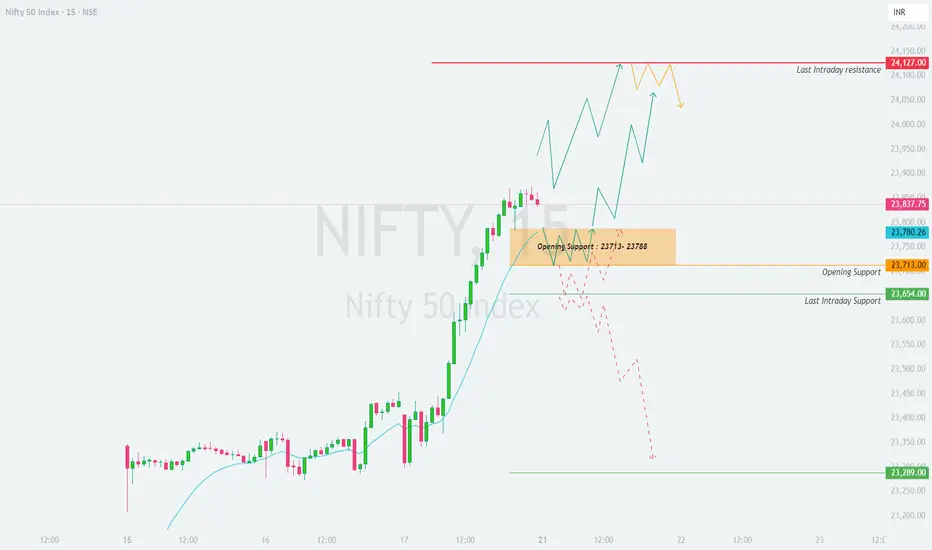
NIFTY : Trading levels and Plan for 21-Apr-2025📘 NIFTY TRADING PLAN – 21-Apr-2025
📊 Index Spot Close: 23,837.75 | ⏱ Timeframe: 15-Min | 🚪 Gap Opening Threshold: 100+ Points
🔼 Scenario 1: Gap-Up Opening (Above 23,938+)
If Nifty opens 100+ points higher above 23,938, it will be trading close to the last intraday resistance marked at 24,127. The recent rally has been steep, so profit booking or resistance can emerge at higher levels. Momentum continuation can only be expected if there is consolidation or retest above breakout levels.
📌 Plan of Action:
Allow the index to settle for the first 15–30 minutes to avoid opening volatility.
If price sustains above 24,000 and breaks above 24,127, aggressive buying can be considered for upside momentum. However, trail SL tightly as price enters uncharted territory.
Be cautious if price opens directly near or inside the 24,127 zone – wait for a rejection or reversal sign before considering any short.
Any gap-up followed by selling pressure that brings price below 23,938 could be a gap-fill trap – consider shorting if structure confirms breakdown.
Upside targets after 24,127 breach could be 24,200+ intraday; however, don't chase trades blindly above resistance.
💡 Educational Insight:
A gap-up near resistance should not be chased blindly. Market may trap bulls before turning. Look for higher-low formations or a bullish flag near 24,000+ to confirm strength.
⚖️ Scenario 2: Flat Opening (Between 23,738 – 23,938)
This is a balanced opening where price opens within or slightly above the critical support zone of 23,713–23,788. This range serves as the launchpad or failure point based on early moves.
📌 Plan of Action:
Let the 15-min candle close; avoid trades in the first few bars unless a clean structure forms.
If price sustains above 23,788 and starts forming higher highs, then the market may attempt a breakout toward 23,938 → 24,127. Longs can be taken above 23,850 with tight SL below 23,788.
On the downside, if price starts slipping below 23,713, this zone becomes resistance. Shorts can be planned with targets: 23,654 → 23,500.
Price trapped within 23,738–23,850 might trigger sideways action. Avoid trading inside this range unless breakout or breakdown occurs.
Look for volume confirmation and a clear directional bias before taking positions.
💡 Educational Insight:
Flat opens near crucial supports often lead to decisive moves after initial range expansion. React, don’t predict. The first breakout (up/down) often defines the tone of the day.
🔽 Scenario 3: Gap-Down Opening (Below 23,713)
A gap-down below the orange zone (23,713–23,788) is significant and could trigger a pullback towards the green support levels 23,654 and potentially 23,289.
📌 Plan of Action:
Let the market absorb the gap-down in the first 15–30 minutes — don’t enter impulsively.
If price bounces and reclaims 23,713, stay away from shorts. Look for reversal patterns (e.g. double bottom or engulfing) for long trades with SL below day’s low.
If price stays below 23,713 and breaks below 23,654, initiate shorts with targets at 23,500 → 23,289.
Watch for bullish traps — don't short blindly at supports. Wait for confirmation candles and volume on breakdowns.
In case of deep gap-down directly near 23,289, wait for reversal signs to attempt any long, else avoid bottom-fishing.
💡 Educational Insight:
Support breaks on gap-downs can be strong, but bear in mind — market makers often trap panic sellers. Be alert for false breakdowns and quick reversals.
🛡️ Risk Management Tips for Options Traders 💼🔐
✅ Avoid trading in first 15–30 mins — volatility traps are common.
✅ Use ATM or slightly ITM options to avoid excessive time decay.
✅ Set SL based on structure, not emotions — eg. previous candle low/high.
✅ Avoid over-leveraging — 1-2% risk per trade is optimal.
✅ Keep a max 2-trade rule per direction — don’t overtrade.
✅ Track IV (Implied Volatility) — spreads work better in high IV setups.
✅ Record your trades — wins teach less, losses teach more.
✅ Avoid revenge trading — take a break after a loss, regain calm.
🧾 Summary & Conclusion 🧠📊
📍 Gap-Up (Above 23,938): Watch for resistance at 24,127, avoid chasing highs without retest.
📍 Flat Open (23,738–23,938): Watch for structure near 23,788; breakout above = bullish, rejection = bearish.
📍 Gap-Down (Below 23,713): Possible downside toward 23,654 → 23,289. Reclaim of 23,713 invalidates shorts.
📍 Zone to Watch Closely: 23,713–23,788 (critical intraday pivot for both bulls & bears).
🧘♂️ Final Note: Trade less, trade well. Market gives opportunities daily — protect your capital so you’re around to take them.
⚠️ Disclaimer:
I am not a SEBI-registered analyst . This trading plan is meant for educational purposes only . Please consult a financial advisor or conduct your own research before making any trades. Trading involves risk — always use proper risk management.
NIFTY ViewNIFTY chart analysis showing general view for coming weeks.
Chart shows its in bearish mode untill it breakout channel. It has more chances to go down before breaking that.

Option trading analaysis=Top Option Trading Indicators
-Relative Strength Index (RSI) The relative strength index (RSI) is one of the most commonly used indicators. ...
-Bollinger Bands. ...
-Intraday Momentum Index (IMI) ...
-Money Flow Index (MFI) ...
-Put-Call Ratio (PCR) Indicator. ...
-Open Interest (OI)

NIFTY 50 - ICT & SMC Analysis (April 9, 2025)🧠 Big Picture Context (Daily Timeframe)
🔍 Structure:
The daily structure is in a macro bearish trend, confirmed by a Change of Character (ChoCH) from a previous higher high.
A market structure shift (MSS) occurred, indicating strong bearish intent.
A major Order Block (OB) around 24,300 – 24,800 has acted as strong supply.
Recent price action shows a rejection from 23,000+ levels, creating a new bearish leg.
🔄 Key Observations:
A clean Fair Value Gap (FVG) from the recent bearish move lies between 22,900 – 23,100, which price may want to revisit.
Price tapped into liquidity pools below previous lows (Sell-side liquidity swept).
Strong reaction up suggests a potential short-term bullish retracement.
🔄 Medium-Term Outlook (4H Chart)
🔍 Structure:
After the sharp bearish move, price made a strong reaction from the 21,800s, suggesting the presence of demand.
A clean PDL (Previous Day Low) sweep followed by BOS (Break of Structure) confirms short-term bullish market structure.
🔄 Current Price Action:
Price filled part of a green FVG (imbalance) and is now retracing from resistance.
The 22,900–23,000 zone contains:
A bearish OB
FVG
VI (Volume Imbalance)
Previous Weekly High (PWH)
→ This confluence makes it a high-probability reversal zone.
📉 Execution Timeframe (1H Chart)
🔍 Structure:
Price has now formed a BOS upwards after taking out liquidity near 21,800 (PDL).
Rally filled lower imbalance (FVG), creating a strong displacement candle and BOS above PDH.
Now consolidating under a supply zone with signs of weakness near 22,550 – 22,700.
🎯 Trade Idea: Sell on Retracement into Premium
📈 Bias: Bearish from premium supply zone.
🛠️ Trade Setup (1H + 4H Confluence):
Type Level/Zone
Entry 22,900 – 23,000 (Red FVG & OB)
Stop Loss Above 23,100 (above OB & VI)
Target 1 22,250 (PDH/imbalance fill)
Target 2 21,800 (PDL sweep area)
Target 3 21,600–21,500 (daily demand zone)
📊 Risk-Reward (Approx):
Risk: ~150 pts (23,100 – 22,950 entry)
Reward: ~400–1,400 pts depending on target
RRR: Minimum 2.5:1 up to 9:1
💡 ICT/SMC Concepts Applied:
Liquidity Sweep: Sell-side liquidity below PDL taken → large move up.
Fair Value Gaps: Price filled FVG and now sits just below another premium FVG.
Order Blocks: Bearish OB around 22,900–23,100 zone expected to act as supply.
PDH/PDL Reactions: Market respected those areas.
Market Structure Shift (MSS): Bearish momentum continues on higher TFs despite short-term rally.
🧭 What to Watch For:
If price breaks and holds above 23,100, this setup becomes invalid – it signals deeper retracement or reversal.
Watch volume or strong rejection candles in supply zone to enter with confirmation (ideal on 15M/5M for sniper entry).
Any clean FVGs left behind as price retraces could be rebalanced before dropping.
📌 Final Thoughts:
This is a classic SMC + ICT short setup after price retraced into premium zone following a strong move down. The confluence of OB, FVG, VI, and PDH makes this zone a high-probability turning point. Wait for confirmation and execute with proper risk management.

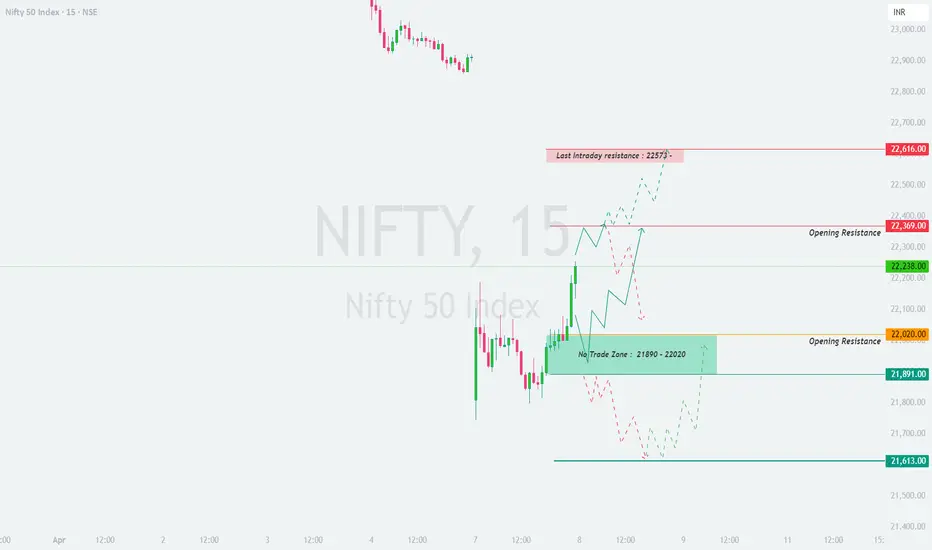
NIFTY : Intraday Trading levels and plan for 08-Apr-2025📊 NIFTY TRADING PLAN – 08-Apr-2025
Chart Timeframe: 15-Minute
Previous Close: 22,238.00
🔍 Key Zones to Watch:
🔴 Last Intraday Resistance: 22,573 – 22,616
🟠 Opening Resistance Zone: 22,369
🟧 Lower Opening Resistance: 22,020
🟩 No Trade Zone: 21,890 – 22,020
🟢 Opening Support Zone: 21,891
🟢 Last Support Zone: 21,613
🔼 Scenario 1: Gap-Up Opening (Above 100+ points, i.e., opens above 22,339)
If Nifty opens above 22,339 , we are above the immediate Opening Resistance and nearing the Intraday Resistance Zone of 22,573 – 22,616 .
📌 Plan of Action:
Wait for the first 15–30 minutes. If the index retests 22,369 and forms a bullish reversal (hammer, bullish engulfing), one can consider going long for targets 22,500 → 22,573 → 22,616 .
If price directly opens around 22,550+ , avoid chasing highs. It may trap long positions. Look for signs of exhaustion near 22,573 – 22,616 .
A breakdown below 22,369 with a 15-min candle close can shift bias to negative — expect a move down to 22,200 → 22,020 .
Do not enter trades immediately at open. Let price develop structure, preferably a retest of breakout level.
💡 Educational Tip: A gap-up near resistance often faces selling pressure. Trade only on confirmation, not assumptions.
⚖️ Scenario 2: Flat Opening (Within 22,138 – 22,339)
A flat open around the previous close 22,238 brings price inside a reaction zone between 22,020 – 22,369 .
📌 Plan of Action:
If Nifty sustains above 22,369 with strong price action, go long for 22,500 – 22,573 – 22,616 .
If price faces resistance at 22,369 and reverses, short opportunities open with targets at 22,138 → 22,020 → 21,891 .
Avoid initiating trades inside the No Trade Zone: 21,890 – 22,020 , as it could lead to choppy price action and stop hunts.
Best strategy is to wait for breakout/breakdown of range and follow the move with a tight SL.
💡 Educational Tip: Sideways zones are often used by big players to trap retail traders. Focus on breakout trades with confirmation.
🔽 Scenario 3: Gap-Down Opening (Below 100+ points, i.e., opens below 22,138)
If Nifty opens below 22,138 , it will likely test the lower boundary of the No Trade Zone or even the Opening Support Zone at 21,891 .
📌 Plan of Action:
Look for buying opportunities only if price finds support around 21,891 – 21,613 with bullish reversal candles (e.g., morning star, double bottom).
If price breaks below 21,891 and sustains, it could fall toward 21,613 — go short on retests or lower high formations.
If reversal is confirmed from support zone, expect a bounce toward 22,020 – 22,138 .
Avoid trading the first candle unless setup is clear. Let price form a base before going long.
💡 Educational Tip: Strong support zones are best used for reversal setups, but only with confirmation and tight stop-loss.
🛡️ Options Trading Risk Management Tips
✅ Avoid Buying Far OTM Options blindly: Theta decay will eat premium fast if price consolidates.
✅ Use Spreads like Bull Call/Bear Put for safer entries: Lower cost and defined risk.
✅ Stick to Defined SL (15-min candle based): Helps avoid whipsaw exits and emotional decisions.
✅ Don’t Overtrade Inside the No Trade Zone: Wait for breakout or breakdown before initiating trades.
✅ Position Sizing is Key: Never risk more than 2% of capital on a single trade.
✅ Watch Option IV Before Entry: High IV → premiums inflated. Sell strategies work better in those conditions.
📌 Summary & Conclusion
Bullish Above: 22,369 → 22,500 → 22,573 → 22,616
Bearish Below: 22,020 → 21,891 → 21,613
No Trade Zone: 21,890 – 22,020
🧠 Best Setups: Reversal near strong support/resistance or breakout retest entries.
⏱️ First 15–30 mins are for observation: Let the market show its hand.
🧘 Discipline > Direction: Stick to process and your setup. Not every candle needs a trade.
⚠️ Disclaimer
I am not a SEBI-registered analyst . The above analysis is shared purely for educational and informational purposes . Please do your own research or consult a financial advisor before trading or investing. Trade responsibly with proper risk management.
NIFTY Prediction for Tomorrow – April 8, 2025What happened on last day:
As we discussed, NIFTY failed to sustain at higher levels and saw a strong rejection from the upper boundary of the falling channel, resulting in a sharp 4% intraday fall.
If we look at the chart now:
The market has decisively respected the resistance of the descending channel (marked in blue) and faced a strong bearish rejection. Price closed near the lower 22,000 zone.
It has fallen below the 13 EMA and 50 EMA , and is now nearing the support zone of 21,800–21,750 , which had previously acted as a bounce zone.
Price is below the 200 EMA and also below VWAP , confirming bearish bias.
RSI = 41 , now heading toward the oversold territory, showing growing weakness.
Volume spiked on the red candle — this shows strength on the downside move.
Support levels: 21,793, 21,162
Resistance levels: 22,200, 22,600, 23,000
If we look at the OI data:
PCR = 0.6 , clearly indicating a bearish stance.
There’s heavy Call writing at 22,000, 22,200, 22,500 and even at 22,600 levels.
Only visible Put OI is at 21,500 and 21,800 — which implies the support has shifted lower.
With INDIAVIX at 20.9 (+7.2 increase) , volatility has spiked, which aligns with today’s sharp move.
We are in the early phase of the April monthly expiry , so OI is still building up, but early bias is clearly negative.
If we look at the news & sentiment:
Global markets saw mild selling pressure due to rising bond yields and risk-off sentiment.
No major positive trigger from domestic macros.
News sentiment turned mildly cautious to negative with today’s fall and spike in volatility.
I am expecting
The market to remain bearish or sideways in the short term. If 21,800 breaks, we may see a move toward 21,160–21,100 zone. Resistance now lies at 22,200 .
Reasons:
❗Price rejected from upper trendline of falling channel
❗Price < EMA(13, 50, 200) confirms bearish momentum
✅ Volume spike on the red candle shows strong sell-off
❗PCR = 0.6 indicates dominant call writing and weak puts
❗INDIA VIX jumped 7.2 points – fear and volatility increasing
Verdict: Bearish or Sideways
Plan of action:
Sell 22,200 CE and 21,800 PE — for a bearish-biased range play.
Watch for breakdown below 21,800 for trend-following trades.
