Nifty levels - Mar 20, 2025Nifty support and resistance levels are valuable tools for making informed trading decisions, specifically when combined with the analysis of 5-minute timeframe candlesticks and VWAP. By closely monitoring these levels and observing the price movements within this timeframe, traders can enhance the accuracy of their entry and exit points. It is important to bear in mind that support and resistance levels are not fixed, and they can change over time as market conditions evolve.
The dashed lines on the chart indicate the reaction levels, serving as additional points of significance to consider. Furthermore, take note of the response at the levels of the High, Low, and Close values from the day prior.
We hope you find this information beneficial in your trading endeavors.
* If you found the idea appealing, kindly tap the Boost icon located below the chart. We encourage you to share your thoughts and comments regarding it.
Wishing you success in your trading activities!
Niftylevels

NIFTY Intraday Trade Setup For 19 Mar 2025NIFTY Intraday Trade Setup For 19 Mar 2025
Bullish-Above 22900
Invalid-Below 22850
T- 23125
Bearish-Below 22680
Invalid-Above 22730
T- 22470
NIFTY has closed on a bold bullish note with 1.45% gain yesterday. 4 days range that we discussed was shifted last day and gave a very good momentum in the upside. Buy targets were achieved almost in flow. Now 22900 looks like a confluence zone as that's 50% retracement from previous swing high in daily TF, may act as resistance. In case it gives pullback breakout then will consider buy. 22680 will be intra support.
Coming to Wednesday's trade setup, if index opens flat and a 15 Min candle closes above 22900 then we will long for the target of 23125.
For selling we need a 15 Min candle close below 22680. T- 22470.
In case of a big gap up/down, wait till 10 o'clock and mark the high and low of the trading range (5MIN). Trade on this range breakout.
==========
I am Not SEBI Registered
This is my personal analysis for my personal trading. Kindly consult your financial advisor before taking any actions based on this.

Nifty levels - Mar 19, 2025Nifty support and resistance levels are valuable tools for making informed trading decisions, specifically when combined with the analysis of 5-minute timeframe candlesticks and VWAP. By closely monitoring these levels and observing the price movements within this timeframe, traders can enhance the accuracy of their entry and exit points. It is important to bear in mind that support and resistance levels are not fixed, and they can change over time as market conditions evolve.
The dashed lines on the chart indicate the reaction levels, serving as additional points of significance to consider. Furthermore, take note of the response at the levels of the High, Low, and Close values from the day prior.
We hope you find this information beneficial in your trading endeavors.
* If you found the idea appealing, kindly tap the Boost icon located below the chart. We encourage you to share your thoughts and comments regarding it.
Wishing you success in your trading activities!

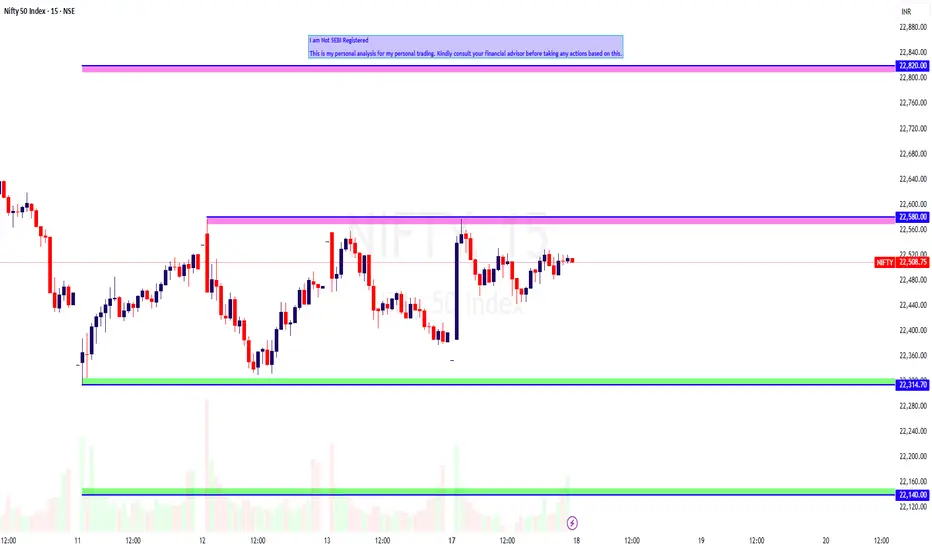
NIFTY Intraday Trade Setup For 18 Mar 2025NIFTY Intraday Trade Setup For 18 Mar 2025
Bullish- Above 22580
Invalid-Below 22530
T- 22820
Bearish-Below 22310
Invalid-Above 22360
T- 22140
NIFTY has closed on a bullish note with 0.5% gain today. It has been trading inside range of 22600 and 22300 since last 4 sessions. Hourly key levels are 22700 and 22300. One should wait for this range to break to trade directional. As intraday move are too choppy to trade. Index is bearish till it is below 50 EMA in daily TF. Although it is bearish always looks for bearish price structure to short if pullback come.
Coming to Tuesday's trade setup, if index opens flat and a 15 Min candle closes above 22580 then we will long for the target 22820.
For selling we need a 15 Min candle close below 22310. T- 22140.
In case of a big gap up/down, wait till 10 o'clock and mark the high and low of the trading range (5MIN). Trade on this range breakout.
==========
I am Not SEBI Registered
This is my personal analysis for my personal trading. Kindly consult your financial advisor before taking any actions based on this.
Nifty levels - Mar 18, 2025Nifty support and resistance levels are valuable tools for making informed trading decisions, specifically when combined with the analysis of 5-minute timeframe candlesticks and VWAP. By closely monitoring these levels and observing the price movements within this timeframe, traders can enhance the accuracy of their entry and exit points. It is important to bear in mind that support and resistance levels are not fixed, and they can change over time as market conditions evolve.
The dashed lines on the chart indicate the reaction levels, serving as additional points of significance to consider. Furthermore, take note of the response at the levels of the High, Low, and Close values from the day prior.
We hope you find this information beneficial in your trading endeavors.
* If you found the idea appealing, kindly tap the Boost icon located below the chart. We encourage you to share your thoughts and comments regarding it.
Wishing you success in your trading activities!

Nifty weekly analysis for 17/03/2025Nifty is trading between 100 EMA (weekly) and 20 EMA (daily). A good support from the weekly moving average is there and resistance on the daily charts.
A continuous support from 22300 level is there as the market has remained in a range whole week.
If the market tried to breach the support level, the support of weekly 100 EMA can be the other support around 22030 else it will take support around 21800.
In case the market starts to recover from the bottom and creates a higher high higher low formation it has to take out the resistance of 22650 and 22758.
Major levels are plotted in the charts. Just wait for the price action to confirm the entry into a trade else another sideways market can be seen.
Inside candle formation on the daily charts is also there and break out/down can be traded accordingly. Different trading approaches can help in capturing a good trade.
Wait for the price action near the levels before entering the market.

Nifty levels - Mar 17, 2025Nifty support and resistance levels are valuable tools for making informed trading decisions, specifically when combined with the analysis of 5-minute timeframe candlesticks and VWAP. By closely monitoring these levels and observing the price movements within this timeframe, traders can enhance the accuracy of their entry and exit points. It is important to bear in mind that support and resistance levels are not fixed, and they can change over time as market conditions evolve.
The dashed lines on the chart indicate the reaction levels, serving as additional points of significance to consider. Furthermore, take note of the response at the levels of the High, Low, and Close values from the day prior.
We hope you find this information beneficial in your trading endeavors.
* If you found the idea appealing, kindly tap the Boost icon located below the chart. We encourage you to share your thoughts and comments regarding it.
Wishing you success in your trading activities!

NIFTY 22000!!!! OR 21650!!????according to my analysis nifty is heading down, it's loosing momentum towards upside.
So price action shows lots of bearishness. Maybe tomorrow ( Friday) going to be a big move towards downside. It will reach 22000, in extreme it will reach 21650 within next week.
Comment your thoughts and learn to trade by yourself is good for you.

Nifty levels - Mar 13, 2025Nifty support and resistance levels are valuable tools for making informed trading decisions, specifically when combined with the analysis of 5-minute timeframe candlesticks and VWAP. By closely monitoring these levels and observing the price movements within this timeframe, traders can enhance the accuracy of their entry and exit points. It is important to bear in mind that support and resistance levels are not fixed, and they can change over time as market conditions evolve.
The dashed lines on the chart indicate the reaction levels, serving as additional points of significance to consider. Furthermore, take note of the response at the levels of the High, Low, and Close values from the day prior.
We hope you find this information beneficial in your trading endeavors.
* If you found the idea appealing, kindly tap the Boost icon located below the chart. We encourage you to share your thoughts and comments regarding it.
Wishing you success in your trading activities!

Nifty levels - Mar 12, 2025Nifty support and resistance levels are valuable tools for making informed trading decisions, specifically when combined with the analysis of 5-minute timeframe candlesticks and VWAP. By closely monitoring these levels and observing the price movements within this timeframe, traders can enhance the accuracy of their entry and exit points. It is important to bear in mind that support and resistance levels are not fixed, and they can change over time as market conditions evolve.
The dashed lines on the chart indicate the reaction levels, serving as additional points of significance to consider. Furthermore, take note of the response at the levels of the High, Low, and Close values from the day prior.
We hope you find this information beneficial in your trading endeavors.
* If you found the idea appealing, kindly tap the Boost icon located below the chart. We encourage you to share your thoughts and comments regarding it.
Wishing you success in your trading activities!

NIFTY50 - TRADING NEAR KEY SUPPORT ZONESymbol - NIFTY50
CMP - 22250
The Nifty50 index continues to maintain a negative bias, with the price action suggesting that it remains within bearish trend. This indicates the continuation of the downtrend, though we are currently seeing the index testing key support levels. At the moment, Nifty is trading near the 22200 area, which is a critical support zone. Technical indicators are also hinting at the fact that markets are oversold at current levels. Given the underlying support zone & oversold conditions, there's a high probability of a short-term bounce before the downward momentum resumes.
Looking at the immediate price structure, we are likely to witness a potential retracement towards resistance zones around 22800 and 23000. These levels are in line with the Fibonacci retracement levels, offering opportunities to enter long positions with a favorable risk-reward ratio. Traders can look for a bounce from current support levels and expect a move towards these resistance zones.
we are now at a critical juncture where a potential bounce could provide opportunities for short-term longs.
Given the technical setup, I am taking long positions in Nifty Futures at CMP 22250. I will look to add more positions if the price reaches 22100-22050 range. My SL is set at 21970 to manage risk, ensuring protection in case the price fails to hold the demand zone and continues lower.
Key resistance remains around 23400. A sustained move above this range could suggest a potential shift from a bearish trend to a neutral or even bullish outlook. However, until the index decisively moves above these levels, the preferred strategy remains to sell at resistance and buy at support, capitalizing on any short-term retracements.
In conclusion, while the short-term outlook offers potential for a bounce, the broader trend remains bearish. Therefore, the approach should be to look for long positions at favorable support levels.
Disclaimer: The information provided here should not be construed as a buy or sell recommendation. It reflects my personal analysis and my trading position. Please consider this trading idea for educational purposes only. Thank you!

Nifty levels - Mar 11, 2025Nifty support and resistance levels are valuable tools for making informed trading decisions, specifically when combined with the analysis of 5-minute timeframe candlesticks and VWAP. By closely monitoring these levels and observing the price movements within this timeframe, traders can enhance the accuracy of their entry and exit points. It is important to bear in mind that support and resistance levels are not fixed, and they can change over time as market conditions evolve.
The dashed lines on the chart indicate the reaction levels, serving as additional points of significance to consider. Furthermore, take note of the response at the levels of the High, Low, and Close values from the day prior.
We hope you find this information beneficial in your trading endeavors.
* If you found the idea appealing, kindly tap the Boost icon located below the chart. We encourage you to share your thoughts and comments regarding it.
Wishing you success in your trading activities!

Nifty50 If a hourly candle sustains or Close below white trend line then it could test 22490 -- 22505 within 11th March .
Disclaimer :
It's a personal view not a financial advice and I assume no responsibility and liability whatever outcome arises.

Nifty 22900 confirm!!!!!!!!!Last week I share I view, you can go and check out.
It's moving towards 22900 which 50% Fibonacci level.
For me today first one hour is pretty bullish so I anticipate that candle low can't be taken out.
So place stoploss at there and target 22900.
This is my trade stoploss and target.
Learn to trade by yourself is better for you.
Leave a comment.if you like.

Nifty - Sell on RiseStrong supply area in multiple time frames like Daily / 125 / 75
Also a strong gap area
Expected resistance zone to fall between 22630 - 22730
Upside Sl above 22800
Downside targets 22400 & 22000
Entry with 15/25 min candle confirmation only

Nifty weekly analysis for 10/03/2025.Is this the end of the fall or its just a retracement. The market after a while has given some hope of a green week.
It is a retest or a base formation no body knows. Nifty is trading around 22550 levels and looks somewhat positive for the coming week.
Market is still in the down trend and bullish trend will only be confirmed once a 'W' pattern is formed on higher time frame or a break out is done.
On the hourly charts, market remained in a range for the last trading session, the sideways market can continue as it may form a base and trend reverses from here.
In case the market remains in the trend lower levels of 21800-850 might be coming. Else market may start travelling on the higher side hitting the resistance levels.
Major support levels :- 22310-360, 22050-090
Resistance levls :- 21620, 21760
A gap filling trade on the higher side can be seen in the coming week as a gap is pending.
Watch for the price action and trade accordingly. A sideway or volatile market is more probable as the market has been trading in a trend.

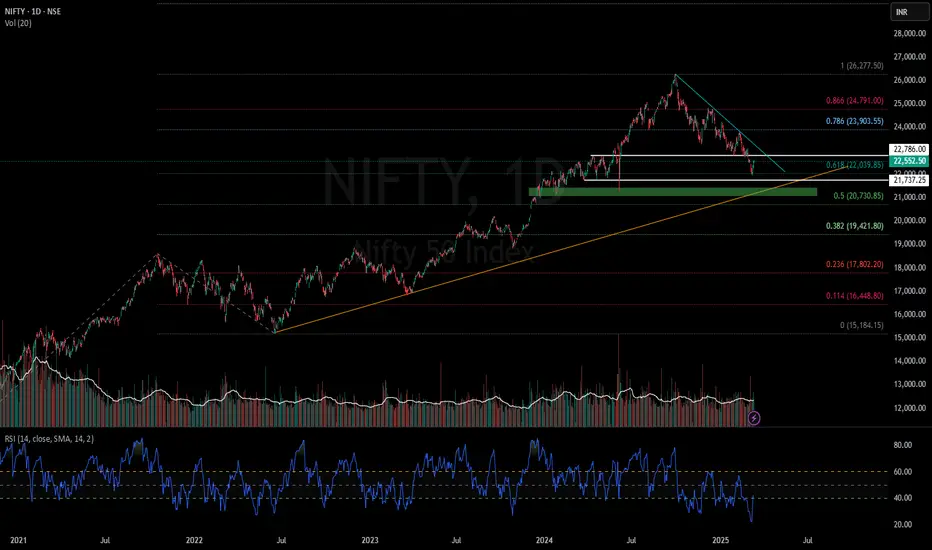
Nifty 50 - Mar 2025 view - Is the correction over?If you have followed my last 2 views of Nifty50, you would be smiling definitely only if you didn't have any swings open.
We have seen a good correction in market since September 2024.
It was much needed in market since 2022 , we have seen an extended move in Indian markets.
I know mid and smallcaps have corrected more than 20% but they were bound for it because of overvaluation. We are in a slowdown phase of economy and earnings of those company wont match expectations.
Coming back to Nifty50, is the correction over?
IAnswe is cant be sure but 1 thing is definite, 21800-22000 will act as strong demand zone as we have seen a quick 600 points jump from 22000.
However, I will suggest to wait for confirmation for any new swings.
What next?
Nifty might be retesting 22800 breakdown. It can fall again towards 21800 and if it breaks 21800 which looks very less probable, 21000-21200 is a very very strong demand zone which should be the last zone for correction.
If Nifty manages to jump from 22000, it will be formation of W pattern(double bottom) which will be a sign of reversal. That's when you can start accumulating.
Expecting March to be sideways to bearish again. We might see a selling due to people booking losses for tax harvesting.
If 21800-22000 holds in March, we can see buying in April which will take it to 23900.
Be patient. Start analyzing stocks for accumulating. Stay healthy and wealthy!
Nifty levels - Mar 10, 2025Nifty support and resistance levels are valuable tools for making informed trading decisions, specifically when combined with the analysis of 5-minute timeframe candlesticks and VWAP. By closely monitoring these levels and observing the price movements within this timeframe, traders can enhance the accuracy of their entry and exit points. It is important to bear in mind that support and resistance levels are not fixed, and they can change over time as market conditions evolve.
The dashed lines on the chart indicate the reaction levels, serving as additional points of significance to consider. Furthermore, take note of the response at the levels of the High, Low, and Close values from the day prior.
We hope you find this information beneficial in your trading endeavors.
* If you found the idea appealing, kindly tap the Boost icon located below the chart. We encourage you to share your thoughts and comments regarding it.
Wishing you success in your trading activities!

NIFTY BUY 22900!!!!!!You can see in the picture
Price is moving towards 22900 area which 50% fib retrace .
Price is looking bullish to reach that area.
I have taken the trade.
I place stoploss on 22246 if that area breaks then my trade is invalid so I am out .
But for now look for bullish 22900 area.
Learn to trade by yourself is better for you.
Leave a comment.

Nifty levels - Mar 07, 2025Nifty support and resistance levels are valuable tools for making informed trading decisions, specifically when combined with the analysis of 5-minute timeframe candlesticks and VWAP. By closely monitoring these levels and observing the price movements within this timeframe, traders can enhance the accuracy of their entry and exit points. It is important to bear in mind that support and resistance levels are not fixed, and they can change over time as market conditions evolve.
The dashed lines on the chart indicate the reaction levels, serving as additional points of significance to consider. Furthermore, take note of the response at the levels of the High, Low, and Close values from the day prior.
We hope you find this information beneficial in your trading endeavors.
* If you found the idea appealing, kindly tap the Boost icon located below the chart. We encourage you to share your thoughts and comments regarding it.
Wishing you success in your trading activities!

Nifty 50 Market Outlook: Key Levels, Trends, and Forecast.As of March 6, 2025, the Nifty 50 index is experiencing fluctuations influenced by various market factors. In recent sessions, the index has faced declines, primarily due to concerns over U.S. trade policies and their potential impact on global markets.
Current Market Trends:
Trade Policy Concerns: Persistent uncertainties surrounding U.S. trade policies have contributed to market volatility, affecting investor sentiment.
Sector Performance: Information technology stocks have shown resilience, with companies like Coforge and Infosys leading gains after securing significant deals and receiving positive forecasts.
Forecasted Levels:
PL Capital's Projection: In October 2024, PL Capital projected that the Nifty 50 could reach 27,867 within 12 months, driven by resilient sectors and cautious optimism amid geopolitical uncertainties.
Nomura's Range Estimate: As of February 2025, Nomura forecasts the Nifty 50 to fluctuate between 21,800 and 25,700 throughout the year, reflecting potential market volatility.
Jefferies' Growth Outlook: In December 2024, Jefferies anticipated a 10% increase in the Nifty 50 by December 2025, targeting a level of 26,000, supported by expectations of GDP growth and corporate earnings recovery.
Key Support and Resistance Levels:
Technical analysis indicates that the Nifty 50 has critical support in the 23,900–24,000 range. A sustained break below this level could lead to further downside toward 23,700. On the upside, resistance is identified between 24,500 and 24,800, which the index would need to surpass for a bullish trend.
Conclusion:
The Nifty 50's trajectory in 2025 is subject to various factors, including global trade policies, sector-specific performances, and domestic economic indicators. While forecasts suggest potential growth, investors should remain cautious of the prevailing uncertainties and monitor key support and resistance levels to make informed decisions.
NIfty spot Will the bearishness continue ? Nifty Spot corrected 3000 Points from its all time peak of 26300 odd levels...
right now i n retracement mode...
24800 levels strong resistance...
Pattern and trend lines on chart....
Like..... Share........

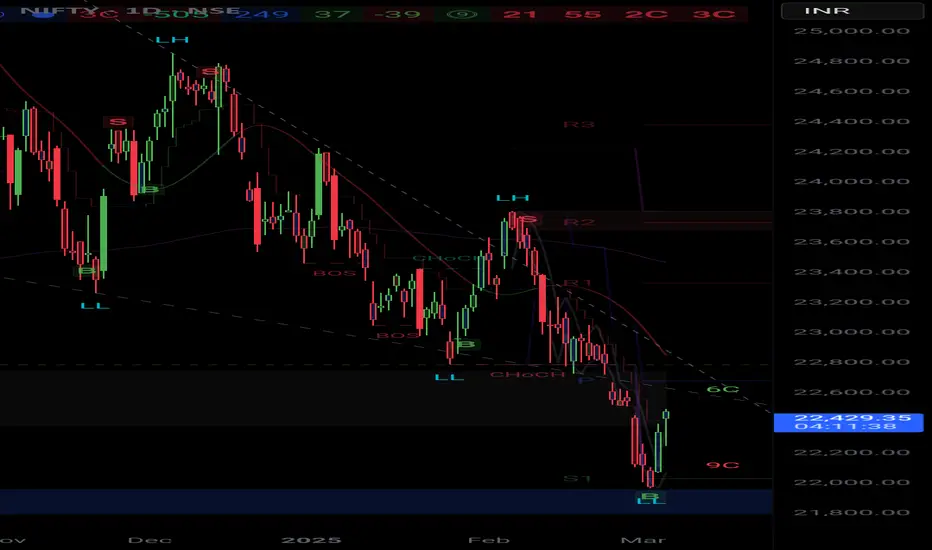
NIFTY Analysis for today 6 March 25As we discussed yesterday, Nifty took a pullback from 22000. It has shown a good bullish signal at this level.
If we look at the chart now:
The market is trading at 200 EMA (15 EMA) and 50 EMA (1 H - TF), which is going to provide resistance at this level. The market is trading in the accumulation phase. If it breaks this zone, then the next resistance is a higher trendline at 1D TF, which I shared yesterday.
Support levels: 21987, 21840
Resistance levels: 22400, 22615, 22775, 200 EMA
