NIFTY MATHEMATICAL LEVELS These Levels are based on purely mathematical calculations.
Validity of levels are upto expiry of current week.
How to use these levels :-
* Mark these levels on your chart.
* Safe players Can use 15 min Time Frame
* Risky Traders Can use 5 min. Time Frame
* When Candle give Breakout / Breakdown to any level we have to enter with High/Low of that breaking candle.
* Targets will be another level marked on chart
* Stop Loss will be Low/High of that Breaking Candle.
* Trail your SL with every candle.
* Avoid Big Candles as SL will be high then.
* This is one of the Best Risk Reward Setup.
For Educational purpose only
Niftylevels

Nifty levels - Feb 21, 2025Nifty support and resistance levels are valuable tools for making informed trading decisions, specifically when combined with the analysis of 5-minute timeframe candlesticks and VWAP. By closely monitoring these levels and observing the price movements within this timeframe, traders can enhance the accuracy of their entry and exit points. It is important to bear in mind that support and resistance levels are not fixed, and they can change over time as market conditions evolve.
The dashed lines on the chart indicate the reaction levels, serving as additional points of significance to consider. Furthermore, take note of the response at the levels of the High, Low, and Close values from the day prior.
We hope you find this information beneficial in your trading endeavors.
* If you found the idea appealing, kindly tap the Boost icon located below the chart. We encourage you to share your thoughts and comments regarding it.
Wishing you success in your trading activities!

Key Levels: Nifty at a Crucial Turning Point! What's Next? Nifty's price structure is showing a clear pattern of lower highs and lower lows, indicating a prevailing downtrend. However, the market is now at an interesting Demand Zone that could determine its next big move.
📊 Key Observations
On January 27, Nifty took support from an old demand zone, and formed new lower high.
This minor reversal also led to the creation of a new demand zone.
Currently, Nifty is approaching this fresh Demand zone & old Demand Zone, making it a highly significant area to watch.
🔍 Possible Scenarios Ahead
Reversal from the Demand Zone : If Nifty respects this demand zones and reverses, we may see a potential bottom forming.
Sideways Consolidation : Nifty may move sideways, indicating indecision before a breakout.
Breakdown Below Demand Zone : If the demand zone is breached, Nifty could make a new lower low, continuing its downward trend.
🔄 What’s Next?
The next few sessions will be crucial in determining whether Nifty finds strength or continues its downward trajectory. Traders should closely monitor price action and key levels to gauge market sentiment.
Lastly, thank you for your support, your likes & comments. Feel free to ask if you have questions.
🌟 “Patience and discipline separate the successful trader from the rest.”
This analysis is for educational purposes only and is not a trading or investment recommendation. I am not a SEBI-registered analyst.

NIFTY IMPORTANT LEVELS FOR 20.02.2025important levels for nifty for intraday. important levels on the chart has beem marked and just observe how good these levels will react.
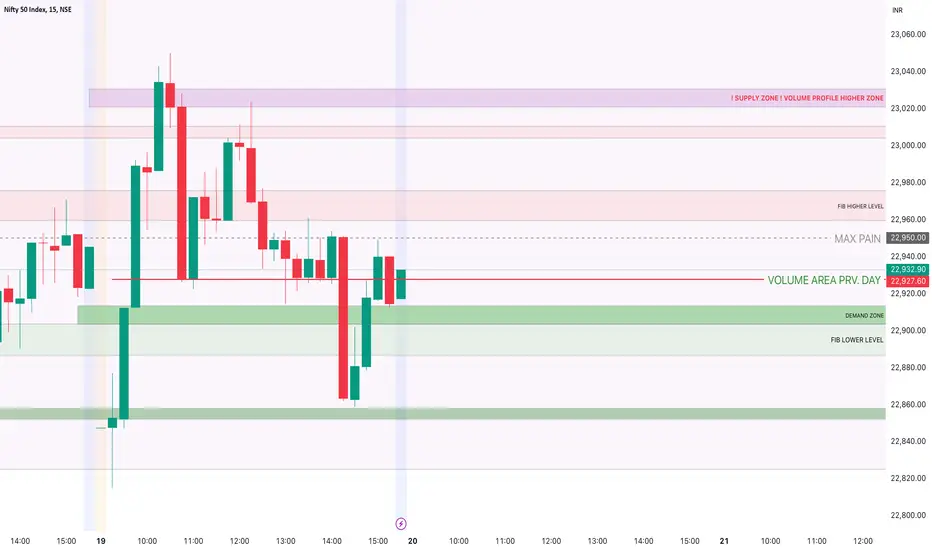
Nifty levels - Feb 20, 2025Nifty support and resistance levels are valuable tools for making informed trading decisions, specifically when combined with the analysis of 5-minute timeframe candlesticks and VWAP. By closely monitoring these levels and observing the price movements within this timeframe, traders can enhance the accuracy of their entry and exit points. It is important to bear in mind that support and resistance levels are not fixed, and they can change over time as market conditions evolve.
The dashed lines on the chart indicate the reaction levels, serving as additional points of significance to consider. Furthermore, take note of the response at the levels of the High, Low, and Close values from the day prior.
We hope you find this information beneficial in your trading endeavors.
* If you found the idea appealing, kindly tap the Boost icon located below the chart. We encourage you to share your thoughts and comments regarding it.
Wishing you success in your trading activities!

Nifty levels - Feb 19, 2025Nifty support and resistance levels are valuable tools for making informed trading decisions, specifically when combined with the analysis of 5-minute timeframe candlesticks and VWAP. By closely monitoring these levels and observing the price movements within this timeframe, traders can enhance the accuracy of their entry and exit points. It is important to bear in mind that support and resistance levels are not fixed, and they can change over time as market conditions evolve.
The dashed lines on the chart indicate the reaction levels, serving as additional points of significance to consider. Furthermore, take note of the response at the levels of the High, Low, and Close values from the day prior.
We hope you find this information beneficial in your trading endeavors.
* If you found the idea appealing, kindly tap the Boost icon located below the chart. We encourage you to share your thoughts and comments regarding it.
Wishing you success in your trading activities!

Nifty levels - Feb 18, 2025Nifty support and resistance levels are valuable tools for making informed trading decisions, specifically when combined with the analysis of 5-minute timeframe candlesticks and VWAP. By closely monitoring these levels and observing the price movements within this timeframe, traders can enhance the accuracy of their entry and exit points. It is important to bear in mind that support and resistance levels are not fixed, and they can change over time as market conditions evolve.
The dashed lines on the chart indicate the reaction levels, serving as additional points of significance to consider. Furthermore, take note of the response at the levels of the High, Low, and Close values from the day prior.
We hope you find this information beneficial in your trading endeavors.
* If you found the idea appealing, kindly tap the Boost icon located below the chart. We encourage you to share your thoughts and comments regarding it.
Wishing you success in your trading activities!

Nifty - At Crucial PointNifty current area from 22640 to 22910 becomes a very crucial zone now
If tries to sustain n takes support then expect nifty to hover near support for few days before going back up again near 23600
But if the pressure continues and nifty successfully breaks and closes below 22640 in the daily TF
Then expect the same area (22640 - 22910) to act as a resistance and also Nifty can go to touch downside target of 21880

NIfty may slip 5% moreBased on previous slip of nifty, the maximum slip was 18%, now the current slip from high is 13% and at 18% has got high support based on previous support.

Nifty - Sell for 22K or 20K ?Nifty has been breaking all important support levels and going deep into sea. Its well managed pump and dump by all big players. Looks like not just one or two and its big game plan with blessings of people with money power etc etc... Trust is lost and its going to impact our markets for several months now. SIP is also not safe as MF not investing all money.

Nifty levels - Feb 17, 2025Nifty support and resistance levels are valuable tools for making informed trading decisions, specifically when combined with the analysis of 5-minute timeframe candlesticks and VWAP. By closely monitoring these levels and observing the price movements within this timeframe, traders can enhance the accuracy of their entry and exit points. It is important to bear in mind that support and resistance levels are not fixed, and they can change over time as market conditions evolve.
The dashed lines on the chart indicate the reaction levels, serving as additional points of significance to consider. Furthermore, take note of the response at the levels of the High, Low, and Close values from the day prior.
We hope you find this information beneficial in your trading endeavors.
* If you found the idea appealing, kindly tap the Boost icon located below the chart. We encourage you to share your thoughts and comments regarding it.
Wishing you success in your trading activities!

Nifty Intraday Trading Strategy for 14th Feb 2025📊 Nifty Intraday Trading Strategy – Key Levels 📊
📌 Buy Setup
🔹 Buy Above: 23,185 (Only after confirmation)
🎯 Target 1: 23,220
🎯 Target 2: 23,260
🎯 Target 3: 23,310
📍 Stop Loss: Below the 15-minute candle low after breakout confirmation.
🔹 Conditions for Buying:
✅ A 15-minute candle must close above 23,185 to confirm the breakout.
✅ Enter a buy position only if the price crosses above the high of this 15-minute candle.
✅ Wait for a retest or sustained momentum before entering a trade.
✅ Ensure volume confirmation and market trend alignment before taking a position.
📌 Sell Setup
🔹 Sell Below: 22,964 (Only after confirmation)
🎯 Target 1: 22,910
🎯 Target 2: 22,860
🎯 Target 3: 22,820
📍 Stop Loss: Above the 15-minute candle high after breakdown confirmation.
🔹 Conditions for Selling:
✅ A 15-minute candle must close below 22,964 to confirm the breakdown.
✅ Enter a sell position only if the price drops below the low of this 15-minute candle.
✅ Avoid early entries—wait for a proper close below this level.
✅ Watch for volume confirmation and trend continuation before entering a short position.
⚠ Important Notes:
🔸 Risk Management: Always use stop-loss and proper position sizing to protect your capital.
🔸 Market Conditions: Consider global cues, economic data, and overall sentiment before trading.
🔸 Volatility Caution: Avoid trading during high-impact news events and sudden spikes.
📌 Disclaimer: I am not a SEBI-registered analyst. This analysis is for educational purposes only and should not be considered financial advice. Please consult a certified financial professional before making any trading decisions. Trade at your own risk.

NIFTY MATHEMATICAL LEVELSThese Levels are based on purely mathematical calculations.
Validity of levels are upto expiry of current week.
How to use these levels :-
* Mark these levels on your chart.
* Safe players Can use 15 min Time Frame
* Risky Traders Can use 5 min. Time Frame
* When Candle give Breakout / Breakdown to any level we have to enter with High/Low of that breaking candle.
* Targets will be another level marked on chart
* Stop Loss will be Low/High of that Breaking Candle.
* Trail your SL with every candle.
* Avoid Big Candles as SL will be high then.
* This is one of the Best Risk Reward Setup.
For Educational purpose only

Nifty levels - Feb 14, 2025Nifty support and resistance levels are valuable tools for making informed trading decisions, specifically when combined with the analysis of 5-minute timeframe candlesticks and VWAP. By closely monitoring these levels and observing the price movements within this timeframe, traders can enhance the accuracy of their entry and exit points. It is important to bear in mind that support and resistance levels are not fixed, and they can change over time as market conditions evolve.
The dashed lines on the chart indicate the reaction levels, serving as additional points of significance to consider. Furthermore, take note of the response at the levels of the High, Low, and Close values from the day prior.
We hope you find this information beneficial in your trading endeavors.
* If you found the idea appealing, kindly tap the Boost icon located below the chart. We encourage you to share your thoughts and comments regarding it.
Wishing you success in your trading activities!

Nifty View - 13 Feb 2025Nifty is forming a bearish trend after excellent support at 23000. It feels like Nifty is forming a bull trap at 23200 since the momentum has slowed.
Personally, how am I trading this trend:
Since today is Nifty expiry I'm carrying 21250 PE with entry at around 55.

Nifty Long Term ChannelNifty has been in this channel since 1990 & we see a throw over in 2008 when extreme bullishness takes it past the channel top to only see a deep correction.
We are near to channel top again but do we have extreme sentiment on bullish side ?
No rather we have a extreme bearish sentiment so can we see a throw over again in this channel for this bull cycle started from Covid lows of March 2020.
Lets dig some numbers March 2020 Low was 7511
Oct 2021 High was 18604
Net Rise 11093 Points
June 2021 Low was 15183
Add 11093
Sept 2024 High 26277
Now we did to 2 equal rise of 11093 points 1st in 19 Months & second in 27 Months what if the low of 22786 is a major low given the extreme negative sentiment at we are adding another 11093 points from here in next 19 months.
Are we heading to 33900 by Oct 2026 ?
If Nifty closes above 25000 than second hurdle will be ATH at 26277 than we would see fast & furious bull run which could be last leg of this euphoria which gives a throw over on this long term Channel.
DISC : View shared here are for Educational purpose only i am not a SEBI registered analyst please consult your Financial advisor before taking any trades.

NIFTY Weekly view: 10 FEB 2025Nifty is swinging in the middle and retesting the zone. If it goes above and gets rejection from the Liquidity zone then a short opportunity can happen. Eyes on these zones and keep trailing.

Nifty 50 spot 22985.25 by the Daily Chart viewNifty 50 spot 22985.25 by the Daily Chart view
- Sustained Support Zone for Nifty 50 Index 22775 to 22950 levels
- Will the Support Zone pass the 2nd retest after 1st test done on 27-January-2025
- Let's hope for the best to happen and look forward to see how things unfold going ahead

Nifty levels - Feb 13, 2025Nifty support and resistance levels are valuable tools for making informed trading decisions, specifically when combined with the analysis of 5-minute timeframe candlesticks and VWAP. By closely monitoring these levels and observing the price movements within this timeframe, traders can enhance the accuracy of their entry and exit points. It is important to bear in mind that support and resistance levels are not fixed, and they can change over time as market conditions evolve.
The dashed lines on the chart indicate the reaction levels, serving as additional points of significance to consider. Furthermore, take note of the response at the levels of the High, Low, and Close values from the day prior.
We hope you find this information beneficial in your trading endeavors.
* If you found the idea appealing, kindly tap the Boost icon located below the chart. We encourage you to share your thoughts and comments regarding it.
Wishing you success in your trading activities!

Nifty levels - Feb 12, 2025Nifty support and resistance levels are valuable tools for making informed trading decisions, specifically when combined with the analysis of 5-minute timeframe candlesticks and VWAP. By closely monitoring these levels and observing the price movements within this timeframe, traders can enhance the accuracy of their entry and exit points. It is important to bear in mind that support and resistance levels are not fixed, and they can change over time as market conditions evolve.
The dashed lines on the chart indicate the reaction levels, serving as additional points of significance to consider. Furthermore, take note of the response at the levels of the High, Low, and Close values from the day prior.
We hope you find this information beneficial in your trading endeavors.
* If you found the idea appealing, kindly tap the Boost icon located below the chart. We encourage you to share your thoughts and comments regarding it.
Wishing you success in your trading activities!

NIFTY50 - WHAT IS NEXT?Symbol - NIFTY50
CMP - 23700
The Nifty50 is still trading within a falling channel pattern, which continues to highlight a bearish technical structure. Currently, the index is facing resistance at the upper end of this channel, between 23700 - 23820. Given the ongoing downtrend and resistance levels, there is a strong possibility that Nifty may experience a pullback from these levels.
Nifty is likely to continue trading within this channel, and in the short term, we could see a correction back towards the 23000 - 22800 region. These levels would act as near-term support, as they align with previous lows and key technical levels.
However, if the Nifty breaks above the upper boundary of this channel and manages to sustain above it, the short-term trend could shift from bearish to a more sideways. Such a breakout would indicate a possible consolidation phase, though a shift in trend would require sustained strength above the channel's resistance.
In the event that Nifty undergoes further correction and moves towards the 22500 - 22300 range, this would present an excellent opportunity to buy the dips. At these levels, valuations are expected to become attractive, and investing in strong stocks for the medium to long term could provide solid growth potential as prices at this range could offer significant upside potential.
Thus, while the immediate outlook remains bearish with resistance holding firm, the deeper correction could offer great entry points for investors looking to capitalize on potential market growth over time.
Key resistance levels remain around 23750 - 23900, and support is expected at 22850 - 23000. The 22500 - 22300 region is a crucial area for potential buyers. Traders should stay alert to a possible shift in trend if the upper boundary of the falling channel is broken.

NIfty 23200 important Support swing tradeHello,
Nifty Retrace more than 50% of previous swing high and now at trendline support RSI oversold with slow selling volume is not active on sellers side also hidden divergence and oscilators are bullish bullish reversal possibilities with stop loss of 23180

Nifty levels - Feb 11, 2025Nifty support and resistance levels are valuable tools for making informed trading decisions, specifically when combined with the analysis of 5-minute timeframe candlesticks and VWAP. By closely monitoring these levels and observing the price movements within this timeframe, traders can enhance the accuracy of their entry and exit points. It is important to bear in mind that support and resistance levels are not fixed, and they can change over time as market conditions evolve.
The dashed lines on the chart indicate the reaction levels, serving as additional points of significance to consider. Furthermore, take note of the response at the levels of the High, Low, and Close values from the day prior.
We hope you find this information beneficial in your trading endeavors.
* If you found the idea appealing, kindly tap the Boost icon located below the chart. We encourage you to share your thoughts and comments regarding it.
Wishing you success in your trading activities!
