#NIFTY Intraday Support and Resistance Levels - 19/01/2026Based on the current structure of the Nifty 50 chart, a gap-down opening is expected, which clearly reflects cautious sentiment at the start of the session. The index is opening below the recent consolidation zone, indicating that sellers are still active and buyers are not yet confident to push prices higher at the open. This kind of opening generally leads to a range-bound to volatile first half, where the market tests nearby support and resistance levels before showing any clear directional bias.
From a technical perspective, the 25,700–25,750 zone is acting as an important short-term decision area. This level has previously behaved as both support and resistance, making it a critical region to watch today. If Nifty manages to hold above 25,700 and shows strength, there is a possibility of a reversal long setup. Sustained price action above 25,750–25,800 can attract buying interest, and in that case, the upside targets remain 25,850, 25,900, and 25,950+. Such a move would indicate short covering and intraday recovery after the gap-down opening.
On the downside, if the index fails to sustain above 25,700 and breaks down decisively below this level, selling pressure is likely to increase. A clean breakdown below 25,700 can open the door for further downside towards 25,650, 25,550, and 25,500. This would confirm that the gap-down opening is being accepted by the market and that bears remain in control for the session. Any rejection from the 25,950–26,000 resistance zone would further strengthen the bearish intraday outlook.
Overall, the market structure suggests a sell-on-rise or level-based trading approach rather than aggressive directional trades at the open. Traders should avoid early impulsive entries and instead wait for confirmation near the marked levels. If price stabilizes and forms a base near support, a controlled reversal trade can be planned. Otherwise, continued weakness below support levels may offer short-selling opportunities with strict risk management. The session is likely to remain volatile and level-driven, making patience and discipline crucial for today’s trades.
Niftylevels

NIFTY : Trading levels and Plan for 19-Jan-2026📘 NIFTY Trading Plan – 19 Jan 2026
Timeframe: 15-minute
Gap Consideration: 100+ points
Market Context: Range expansion attempt after corrective swings, key balance area in focus
🔼 SCENARIO 1: GAP UP OPENING (100+ points) 🚀
If NIFTY opens above 25,780, it indicates bullish intent with short-covering.
Immediate hurdle lies at 25,915–25,945 (Last Intraday Resistance zone).
Sustained 15-min close above 25,945 can trigger upside extension.
Next upside projection comes near 26,044.
Expect volatility and profit booking near resistance zones.
Fresh longs only on pullback + hold above resistance.
📌 Options Strategy (Gap Up):
• Bull Call Spread (ATM Buy + OTM Sell)
• Avoid aggressive naked CE near resistance
• Trail profits aggressively 📈
➡️ SCENARIO 2: FLAT / RANGE OPENING ⚖️
If NIFTY opens within 25,660–25,738, expect a no-trade / chop zone.
This zone is marked as Opening Support–Resistance.
Market likely to trap both buyers and sellers initially.
Upside trade only above 25,780 with confirmation.
Downside bias activates below 25,560.
Best suited for option sellers if IV permits.
📌 Options Strategy (Flat Market):
• Short Strangle / Iron Fly (experienced traders only)
• Focus on theta decay ⏳
• Avoid directional bias inside range
🔽 SCENARIO 3: GAP DOWN OPENING (100+ points) 📉
If NIFTY opens below 25,560, selling pressure may resume.
First support zone is 25,530–25,567 (Opening / Last Intraday Support).
Minor bounce possible, but trend remains weak below resistance.
Breakdown below 25,530 opens downside towards:
• 25,423
Avoid bottom fishing without confirmation candle.
📌 Options Strategy (Gap Down):
• Bear Put Spread preferred
• Avoid selling PE in trending downside
• Quick scalps only, book fast 📉
🧠 Risk Management Tips for Options Trading 🛡️
Risk only 1–2% of capital per trade.
Expiry proximity = faster decay & sharper moves.
Prefer spreads over naked buying.
One trade = one idea. No revenge trading.
Always wait for 15-min structure confirmation.
📌 Summary & Conclusion ✨
NIFTY is trading near a critical balance zone.
📍 25,660–25,738 remains the decision-making range.
📍 Break above 25,945 may revive bullish momentum.
📍 Below 25,530, downside risk increases sharply.
Trade light, respect levels, and let the market confirm direction.
⚠️ Disclaimer
This content is for educational purposes only.
I am not a SEBI registered analyst.
Markets are uncertain, and I can be wrong.
Please consult your financial advisor before trading.

Indian Markets on Hold: Nifty Awaits the Next Big TriggerIndian markets remained range-bound last week, with the Nifty ending on a flat note. Participants stayed cautious as volatility showed early signs of revival, with India VIX inching up to 11.37.
◉ Technical Setup
From a technical standpoint, the index briefly slipped below the rising wedge support, but the move failed to attract strong selling pressure. Nifty continues to consolidate in a narrow band, suggesting indecision rather than a trend reversal.
This phase of consolidation is likely to extend into the coming week unless key levels are breached.
◉ Key Levels to Watch
The broader structure remains unchanged from last week.
Resistance: 26,000–26,100
Strong call writing in this zone makes it a tough hurdle.
Support: 25,500–25,400
A solid put base is visible here, offering near-term support.
A decisive break below 25,400 could open the door for a sharp downside move, pulling the index closer to 25,000.
◉ Key Triggers for the Week
Q3 Earnings Season – Results from large and mid-cap companies across sectors will guide stock-specific action and influence overall market sentiment.
India–US Trade Deal – Comments or policy moves around trade negotiations, especially related to agricultural tariffs, could impact sentiment and sectoral stocks.
◉ Weekly Outlook
The near-term outlook remains neutral, with Nifty expected to trade within a defined range until a decisive breakout or breakdown occurs.
◉ Trader’s Insight
Until Nifty decisively holds above 26,000, aggressive long positions across the board should be avoided. A selective, stock-specific approach, backed by strict risk management, is better suited to the current market environment.

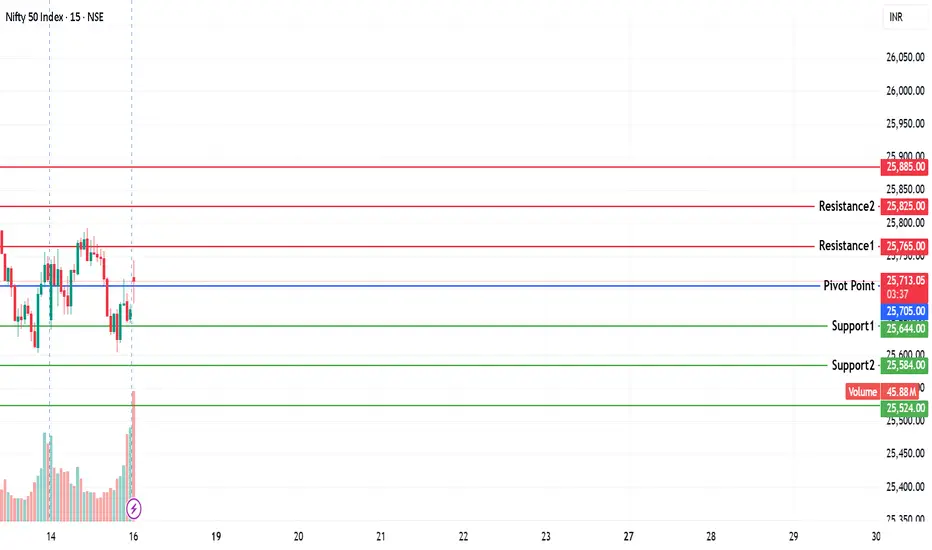
NIFTY KEY LEVELS FOR 16.01.2026NIFTY KEY LEVELS FOR 16.01.2026
Timeframe: 3 Minutes
If the candle stays above the pivot point, it is considered a bullish bias; if it remains below, it indicates a bearish bias. Price may reverse near Resistance 1 or Support 1. If it moves further, the next potential reversal zone is near Resistance 2 or Support 2. If these levels are also broken, we can expect the trend.
When a support or resistance level is broken, it often reverses its role; a broken resistance becomes the new support, and a broken support becomes the new resistance.
If the range(R2-S2) is narrow, the market may become volatile or trend strongly. If the range is wide, the market is more likely to remain sideways
please like and share my idea if you find it helpful
📢 Disclaimer
I am not a SEBI-registered financial adviser.
The information, views, and ideas shared here are purely for educational and informational purposes only. They are not intended as investment advice or a recommendation to buy, sell, or hold any financial instruments.
Please consult with your SEBI-registered financial advisor before making any trading or investment decisions.
Trading and investing in the stock market involves risk, and you should do your own research and analysis. You are solely responsible for any decisions made based on this research.
NIFTY : TRADING LEVELS AND PLAN FOR 16-JAN-2025Timeframe: 15-minute ⏱️
Gap Criteria: 100+ points ⚡
Market Structure: Pullback after a sharp sell-off, with price testing an important intraday equilibrium zone ⚖️
Scenario 1: Gap-Up Opening (100+ points) 🚀
If NIFTY opens above the 25,740–25,780 zone, it would indicate continuation of the recovery along with short covering activity 📈.
The first price reaction is expected near 25,816 (last intraday resistance). Sustained trading above 25,816 can open upside potential towards 25,921 and further towards 26,005, which is a major supply zone 🧱. Given the prevailing broader downtrend, profit booking is likely near higher levels 💼. Aggressive long positions should only be considered after a strong 15-minute candle close above the resistance area ✅.
Options Strategy for Gap-Up 🧾:
A bull call spread is preferred by buying an ATM call and selling an OTM call 🟢. Avoid taking naked call positions near 25,921 and above ⚠️. Trail stop losses aggressively to protect gains 🔒📈.
Scenario 2: Flat or Range-Bound Opening ⚖️
If NIFTY opens between 25,660 and 25,740, the market is expected to remain range-bound with higher chances of option premium decay ⏳.
This zone will act as an opening support and resistance area 🧭. The index may consolidate before revealing a clear direction 🔄. Long trades should only be initiated if price sustains above 25,816 with confirmation 🟢. A short bias can be considered only if there is a decisive breakdown below 25,558 🔴.
Options Strategy for Flat Market 🧾:
Experienced traders may consider short strangle or iron fly strategies 🕸️. Focus should remain on quick theta capture ⏳, and profits should be booked early rather than waiting until end of the day ⌛.
Scenario 3: Gap-Down Opening (100+ points) 📉
If NIFTY opens below 25,558, selling pressure is likely to resume 🔻.
Immediate support is placed in the 25,516–25,489 zone, which is the last intraday support area 🛑. A bounce from this region may offer only a short-term pullback opportunity 🔄. If the index breaks below 25,489, further downside towards 25,358 becomes possible ⬇️. Bottom-fishing should be strictly avoided without strong confirmation 🚫🎣.
Options Strategy for Gap-Down 🧾:
A bear put spread is preferred instead of naked put buying 🔴. Avoid selling put options in trending markets ⚠️. Quick profit booking is recommended due to higher volatility 💨.
Risk Management Tips for Options Trading 🛡️:
Risk only 1–2% of total capital per trade 🎯. During expiry week, price movements are faster, so exits should also be quicker ⚡. Spread strategies are preferred to manage theta decay and implied volatility risk 📉📊. Avoid revenge trading after a stop loss 🚫😤. Always wait for the first 15-minute market structure to form before initiating any position ⏱️.
Summary and Conclusion ✨:
NIFTY is currently positioned at a critical equilibrium zone after a sharp correction ⚖️. The 25,740–25,816 range remains the key bullish trigger 🟢, while 25,558 is the crucial make-or-break support 🔴. Trades should be executed strictly on confirmation, allowing the market to clearly indicate direction 👀📈.
Disclaimer ⚠️:
This analysis is shared strictly for educational purposes only 📚. I am not a SEBI-registered analyst. Markets are uncertain, and there is a possibility of being wrong 🤝. Please consult your financial advisor before taking any trade 🧑💼📑.

NIFTY KEY LEVELS FOR 14.01.2026NIFTY KEY LEVELS FOR 14.01.2026
Timeframe: 3 Minutes
If the candle stays above the pivot point, it is considered a bullish bias; if it remains below, it indicates a bearish bias. Price may reverse near Resistance 1 or Support 1. If it moves further, the next potential reversal zone is near Resistance 2 or Support 2. If these levels are also broken, we can expect the trend.
When a support or resistance level is broken, it often reverses its role; a broken resistance becomes the new support, and a broken support becomes the new resistance.
If the range(R2-S2) is narrow, the market may become volatile or trend strongly. If the range is wide, the market is more likely to remain sideways
please like and share my idea if you find it helpful
📢 Disclaimer
I am not a SEBI-registered financial adviser.
The information, views, and ideas shared here are purely for educational and informational purposes only. They are not intended as investment advice or a recommendation to buy, sell, or hold any financial instruments.
Please consult with your SEBI-registered financial advisor before making any trading or investment decisions.
Trading and investing in the stock market involves risk, and you should do your own research and analysis. You are solely responsible for any decisions made based on this research.

NIFTY : Trading levels and Plan for 14-Jan-2026📊 NIFTY Trading Plan – 14 Jan 2026
Timeframe: 15-min
Gap Consideration: 100+ points
Market Context: Short-term corrective structure with defined intraday support & resistance
🔼 SCENARIO 1: GAP UP OPENING (100+ points) 🚀
If NIFTY opens above 25,816, it indicates bullish intent toward the previous supply area.
Immediate focus will be on 25,816 (Opening Resistance).
Sustained price action above 25,816 with volume can trigger short-covering.
Upside targets:
• 25,921 (Last Intraday Resistance)
• Partial profit booking recommended near resistance.
Rejection near 25,816–25,921 zone may lead to intraday pullback.
📌 Options Strategy (Gap-Up):
• Bull Call Spread (Buy ATM CE, Sell OTM CE)
• Avoid aggressive naked CE buying near resistance
• Trail stop once premium doubles 📈
➡️ SCENARIO 2: FLAT / RANGE OPENING ⚖️
If NIFTY opens between 25,672 – 25,816, expect consolidation and option decay.
This zone acts as Opening Support/Resistance (No Trade Zone).
Directional trades only after clear breakout or breakdown.
Above 25,816 → bias shifts bullish.
Below 25,672 → selling pressure likely.
📌 Options Strategy (Flat Market):
• Short Strangle / Iron Fly (experienced traders only)
• Focus on theta decay ⏳
• Book profits early, avoid late-day overconfidence
🔽 SCENARIO 3: GAP DOWN OPENING (100+ points) 📉
If NIFTY opens below 25,672, initial sentiment remains weak.
First support to watch: 25,559 (Last Intraday Support).
A bounce from 25,559 can offer a quick pullback trade.
Breakdown below 25,559 opens downside targets:
• 25,483
Avoid counter-trend longs without confirmation.
📌 Options Strategy (Gap-Down):
• Bear Put Spread or ATM PE with strict SL
• Avoid selling PE in trending weakness
• Trail profits aggressively 📉
🧠 Risk Management Tips for Options Traders 🛡️
Risk only 1–2% of capital per trade.
Expiry-week trades demand faster exits.
Prefer spreads over naked options to manage theta & IV risk.
Wait for first 15-min candle structure before committing.
One clean trade > multiple emotional trades.
📌 Summary & Conclusion ✨
NIFTY is trading within a defined intraday range.
📍 25,672–25,816 remains the key decision zone.
Directional clarity will emerge only after acceptance outside this range.
Trade what the market confirms — not what you assume.
⚠️ Disclaimer
This analysis is shared strictly for educational purposes only.
I am not a SEBI-registered analyst.
Markets are uncertain, and I may be wrong.
Please consult your financial advisor before taking any trades.

NIFTY KEY LEVELS FOR 13.01.2026NIFTY KEY LEVELS FOR 13.01.2026
Timeframe: 3 Minutes
If the candle stays above the pivot point, it is considered a bullish bias; if it remains below, it indicates a bearish bias. Price may reverse near Resistance 1 or Support 1. If it moves further, the next potential reversal zone is near Resistance 2 or Support 2. If these levels are also broken, we can expect the trend.
When a support or resistance level is broken, it often reverses its role; a broken resistance becomes the new support, and a broken support becomes the new resistance.
If the range(R2-S2) is narrow, the market may become volatile or trend strongly. If the range is wide, the market is more likely to remain sideways
please like and share my idea if you find it helpful
📢 Disclaimer
I am not a SEBI-registered financial adviser.
The information, views, and ideas shared here are purely for educational and informational purposes only. They are not intended as investment advice or a recommendation to buy, sell, or hold any financial instruments.
Please consult with your SEBI-registered financial advisor before making any trading or investment decisions.
Trading and investing in the stock market involves risk, and you should do your own research and analysis. You are solely responsible for any decisions made based on this research.

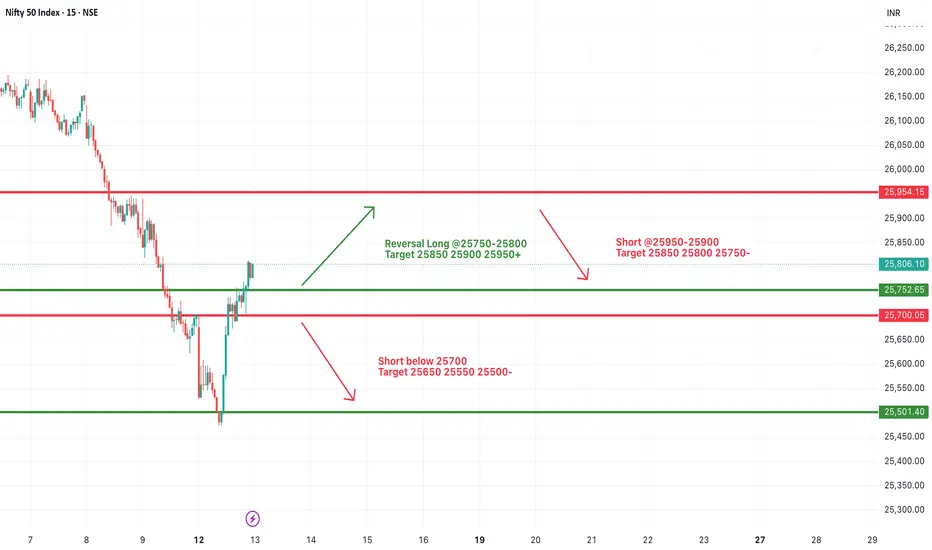
#NIFTY Intraday Support and Resistance Levels - 13/01/2026A flat opening is expected in Nifty 50, with the index trading near the 25,800–25,820 zone, which is acting as a short-term balance area after the recent sharp recovery from lower levels. The bounce from the 25,500–25,550 support zone indicates short-covering and selective buying, but overall price action still reflects a cautious and range-bound environment. The market is currently waiting for a clear directional trigger before committing to a stronger move.
On the upside, a sustained hold above 25,850–25,900 will be crucial to confirm bullish continuation. If this zone is reclaimed and held, long positions can be considered with upside targets at 25,950, 26,000, and 26,050+. A decisive breakout above 25,950 may invite fresh buying momentum and improve short-term sentiment.
On the downside, failure to sustain above 25,750 may weaken the recovery attempt. A break below 25,700 can reintroduce selling pressure, opening downside targets at 25,650, 25,550, and 25,500-, where strong demand is expected again. Until a clear breakout or breakdown occurs, traders should continue to focus on range-based trades, keep strict stop-losses, and avoid aggressive directional bets.
NIFTY : Trading levels and Plan for 13-Jan-2025
Timeframe: 15-min
Gap Consideration: 100+ points
Market Structure: Pullback after sharp recovery, now approaching key supply zone
🔼 SCENARIO 1: GAP UP OPENING (100+ points) 🚀
If NIFTY opens above 25,923, it indicates a continuation attempt into the previous intraday supply zone.
Initial reaction near 25,923–26,005 is crucial (previous resistance).
Sustainability above 25,923 with volume = bullish acceptance.
Upside targets:
• 26,005 (last intraday resistance)
• 26,075 (upper resistance / supply zone)
Failure to hold above 25,923 may lead to pullback toward the opening range.
📌 Options Strategy (Gap-Up):
• Bull Call Spread (e.g., Buy ATM CE & Sell OTM CE)
• Avoid naked CE buying near resistance
• Partial profit booking recommended near 26,005+
➡️ SCENARIO 2: FLAT / RANGE-BOUND OPENING ⚖️
If NIFTY opens between 25,743 – 25,816, expect range behaviour and option decay.
This zone acts as Opening Support/Resistance + No-Trade Area.
Wait for a clear breakout or breakdown before initiating trades.
Above 25,816 with hold → bullish continuation possible.
Below 25,743 → weakness resumes toward lower supports.
📌 Options Strategy (Flat Market):
• Short Strangle / Iron Fly (only for experienced traders)
• Focus on theta decay, tight SL mandatory
• Book profits early; do not hold till late expiry hours
🔽 SCENARIO 3: GAP DOWN OPENING (100+ points) 📉
If NIFTY opens below 25,743, selling pressure may dominate initially.
First support to watch: 25,640 (last intraday support).
A bounce from 25,640 can give a pullback trade.
Breakdown below 25,640 opens downside targets:
• 25,545
• Further weakness if momentum accelerates
Avoid aggressive longs unless strong reversal confirmation appears.
📌 Options Strategy (Gap-Down):
• Bear Put Spread or ATM PE buy with strict SL
• Avoid selling PE in trending breakdown
• Trail profits aggressively on downside moves
🧠 Risk Management Tips for Options Traders 🛡️
Never risk more than 1–2% of capital per trade.
Expiry trades require faster exits — do not expect positional moves.
Prefer spreads over naked options to control theta & volatility risk.
Trade only after first 15-min structure is clear.
One good trade is enough — overtrading kills edge.
📌 Summary & Conclusion ✨
NIFTY is currently at a decision zone after a sharp pullback recovery.
📍 25,743–25,816 remains the key battle area.
Directional bias will only be clear after acceptance outside this range.
Let price confirm — react, don’t predict.
⚠️ Disclaimer
This analysis is shared strictly for educational purposes only.
I am not a SEBI-registered analyst.
Markets are uncertain, and I may be wrong.
Please consult your financial advisor before taking any trades.

NIFTY KEY LEVELS FOR 12.01.2026NIFTY KEY LEVELS FOR 12.01.2026
Timeframe: 3 Minutes
If the candle stays above the pivot point, it is considered a bullish bias; if it remains below, it indicates a bearish bias. Price may reverse near Resistance 1 or Support 1. If it moves further, the next potential reversal zone is near Resistance 2 or Support 2. If these levels are also broken, we can expect the trend.
When a support or resistance level is broken, it often reverses its role; a broken resistance becomes the new support, and a broken support becomes the new resistance.
If the range(R2-S2) is narrow, the market may become volatile or trend strongly. If the range is wide, the market is more likely to remain sideways
please like and share my idea if you find it helpful
📢 Disclaimer
I am not a SEBI-registered financial adviser.
The information, views, and ideas shared here are purely for educational and informational purposes only. They are not intended as investment advice or a recommendation to buy, sell, or hold any financial instruments.
Please consult with your SEBI-registered financial advisor before making any trading or investment decisions.
Trading and investing in the stock market involves risk, and you should do your own research and analysis. You are solely responsible for any decisions made based on this research.

NIFTY : Trading levels and Plan for 12-Jan-2026(Timeframe: 15-min | Gap criteria considered: 100+ points)
🔑 Key Levels (from chart)
Last Intraday Resistance: 25,998
Opening Resistance Zone: 25,742 – 25,816
Spot / Pivot Area: 25,700
Opening Support Zone: 25,592 – 25,647
Last Intraday Support: 25,353
🧠 Market structure note: NIFTY is in a short-term downtrend, but currently showing a relief bounce from demand. Price is approaching an important supply zone, where rejection risk remains high unless acceptance improves.
🟢 1. GAP-UP OPENING (100+ Points)
If NIFTY opens above 25,742, it will be a pullback rally into resistance.
🎓 Educational Insight
Gap-ups in a corrective downtrend often face selling near supply zones. Strength is confirmed only when price holds above resistance, not just spikes.
Plan of Action
Avoid aggressive longs in the first 15 minutes ⏳
Sustain above 25,816 → move toward 25,998
Rejection from 25,742 – 25,816 → pullback toward 25,700
Fresh longs only after retest + higher low
Options idea: Bull Call Spread (ATM buy + OTM sell)
🟡 2. FLAT OPENING
If NIFTY opens near 25,680 – 25,720, expect range-bound and volatile price action.
🎓 Educational Insight
Flat opens near VWAP / pivot after a sell-off usually result in false breakouts. Direction emerges only after range expansion with volume.
Plan of Action
Above 25,742 → upside toward 25,816
Failure above 25,742 → sideways to weak bias
Break below 25,592 → selling toward 25,353
Avoid trades inside the middle range 🚫
Options idea: Iron Fly / Short Strangle with hedge
🔴 3. GAP-DOWN OPENING (100+ Points)
If NIFTY opens below 25,592, bears remain firmly in control.
🎓 Educational Insight
Gap-downs into demand can cause short covering bounces, but continuation happens if price fails to reclaim the opening range.
Plan of Action
First support to watch: 25,592 – 25,647
Weak bounce + rejection → downside toward 25,353
Sustain below 25,353 → further trend continuation
Avoid fresh shorts exactly at support
Options idea: Bear Put Spread / Put Debit Spread
🛡️ Risk Management Tips (Options Trading)
Risk only 1–2% capital per trade 💰
Prefer spreads over naked buying in volatile zones
Book partial profits at resistance/support levels
No averaging against the trend 🚫
Stop trading after 2 consecutive losses 🧠
🧾 Summary & Conclusion
Above 25,816: Relief rally toward 25,998
25,742 – 25,816: Selling / supply zone
Below 25,592: Weakness toward 25,353
Focus on price acceptance, not prediction 🎯
⚠️ Disclaimer
I am not a SEBI-registered analyst. This trading plan is for educational purposes only. Markets are risky, and I may be wrong. Please consult a qualified financial advisor before taking trades.

Dalal Street Bleeds: Where Is NIFTY Headed Next?Indian markets witnessed a sharp sell-off last week, with the benchmark NIFTY closing 2.45% lower, as weak global cues and rising uncertainty dragged investor sentiment.
Adding to the caution, India VIX NSE:INDIAVIX jumped nearly 16%, settling at 10.92 after hitting multi-month lows earlier. This sudden spike in volatility clearly signals growing nervousness among market participants.
◉ Technical Picture Turns Weak
For the past few weeks, we consistently highlighted the formation of a Rising Wedge pattern on the daily chart—typically a bearish setup.
With Friday’s close below the wedge support, NIFTY has now confirmed a downside breakout, indicating that further pressure may persist in the near term.
To add to the concern, a Double Top pattern has also emerged on the charts, strengthening the bearish undertone for the coming sessions.
◉ Key Levels to Watch
Resistance Zone: 26,000 – 26,100
This area has now turned into a strong resistance, backed by heavy call writing, making it difficult for NIFTY to move higher in the short term.
Support Zone: 25,500 – 25,400
This is the immediate support area to watch closely.
A decisive break below this zone could open the door for a sharp 500-point fall, pulling the index closer to the 25,000 level.
◉ Key Triggers for the Upcoming Week
Q3 Earnings Season Kicks Off
Market focus will be on IT majors—TCS NSE:TCS , Infosys NSE:INFY , HCL Tech NSE:HCLTECH , Wipro NSE:WIPRO , and Tech Mahindra NSE:TECHM —along with heavyweights like Reliance Industries NSE:RELIANCE and HDFC Bank NSE:HDFCBANK . Earnings numbers and management commentary will play a crucial role in shaping near-term sentiment.
US Tariff Verdict
The US Supreme Court’s ruling on January 14 regarding Trump’s tariffs remains a major overhang. This decision could act as a key directional trigger, not just for India but for global and emerging markets as well.
◉ Outlook for the Coming Week
With weak global cues, rising volatility, and clear technical breakdowns, the market is likely to remain highly volatile, with a negative bias in the near term.
◉ What Traders Should Do
With volatility on the rise and technicals weakening, aggressive long positions can quickly turn risky. Until NIFTY shows stability above key support levels, traders are better off staying cautious, protecting existing profits, and focusing only on selective stocks that continue to show relative strength rather than chasing broad market moves.

Nifty50A key critical support level at yellow trend line as breached, if next daily candle could not sustain that yellow line then chances are high it could test below floor support level at 24430 or to the white line within last week of January .
The above analysis will be invalid if white dashed line marked as (resistance) level breached and a daily candle sustains above that level.
Disclaimer :
It's a personal view not a financial advice and I assume no responsibility and liability whatever outcome arises.

NIFTY KEY LEVELS FOR 09.01.2026NIFTY KEY LEVELS FOR 09.01.2026
Timeframe: 3 Minutes
If the candle stays above the pivot point, it is considered a bullish bias; if it remains below, it indicates a bearish bias. Price may reverse near Resistance 1 or Support 1. If it moves further, the next potential reversal zone is near Resistance 2 or Support 2. If these levels are also broken, we can expect the trend.
When a support or resistance level is broken, it often reverses its role; a broken resistance becomes the new support, and a broken support becomes the new resistance.
If the range(R2-S2) is narrow, the market may become volatile or trend strongly. If the range is wide, the market is more likely to remain sideways
please like and share my idea if you find it helpful
📢 Disclaimer
I am not a SEBI-registered financial adviser.
The information, views, and ideas shared here are purely for educational and informational purposes only. They are not intended as investment advice or a recommendation to buy, sell, or hold any financial instruments.
Please consult with your SEBI-registered financial advisor before making any trading or investment decisions.
Trading and investing in the stock market involves risk, and you should do your own research and analysis. You are solely responsible for any decisions made based on this research

NIFTY : Trading levels and Plan for 09-Jan-2026
(Timeframe: 15-min | Gap criteria considered: 100+ points)
🔑 Key Levels from Chart
Major Upside Resistance: 26,115
Last Intraday Resistance: 26,032
No-Trade / Supply Zone: 25,839 – 25,932
Opening Support / Pivot: 25,839
Last Intraday Support: 25,741
Lower Support Extension: 25,587
🧠 Market context: NIFTY is in a short-term corrective structure after a strong sell-off. Price is consolidating inside a well-defined no-trade zone, indicating balance before the next directional move.
🟢 1. GAP-UP OPENING (100+ Points)
If NIFTY opens above 25,932, it signals short-covering but into a supply zone.
🎓 Educational Insight
Gap-ups after a decline often face selling pressure near VWAP/supply zones. Sustainable upside requires acceptance above resistance, not just an opening spike.
Plan of Action
Avoid chasing longs in first 15 minutes ⏳
Sustain above 26,032 → upside toward 26,115
Rejection near 26,032 → pullback to 25,932 – 25,839
Fresh longs only on retest + higher low formation
Options idea: Bull Call Spread (ATM buy + OTM sell)
🟡 2. FLAT OPENING
If NIFTY opens inside 25,839 – 25,932, expect range-bound & whipsaw action.
🎓 Educational Insight
Flat opens within supply-demand overlap zones usually lead to false breakouts. Direction emerges only after range expansion with volume.
Plan of Action
Above 25,932 with hold → move toward 26,032
Failure above 25,932 → sideways to negative bias
Break below 25,839 → weakness toward 25,741
Avoid trades in mid-range 🚫
Options idea: Iron Fly / Hedged Short Strangle if volatility drops
🔴 3. GAP-DOWN OPENING (100+ Points)
If NIFTY opens below 25,839, bears remain in control.
🎓 Educational Insight
Gap-downs into prior supports can trigger panic selling, but sharp bounces are also common. Always wait for price confirmation.
Plan of Action
First demand zone: 25,741
Strong rejection from 25,741 → intraday bounce possible
Break & sustain below 25,741 → slide toward 25,587
Avoid fresh shorts exactly at support
Options idea: Bear Put Spread or Put Debit Spread
🛡️ Risk Management Tips (Options Trading)
Risk only 1–2% capital per trade 💰
Prefer spreads over naked buying in volatile zones
Book partial profits near resistance/support
No averaging against trend 🚫
Stop trading after 2 consecutive losses 🧠
🧾 Summary & Conclusion
Above 26,032: Short-term bullish toward 26,115
25,839 – 25,932: No-Trade / Chop Zone
Below 25,839: Weakness toward 25,741 → 25,587
Focus on price acceptance, not prediction 🎯
⚠️ Disclaimer
I am not a SEBI-registered analyst. This analysis is strictly for educational purposes only. Markets involve risk—please consult a certified financial advisor before trading.

NIFTY KEY LEVELS FOR 08.01.2026NIFTY KEY LEVELS FOR 08.01.2026
Timeframe: 3 Minutes
If the candle stays above the pivot point, it is considered a bullish bias; if it remains below, it indicates a bearish bias. Price may reverse near Resistance 1 or Support 1. If it moves further, the next potential reversal zone is near Resistance 2 or Support 2. If these levels are also broken, we can expect the trend.
When a support or resistance level is broken, it often reverses its role; a broken resistance becomes the new support, and a broken support becomes the new resistance.
If the range(R2-S2) is narrow, the market may become volatile or trend strongly. If the range is wide, the market is more likely to remain sideways
please like and share my idea if you find it helpful
📢 Disclaimer
I am not a SEBI-registered financial adviser.
The information, views, and ideas shared here are purely for educational and informational purposes only. They are not intended as investment advice or a recommendation to buy, sell, or hold any financial instruments.
Please consult with your SEBI-registered financial advisor before making any trading or investment decisions.
Trading and investing in the stock market involves risk, and you should do your own research and analysis. You are solely responsible for any decisions made based on this research

#NIFTY Intraday Support and Resistance Levels - 08/01/2026A flat opening is expected in Nifty 50, with the index continuing to trade within the same broader range seen over the last few sessions. Price is currently hovering around the 26,150 zone, which is acting as a short-term balance area after the recent pullback. This indicates that the market is still consolidating, and traders should wait for confirmation before taking aggressive directional trades.
On the upside, a sustained move above 26,250 will be the key bullish trigger. If Nifty manages to hold above this level, long positions can be considered with upside targets at 26,350, 26,400, and 26,450+. A clean breakout above this resistance may lead to renewed buying interest and continuation of the broader uptrend.
On the downside, if the index faces rejection near 26,200–26,180 and slips below this zone, a reversal short setup may come into play. In such a scenario, downside targets would be 26,150, 26,100, and 26,050-, where strong demand and support are expected. Until a clear breakout or breakdown occurs, traders should focus on range-based trading, maintain strict stop losses, and avoid over-leveraging in a sideways market.

NIFTY : Trading levels and Plan for 08-Jan-2026NIFTY Trading Plan for 8-Jan-2026
(Timeframe: 15-min | Gap criteria: 100+ points)
🔑 Key Reference Levels (from chart)
Upper Resistance / Extension: 26,412 – 26,415
Last Intraday Resistance: 26,308
Opening Resistance / No-Trade Zone: 26,184 – 26,220
Immediate Pivot (CMP area): ~26,143
Opening Support: 26,080
Last Intraday Support: 26,042
Buyer’s Support Zone: 25,904 – 25,931
🧠 Market context: After a strong up-move, NIFTY corrected and is now trading below a major resistance band (26,184–26,220). This zone is crucial—expect choppy price action unless there is a clean acceptance above or rejection below.
🟢 1. GAP-UP OPENING (100+ Points)
If NIFTY opens above 26,220, bulls appear strong but face immediate supply.
🎓 Educational View
Gap-ups near resistance often trap late buyers. Sustainable upside needs holding above resistance, not just a spike.
Plan of Action
Avoid first 10–15 minutes; observe price behavior.
Sustain above 26,220 → move toward 26,308.
Acceptance above 26,308 opens path to 26,412–26,415.
Repeated rejection near 26,308 → expect pullback to 26,220 → 26,184.
Options idea: Bull Call Spread (ATM Buy + OTM Sell) to control theta.
🟡 2. FLAT OPENING
If NIFTY opens between 26,080 – 26,220, expect range-bound & whipsaw moves.
🎓 Educational View
Flat opens near a supply zone reflect indecision. Direction comes only after range expansion + volume.
Plan of Action
Above 26,220 → bullish bias toward 26,308.
Failure near 26,220 keeps market rotating inside the range.
Break & sustain below 26,080 → weakness toward 26,042.
Avoid over-trading inside the no-trade zone.
Options idea: Iron Fly / Narrow Strangle (small size) if range persists.
🔴 3. GAP-DOWN OPENING (100+ Points)
If NIFTY opens below 26,080, sentiment turns cautious.
🎓 Educational View
Gap-downs into support zones can trigger panic selling, followed by either short covering or continuation—confirmation is key.
Plan of Action
First support to watch: 26,042.
Break & hold below 26,042 → decline toward 25,931 → 25,904.
Strong bullish rejection from 26,042–26,080 may offer bounce trades.
Avoid aggressive shorts directly at buyer’s zone.
Options idea: Bear Put Spread instead of naked puts.
🛡️ Risk Management Tips (Options Trading)
Risk only 1–2% of capital per trade.
Prefer spreads near resistance/support to manage theta decay.
Use time-based exits if premium stagnates for 15–20 mins.
Book partial profits early; trail the rest 📉📈
One bad trade ≠ revenge trading 🚫
🧾 Summary & Conclusion
Above 26,220: Bulls regain control → 26,308 → 26,412
26,080–26,220: Choppy zone → patience is key
Below 26,080: Weakness toward 26,042 → 25,931
Trade price reaction at levels, not predictions 🎯
⚠️ Disclaimer
I am not a SEBI-registered analyst. This analysis is strictly for educational purposes only. Markets involve risk—please consult a certified financial advisor before trading.

NIFTY KEY LEVELS FOR 07.01.2026NIFTY KEY LEVELS FOR 07.01.2026
Timeframe: 3 Minutes
If the candle stays above the pivot point, it is considered a bullish bias; if it remains below, it indicates a bearish bias. Price may reverse near Resistance 1 or Support 1. If it moves further, the next potential reversal zone is near Resistance 2 or Support 2. If these levels are also broken, we can expect the trend.
When a support or resistance level is broken, it often reverses its role; a broken resistance becomes the new support, and a broken support becomes the new resistance.
If the range(R2-S2) is narrow, the market may become volatile or trend strongly. If the range is wide, the market is more likely to remain sideways
please like and share my idea if you find it helpful
📢 Disclaimer
I am not a SEBI-registered financial adviser.
The information, views, and ideas shared here are purely for educational and informational purposes only. They are not intended as investment advice or a recommendation to buy, sell, or hold any financial instruments.
Please consult with your SEBI-registered financial advisor before making any trading or investment decisions.
Trading and investing in the stock market involves risk, and you should do your own research and analysis. You are solely responsible for any decisions made based on this research

NIFTY : Trading plan for 07-Jan-2026
(Timeframe: 15-min | Gap consideration: 100+ points)
Key Levels to Track (from chart)
Upper Resistance / Extension: 26,392
Last Intraday Resistance: 26,320
Opening Resistance (Gap-up case): 26,250
Opening Support / Resistance (Pivot): 26,183 – 26,175
Opening Support (Gap-down case): 26,042 – 26,080
Last Intraday Support: 25,983
Lower Extreme Support: 25,839
🧠 Context: After a strong prior up-move, price corrected and is now hovering near a pivot band (26,183–26,175). Expect whipsaws early; clean direction needs acceptance above/below the pivot.
🟢 1. GAP-UP OPENING (100+ Points)
If NIFTY opens above 26,250, the market signals bullish intent but immediately faces overhead supply.
🎓 Educational Explanation:
Gap-ups near resistance often see early profit booking. Sustainable upside requires price acceptance (holding above levels on a 15-min close), not just a spike.
Plan of Action:
Avoid the first 10–15 mins; let volatility settle.
Sustain above 26,250 → test 26,320 (last intraday resistance).
Acceptance above 26,320 opens path toward 26,392.
Repeated rejection near 26,320 → expect pullback toward 26,250 → 26,183.
Options idea: Bull Call Spread (ATM buy + OTM sell) to reduce theta risk near resistance.
🟡 2. FLAT OPENING
If NIFTY opens inside 26,175–26,250, expect a range-bound start.
🎓 Educational Explanation:
Flat opens inside a pivot zone reflect indecision. Direction emerges only after a range expansion with volume.
Plan of Action:
Above 26,250 → bullish bias toward 26,320.
Failure at 26,250 keeps price rotating within 26,183–26,175.
Break & hold below 26,175 shifts bias toward 26,080 → 26,042.
Wait for 15-min close + volume before committing.
Options idea: Iron Fly / Narrow Strangle (light size) if range persists.
🔴 3. GAP-DOWN OPENING (100+ Points)
If NIFTY opens below 26,175, sentiment turns cautious.
🎓 Educational Explanation:
Gap-downs into support can trigger panic selling, followed by either short covering or continuation. Confirmation matters.
Plan of Action:
First watch zone: 26,080–26,042.
Sustain below 26,042 → downside toward 25,983.
Break of 25,983 increases probability of 25,839.
Strong bullish rejection from 26,080–26,042 may offer intraday bounce longs.
Options idea: Bear Put Spread (avoid naked puts near supports).
⚙️ Risk Management Tips for Options Trading 🛡️
Risk only 1–2% of capital per trade.
Prefer spreads near major levels to manage theta & IV.
Use time-based exits if premium stalls for 15–20 mins.
Book partials early; trail the rest.
No revenge trades after SL.
🧾 Summary & Conclusion
Above 26,250: Bulls active; hurdles at 26,320 → 26,392
26,175–26,250: Choppy pivot → patience pays
Below 26,175: Weakness toward 26,080 → 26,042 → 25,983
Trade reaction at levels, not predictions 🚦
⚠️ Disclaimer
I am not a SEBI-registered analyst. This content is for educational purposes only. Markets involve risk—consult your financial advisor before trading.

NIFTY KEY LEVELS FOR 06.01.2026NIFTY KEY LEVELS FOR 06.01.2026
Timeframe: 3 Minutes
If the candle stays above the pivot point, it is considered a bullish bias; if it remains below, it indicates a bearish bias. Price may reverse near Resistance 1 or Support 1. If it moves further, the next potential reversal zone is near Resistance 2 or Support 2. If these levels are also broken, we can expect the trend.
When a support or resistance level is broken, it often reverses its role; a broken resistance becomes the new support, and a broken support becomes the new resistance.
If the range(R2-S2) is narrow, the market may become volatile or trend strongly. If the range is wide, the market is more likely to remain sideways
please like and share my idea if you find it helpful
📢 Disclaimer
I am not a SEBI-registered financial adviser.
The information, views, and ideas shared here are purely for educational and informational purposes only. They are not intended as investment advice or a recommendation to buy, sell, or hold any financial instruments.
Please consult with your SEBI-registered financial advisor before making any trading or investment decisions.
Trading and investing in the stock market involves risk, and you should do your own research and analysis. You are solely responsible for any decisions made based on this research

#NIFTY Intraday Support and Resistance Levels - 06/01/2026A flat to mildly cautious opening is expected in Nifty 50, with price currently trading near the 26,240–26,260 zone, which is acting as a short-term decision area. After the recent up-move, the index has paused near this zone, indicating profit booking and consolidation rather than fresh aggressive buying. This confirms that the market is waiting for a clear directional trigger before committing to the next move.
On the upside, a sustained move above 26,250 will be the key bullish trigger. If Nifty manages to hold above this level, long positions can be considered with upside targets at 26,350, 26,400, and 26,450+. A clean breakout and acceptance above 26,250–26,300 may invite follow-through buying and continuation of the broader bullish structure.
On the downside, if the index fails to sustain and breaks below 26,200, selling pressure may increase. In such a scenario, short trades can be planned with downside targets at 26,150, 26,100, and 26,000-, where strong support is expected to emerge. Until a decisive breakout or breakdown occurs, traders should remain disciplined, focus on level-based execution, and avoid aggressive trades during this consolidation phase.
