Nifty analysis for 20/01/2025.Major levels
Support :-23130, 23050
Resistance ;- 23280, 23350, 23586
Market is still in a down trend on the major cycle. Bullish trend will only be confirmed once nifty starts trading above 24200 levels.
For now the market is for sell on rise.
Wait for the price action and enter only confirm trades as the volatility in the market is not giving any intraday opportunities to the trades.
Niftylevels

Nifty Week AheadNSE:NIFTY is down 11.7% off its High Trading at a PE of 21.4x
Trade Setup:
It can be a Good 1:1 RISK-REWARD Trade. If the Base S1 is Broken it can further correct to Base S2. NSE:NIFTY is now in a downtrend Making Lower Low and Lower High on Daily Charts so there is a higher Probability.
Target(Take Profit):
21700 Levels or 100 WEMA for Positional & Swing Trader.
Stop-Loss:
Weekly Close above 50 WEMA For Swing Trader and 24700 for Positional Trader.
📌Thank you for exploring my idea! I hope you found it valuable.
🙏FLLOW for more
👍BOOST if useful
✍️COMMENT Below your views.
Meanwhile, check out my other stock ideas below until this trade is activated. I would love your feedback.
Disclaimer: This analysis is intended solely for informational and educational purposes and should not be interpreted as financial advice. It is advisable to consult a qualified financial advisor or conduct thorough research before making investment decisions.

NIFTY Intraday Trade Setup For 20 Jan 2025NIFTY Intraday Trade Setup For 20 Jan 2025
Bullish-Above 23320
Invalid-Below 23270
T- 23500+
Bearish-Below 23090
Invalid-Above 23140
T- 23850
NIFTY has closed on a bearish note with almost 1% cut last week. Weekly candle is a doji which can act as a continuation or reversal based on breakout of either high or low. In case low is broken then journey towards 21700 zone as per ABCD will proceed. In case 23400 is reclaimed then there will be a reversal scenario. 23320 and 23090 are Intraday levels for Monday's session.
Coming to Monday's trade setup, if index opens flat and a 15 Min candle closes above 23320 then we will long for the target of 23510. Pullback needed before breakout.
For selling we need a 15 Min candle close below 23090. T- 22850.
In case of a big gap up/down, wait till 10 o'clock and mark the high and low of the trading range (5MIN). Trade on this range breakout.
==========
I am Not SEBI Registered
This is my personal analysis for my personal trading. Kindly consult your financial advisor before taking any actions based on this.

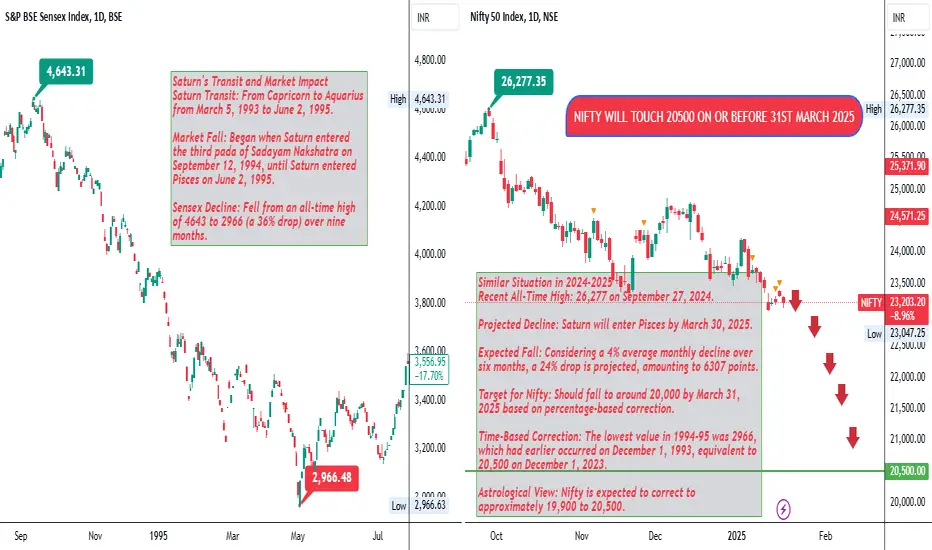
Nifty Astro Technical Analysis from September 2024 to March 2025Saturn's Transit and Market Impact
Saturn Transit: From Capricorn to Aquarius from March 5, 1993 to June 2, 1995.
Market Fall: Began when Saturn entered the third pada of Sadayam Nakshatra on September 12, 1994, until Saturn entered Pisces on June 2, 1995.
Sensex Decline: Fell from an all-time high of 4643 to 2966 (a 36% drop) over nine months.
Similar Situation in 2024-2025
Recent All-Time High: 26,277 on September 27, 2024.
Projected Decline: Saturn will enter Pisces by March 30, 2025.
Expected Fall: Considering a 4% average monthly decline over six months, a 24% drop is projected, amounting to 6307 points.
Target for Nifty: Should fall to around 20,000 by March 31, 2025 based on percentage-based correction.
Time-Based Correction: The lowest value in 1994-95 was 2966, which had earlier occurred on December 1, 1993, equivalent to 20,500 on December 1, 2023.
Astrological View: Nifty is expected to correct to approximately 19,900 to 20,500.
Disclaimer:
I am not Sebi Registered. This analysis is based on historical data, astrological patterns, and market trends. Past performance is not indicative of future results. Trading and investment involve risks, and you should conduct your own research or consult with a financial advisor before making any decisions.
Nifty levels - Jan 20, 2025Nifty support and resistance levels are valuable tools for making informed trading decisions, specifically when combined with the analysis of 5-minute timeframe candlesticks and VWAP. By closely monitoring these levels and observing the price movements within this timeframe, traders can enhance the accuracy of their entry and exit points. It is important to bear in mind that support and resistance levels are not fixed, and they can change over time as market conditions evolve.
The dashed lines on the chart indicate the reaction levels, serving as additional points of significance to consider. Furthermore, take note of the response at the levels of the High, Low, and Close values from the day prior.
We hope you find this information beneficial in your trading endeavors.
* If you found the idea appealing, kindly tap the Boost icon located below the chart. We encourage you to share your thoughts and comments regarding it.
Wishing you success in your trading activities!

NIFTY MATHEMATICAL LEVELSThese Levels are based on purely mathematical calculations.
Validity of levels are upto expiry of current week.
How to use these levels :-
* Mark these levels on your chart.
* Safe players Can use 15 min Time Frame
* Risky Traders Can use 5 min. Time Frame
* When Candle give Breakout / Breakdown to any level we have to enter with High/Low of that breaking candle.
* Targets will be another level marked on chart
* Stop Loss will be Low/High of that Breaking Candle.
* Trail your SL with every candle.
* Avoid Big Candles as SL will be high then.
* This is one of the Best Risk Reward Setup.
For Educational purpose only

NIFTY Intraday Trade Setup For 17 Jan 2024NIFTY Intraday Trade Setup For 17 Jan 2024
Bullish-Above 23450
Invalid-Below 23400
T- 23600+
Bearish-Below 23270
Invalid-Above 23320
T- 23080
NIFTY has closed with 0.42% gain today. It opened with a big gap but could not sustain that and ended on intraday decline. Tomorrow 23450 will be important level for bullish move, we need a pullback breakout setup to consider this. Plain vanilla short below 23250 after flat opening.
Coming to Friday's trade setup, of index opens flat and a 15 Min candle closes above 23450 then we will long for the target of 23600.
For selling we need a 15 Min candle close below 23270. T- 23080.
In case of a big gap up/down, wait till 10 o'clock and mark the high and low of the trading range (5MIN). Trade on this range breakout.
==========
I am Not SEBI Registered
This is my personal analysis for my personal trading. Kindly consult your financial advisor before taking any actions based on this.

Nifty levels - Jan 17, 2025Nifty support and resistance levels are valuable tools for making informed trading decisions, specifically when combined with the analysis of 5-minute timeframe candlesticks and VWAP. By closely monitoring these levels and observing the price movements within this timeframe, traders can enhance the accuracy of their entry and exit points. It is important to bear in mind that support and resistance levels are not fixed, and they can change over time as market conditions evolve.
The dashed lines on the chart indicate the reaction levels, serving as additional points of significance to consider. Furthermore, take note of the response at the levels of the High, Low, and Close values from the day prior.
We hope you find this information beneficial in your trading endeavors.
* If you found the idea appealing, kindly tap the Boost icon located below the chart. We encourage you to share your thoughts and comments regarding it.
Wishing you success in your trading activities!

Nifty weekly expiry analysis for 16/01/2025For last 2 trading session nifty is consolidating in a box, while banknifty is moving 400-500 points in intraday and tomorrow is it's weekly expiry.
If the market starts trading outside the box, there is high probability of forming a trending day for the index.
Market had respected the round number support of 23k. It can either retest the support or even breach the recent low to test the support trendline.
Major levels (for intraday)
Support :- 23135, 23000
Resistance :- 23285, 23380
Wait and watch the price action for confirming the direction and intensity of the move.

Nifty levels - Jan 16, 2025Nifty support and resistance levels are valuable tools for making informed trading decisions, specifically when combined with the analysis of 5-minute timeframe candlesticks and VWAP. By closely monitoring these levels and observing the price movements within this timeframe, traders can enhance the accuracy of their entry and exit points. It is important to bear in mind that support and resistance levels are not fixed, and they can change over time as market conditions evolve.
The dashed lines on the chart indicate the reaction levels, serving as additional points of significance to consider. Furthermore, take note of the response at the levels of the High, Low, and Close values from the day prior.
We hope you find this information beneficial in your trading endeavors.
* If you found the idea appealing, kindly tap the Boost icon located below the chart. We encourage you to share your thoughts and comments regarding it.
Wishing you success in your trading activities!

Nifty: Breakdown Structure in PlayNifty has entered a breakdown structure around 23,460. Sustaining below this level could lead to a test of the 22,700 zone.
Bulls may regain strength only if Nifty reclaims the 23,500 area. Watch these levels closely for the next move.
Disclaimer :
This analysis is for informational purposes only and not financial advice. Conduct your own research or consult a financial advisor before making trading or investment decisions.

Nifty key levels for 15.01.2025Nifty key levels for 15.01.2025
If Nifty breaks the upper or lower range, we can expect momentum. The consolidation zone will be favorable for option sellers, while a breakout on either side will benefit option buyers.
Disclaimer:
These views are purely educational in nature. You are solely responsible for any decisions made based on this research.

Nifty levels - Jan 15, 2025Nifty support and resistance levels are valuable tools for making informed trading decisions, specifically when combined with the analysis of 5-minute timeframe candlesticks and VWAP. By closely monitoring these levels and observing the price movements within this timeframe, traders can enhance the accuracy of their entry and exit points. It is important to bear in mind that support and resistance levels are not fixed, and they can change over time as market conditions evolve.
The dashed lines on the chart indicate the reaction levels, serving as additional points of significance to consider. Furthermore, take note of the response at the levels of the High, Low, and Close values from the day prior.
We hope you find this information beneficial in your trading endeavors.
* If you found the idea appealing, kindly tap the Boost icon located below the chart. We encourage you to share your thoughts and comments regarding it.
Wishing you success in your trading activities!

Nifty Prediction this week 14- 17Jan Nifty as we predicted went to 23350 bounced a little and went even deep.
It is wave Z of C and min. 22980 should be seen. I am expecting 22900-830 too. Levels and reasoning behind are fibonacci. Given in chart with explanation

Analysis of Banknifty for 14 jan 2025Today bank nifty broke its 48,800 support level. Next possible support will be between 46,900 to 46,300

Nifty levels - Jan 14. 2025Nifty support and resistance levels are valuable tools for making informed trading decisions, specifically when combined with the analysis of 5-minute timeframe candlesticks and VWAP. By closely monitoring these levels and observing the price movements within this timeframe, traders can enhance the accuracy of their entry and exit points. It is important to bear in mind that support and resistance levels are not fixed, and they can change over time as market conditions evolve.
The dashed lines on the chart indicate the reaction levels, serving as additional points of significance to consider. Furthermore, take note of the response at the levels of the High, Low, and Close values from the day prior.
We hope you find this information beneficial in your trading endeavors.
* If you found the idea appealing, kindly tap the Boost icon located below the chart. We encourage you to share your thoughts and comments regarding it.
Wishing you success in your trading activities!


Nifty Positional Trade Setup!Strong Support Zone - 23300 If Nifty Closed Below 23300 Daily Basis, Deploy Fresh Short Positions With Stop - 23450, For Target - 22600.

Nifty 50 support zoneNifty support zone 22600 levels if nifty breaks 23000 levels. A huge open interest in the 23000 put options in the current expiry. So, please be careful in next week's trades. Good luck.

NIFTY analysis Monday Trade setup with support and resistance. Nifty 50 Analysis
There is a possibility that we open a little or more gap down may be around 200 points. So we have to decide how to plan further.
Two possibilities from here.
1. We break down and see big sell off up to 150-200-300 points.
2. We may see bear trap and move upward if sustain above previous low.

Nifty weekly analysis for 13/01/2025.The weekly charts of the index is looking bearish as the market has closed around the 50 EMA.
A strong support around the 23400 levels is there. The support has been tested 2-3 times and it is weakening the levels.
If the support levels is breached it can test the lower support level of 22k.
Sell on rise the market is there. On daily charts market has reversed from the levels but bullish trades can only be trade once the previous resistance level is taken out.
Major levels
Support :- 22340, 22650
Resistance :- 23750, 24175
Wait for the price action near the levels before entering the market.

Nifty levels - Jan 13, 2025Nifty support and resistance levels are valuable tools for making informed trading decisions, specifically when combined with the analysis of 5-minute timeframe candlesticks and VWAP. By closely monitoring these levels and observing the price movements within this timeframe, traders can enhance the accuracy of their entry and exit points. It is important to bear in mind that support and resistance levels are not fixed, and they can change over time as market conditions evolve.
The dashed lines on the chart indicate the reaction levels, serving as additional points of significance to consider. Furthermore, take note of the response at the levels of the High, Low, and Close values from the day prior.
We hope you find this information beneficial in your trading endeavors.
* If you found the idea appealing, kindly tap the Boost icon located below the chart. We encourage you to share your thoughts and comments regarding it.
Wishing you success in your trading activities!

NIFTY ready for the Bullish moveLooking at the structure nifty is ready to move to upside if it breaks the 200 EMA to upside and have some consolidaion with that.
Important levels: 23364, 23507
Support levels: Resistance chanel, 200 EMA
Plan of action:
wait for market to break the 200 EMA and retrace to the channel.
