NIFTY KEY LEVELS FOR 05.01.2026NIFTY KEY LEVELS FOR 05.01.2026
Timeframe: 3 Minutes
If the candle stays above the pivot point, it is considered a bullish bias; if it remains below, it indicates a bearish bias. Price may reverse near Resistance 1 or Support 1. If it moves further, the next potential reversal zone is near Resistance 2 or Support 2. If these levels are also broken, we can expect the trend.
When a support or resistance level is broken, it often reverses its role; a broken resistance becomes the new support, and a broken support becomes the new resistance.
If the range(R2-S2) is narrow, the market may become volatile or trend strongly. If the range is wide, the market is more likely to remain sideways
please like and share my idea if you find it helpful
📢 Disclaimer
I am not a SEBI-registered financial adviser.
The information, views, and ideas shared here are purely for educational and informational purposes only. They are not intended as investment advice or a recommendation to buy, sell, or hold any financial instruments.
Please consult with your SEBI-registered financial advisor before making any trading or investment decisions.
Trading and investing in the stock market involves risk, and you should do your own research and analysis. You are solely responsible for any decisions made based on this research
Niftylevels

NIFTY Intraday Trade Setup For 5 Jan 2026NIFTY Intraday Trade Setup For 5 Jan 2026
Bullish-Above 26350
Invalid-Below 26300
T- 26640
Bearish Below 26200
Invalid-Above 26250
T- 26040
NIFTY has closed on a bullish note with over 1% gain last week, closing at ATH. Its a engulfing candle and index is on verge of breakout of daily range (26350- 26700) which has been valid since last 1 month.
26350 and 26200 will be Monday's range to watch for breakout for a directional move any side. Plan on 15 Min candle close.
I am Not SEBI Registered
This is my personal analysis for my personal trading. Kindly consult your financial advisor before taking any actions based on this.

NIFTY : Trading levels and Plan for 05-Jan-2026📘 NIFTY Trading Plan for 5-Jan-2026
(Timeframe: 15-min | Gap consideration: 100+ points)
Key Levels to Track (from chart)
Upper Target / Extension: 26,658
Last Intraday Resistance / Profit Booking Zone: 26,467 – 26,483
Opening Resistance Zone: 26,335 – 26,296
Opening Support: 26,289
Last Intraday Support: 26,237
Lower Support (Extreme): 26,162
🧠 Context: NIFTY is in a strong bullish structure, trading above key supports. However, price is approaching profit-booking zones, so reactions at resistance will decide continuation vs pullback.
🟢 1. GAP-UP OPENING (100+ Points)
If NIFTY opens above 26,335, it signals continuation strength.
🎓 Educational Explanation:
Gap-up openings after a rally often attract early profit booking. True strength is confirmed only if price accepts above resistance and holds.
Plan of Action:
Avoid trading the first 10–15 minutes; let volatility settle.
Holding above 26,335–26,296 keeps bullish momentum intact.
Sustained move above 26,483 opens path toward 26,658.
Sharp rejection from 26,467–26,483 → expect intraday pullback.
Options traders: Prefer ATM / ITM Call buying on retest-and-hold or use Bull Call Spread near resistance.
🟡 2. FLAT OPENING
If NIFTY opens around 26,289–26,335, market enters a decision zone.
🎓 Educational Explanation:
Flat opens indicate temporary balance. Direction emerges only after a range break, otherwise price may chop and decay option premiums.
Plan of Action:
Above 26,335 → bullish bias toward 26,467–26,483.
Failure near 26,335 may lead to sideways movement.
Break below 26,289 increases probability of test toward 26,237.
Trade only on clear breakout or rejection with volume confirmation.
Options traders: Consider non-directional strategies (Iron Fly / Short Strangle) if range persists.
🔴 3. GAP-DOWN OPENING (100+ Points)
If NIFTY opens below 26,289, expect cautious sentiment initially.
🎓 Educational Explanation:
Gap-downs into strong supports often trigger short covering or dip buying. Aggressive shorts near support are risky without confirmation.
Plan of Action:
First support to watch: 26,289.
Acceptance below 26,237 → downside toward 26,162.
Strong bullish candles near 26,237–26,162 may give bounce trades.
Only short if price fails to reclaim supports with weak structure.
Options traders: Prefer Put spreads instead of naked puts to manage risk.
⚙️ Risk Management Tips for Options Trading 🛡️
Risk only 1–2% of total capital per trade.
Avoid chasing breakouts near profit-booking zones.
Use time-based exits if premium stalls for 15–20 minutes.
Book partial profits early; trail the rest.
Avoid over-trading during sideways phases.
Prefer ATM options or spreads over far OTM buying.
🧾 Summary & Conclusion
Above 26,335: Bulls remain in control toward 26,483 → 26,658
Between 26,289–26,335: Market in balance → wait for clarity
Below 26,289: Pullback possible toward 26,237 → 26,162
Focus on price behavior at levels, not excitement 🚦
Discipline and patience will protect profits in a trending market.
⚠️ Disclaimer
I am not a SEBI-registered analyst. This analysis is for educational purposes only. Markets involve risk; please consult your financial advisor before taking any trade.

Nifty Hits a New Peak: Is the Next Leg Up Around the Corner?Indian equities kicked off the New Year with confidence, gaining nearly 1% and finally breaking out of a five-week consolidation phase. After a slow and mixed start, a strong rebound in the latter half of the week pushed the Nifty to a fresh all-time high of 26,329.
Volatility ticked up slightly, with India VIX rising 3.28% to 9.45, but it continues to remain at comfortable, historically low levels.
◉ Technical Outlook
As highlighted earlier, the Cup & Handle pattern has now taken a clearer shape. A decisive breakout and sustained move above the neckline could trigger the next leg of the rally.
◉ Key Levels to Watch
● Resistance: 26,500 – 26,600 (heavy call writing zone)
● Immediate Support: 26,100 – 26,200
● Strong Support: 25,900 – 26,000 (heavy put writing zone)
◉ Near-Term View
Nifty is likely to consolidate within a 300-point range, broadly between 26,200 and 26,500, as the market digests recent gains.
◉ Key Trigger to Watch
Global cues remain important. Markets will closely monitor developments after reports of US military strikes on Venezuela, which could influence sentiment in the coming sessions.
◉ Trading Strategy
Expect mild profit-taking at higher levels. Avoid aggressive fresh buying, protect existing gains, and stay selective by focusing on stocks showing relative strength.

Market View: Strong Uptrend Confirmation for Indian MarketMarket View: Strong Uptrend Confirmation for Indian Market
Key Condition for a Sustainable Rally
For a high-confidence and low-failure bullish phase in the Indian stock market, both of the following must hold:
NIFTY 50 sustains above its All-Time High
RELIANCE sustains above its All-Time High
> These two act as the backbone of the Indian indices. When they move together, the probability of a broad-based rally increases significantly.
Why NIFTY + RELIANCE Together Matter
NIFTY represents overall market sentiment and institutional positioning
RELIANCE carries heavy index weight and reflects FII + DII conviction
When both are above ATH:
Distribution risk reduces
Pullbacks turn into buying opportunities
Trend failures become rare
Impact on Small-Cap & Mid-Cap Stocks
Once NIFTY and RELIANCE confirm strength:
Liquidity flows down the market cap ladder
Small-caps and mid-caps outperform
Sector rotation accelerates
Stocks start moving toward their own All-Time Highs
Breakout + momentum strategies work exceptionally well
> Historically, real wealth-creating phases begin only after large-cap leadership confirms.
Trading Strategy (Action Plan)
Prefer buy on dips, not shorting
Focus on:
Stocks near 52-week high / ATH
Strong relative strength vs NIFTY
Volume expansion on breakouts
Avoid counter-trend shorts in mid & small caps
Risk Note
If either NIFTY or RELIANCE fails to sustain above ATH, market may:
Turn sideways
Enter selective stock-specific moves
See false breakouts in small caps
> NIFTY + RELIANCE above All-Time High = Green signal for Indian Market.
This combination unlocks powerful momentum in small-cap and mid-cap stocks, pushing the broader market toward new highs.

Nifty50 and Overall Market analysisIn this video, we discuss Nifty50 and Overall Market analysis
Current market scenario
Long term vs Short term chart analysis
Major sector index analysis and my views on them
Long term vs Short term Investment approach

NIFTY KEY LEVELS FOR 02.01.2026NIFTY KEY LEVELS FOR 02.01.2026
Timeframe: 3 Minutes
If the candle stays above the pivot point, it is considered a bullish bias; if it remains below, it indicates a bearish bias. Price may reverse near Resistance 1 or Support 1. If it moves further, the next potential reversal zone is near Resistance 2 or Support 2. If these levels are also broken, we can expect the trend.
When a support or resistance level is broken, it often reverses its role; a broken resistance becomes the new support, and a broken support becomes the new resistance.
If the range(R2-S2) is narrow, the market may become volatile or trend strongly. If the range is wide, the market is more likely to remain sideways
please like and share my idea if you find it helpful
📢 Disclaimer
I am not a SEBI-registered financial adviser.
The information, views, and ideas shared here are purely for educational and informational purposes only. They are not intended as investment advice or a recommendation to buy, sell, or hold any financial instruments.
Please consult with your SEBI-registered financial advisor before making any trading or investment decisions.
Trading and investing in the stock market involves risk, and you should do your own research and analysis. You are solely responsible for any decisions made based on this research

NIFTY : Trading levels and Plan for 02-Jan-2026(Timeframe: 15-min | Gap consideration: 100+ points)
Key Levels to Track (from chart)
Major Resistance Zone (Daily / ATH area): 26,336 – 26,386
Last Intraday Resistance: 26,288
Opening Resistance Zone: 26,160 – 26,182
Opening Support Zone: 26,089 – 26,098
Last Intraday Support: 26,023
Lower Support (Extreme): 25,945
🧠 Context: NIFTY is trading near an important daily resistance for potential new lifetime highs, hence reactions around resistance zones will be crucial. Expect volatility + traps.
🟢 1. GAP-UP OPENING (100+ Points)
If NIFTY opens above 26,182, it indicates bullish continuation attempt.
🎓 Educational Explanation:
Gap-up opens near higher-timeframe resistance often test buyer strength vs profit booking. Only sustained acceptance above resistance confirms continuation.
Plan of Action:
Avoid trading in first 10–15 minutes to let volatility settle.
Sustaining above 26,160–26,182 → bullish bias remains intact.
Fresh buying confirmation above 26,288 can push price toward 26,336–26,386.
Sharp rejection from 26,336+ zone may trigger intraday pullback.
Options traders: Prefer ATM / ITM Call buying or Bull Call Spread after retest & hold.
🟡 2. FLAT OPENING
If NIFTY opens between 26,100 – 26,160, market enters a balance / decision zone.
🎓 Educational Explanation:
Flat opens usually indicate indecision. Direction is confirmed only after range expansion. Patience is key to avoid whipsaws.
Plan of Action:
Holding above 26,160 keeps upside open toward 26,288.
Failure to cross 26,160–26,182 may result in sideways or pullback.
Breakdown below 26,089 increases probability of move toward 26,023.
Trade only after clear breakout / rejection with volume.
Options traders: Prefer non-directional strategies (Iron Fly / Short Strangle) if range persists.
🔴 3. GAP-DOWN OPENING (100+ Points)
If NIFTY opens below 26,089, early sentiment turns cautious.
🎓 Educational Explanation:
Gap-downs into support zones often see short covering or dip buying. Selling blindly near support increases reversal risk.
Plan of Action:
First support to watch: 26,089–26,098.
Break & acceptance below 26,089 → downside toward 26,023.
Failure to hold 26,023 may drag index to 25,945.
Strong bullish candles near supports may offer bounce trades.
Options traders: Prefer Put spreads instead of naked puts to control risk.
⚙️ Risk Management Tips for Options Trading 🛡️
Risk only 1–2% of capital per trade.
Avoid over-leveraging near all-time-high resistance zones.
Use time-based exits if premium stops moving for 15–20 minutes.
Book partial profits at resistance; don’t aim for extremes.
Avoid revenge trading on false breakouts.
Prefer ATM options or spreads over far OTM buying.
🧾 Summary & Conclusion
Above 26,182: Bulls stay active toward 26,288 → 26,336–26,386
Between 26,089–26,160: Market in balance → wait for confirmation
Below 26,089: Sellers gain control toward 26,023 → 25,945
Trade price reaction at levels, not emotions or headlines 🎯
Patience + discipline will matter more than aggression on such levels.
⚠️ Disclaimer
I am not a SEBI-registered analyst. This analysis is strictly for educational purposes only. Trading in markets involves risk. Please consult your financial advisor before taking any trade.

NIFTY-50 ADVANCE ANALISYS FOR 1 JANUARY 2026green support, red resistance, watch blue line for clearification, follow only bolinger band

NIFTY : Trading levels and Plan for 01-Jan-2026📘 NIFTY Trading Plan for 1-Jan-2026
(Timeframe: 15-min | Gap consideration: 100+ points)
Key Levels from Chart
Last Intraday Resistance Zone: 26,336 – 26,386
Opening Resistance Zone: 26,160 – 26,182
Opening Support Zone: 26,057 – 26,083
Last Intraday Support: 26,019
Lower Support (Extreme): 25,944
🔍 Note: Price is approaching an important daily resistance area, so reactions near upper zones are critical for trend continuation.
🟢 1. GAP-UP OPENING (100+ Points)
If NIFTY opens above 26,160, it signals strength carrying forward from the previous session.
🎓 Educational Explanation:
Gap-up openings near higher-timeframe resistance often test buyer conviction. Acceptance above resistance confirms continuation, while rejection usually leads to healthy pullbacks.
Plan of Action:
Avoid trading in the first 10–15 minutes; let volatility settle.
Sustaining above 26,160–26,182 → bullish continuation likely.
Fresh buying confirmation above 26,182 can push price toward 26,336–26,386.
Rejection from 26,336+ may trigger intraday profit booking.
Options traders: Prefer ATM / ITM Calls after retest & hold; avoid chasing far OTM calls.
🟡 2. FLAT OPENING
A flat open around 26,100–26,150 places price inside a decision zone.
🎓 Educational Explanation:
Flat opens reflect temporary balance. The market usually gives one clean directional move after breaking either side of the opening range. Patience avoids whipsaws.
Plan of Action:
Holding above 26,160 keeps bullish bias active.
Failure near 26,160–26,182 may lead to consolidation or pullback.
Breakdown below 26,083 increases downside probability toward 26,019.
Only trade after a clear breakout or rejection with volume support.
🔴 3. GAP-DOWN OPENING (100+ Points)
If NIFTY opens below 26,083, early sentiment turns cautious.
🎓 Educational Explanation:
Gap-downs into support zones often attract short covering or value buying. Selling without confirmation near support increases reversal risk.
Plan of Action:
First support to watch: 26,057–26,083.
Breakdown and acceptance below 26,057 opens downside toward 26,019.
If 26,019 fails, next support lies near 25,944.
Strong bullish candles near supports can give intraday bounce trades.
⚙️ Risk Management Tips for Options Trading 🛡️
Avoid overtrading on the first trading day of the year.
Risk only 1–2% capital per trade.
Use time-based SL (15–20 mins) if premium stops moving.
Prefer ATM options or spreads near resistance zones.
Book partial profits at predefined levels; don’t wait for extremes.
Avoid emotional trades near all-time-high resistance areas.
🧾 Summary & Conclusion
Above 26,182: Bulls stay in control toward 26,336–26,386.
Between 26,083–26,160: Market in balance; wait for confirmation.
Below 26,083: Sellers gain control unless buyers defend 26,019.
Trade reaction at levels, not excitement around new-year moves 🎯.
Discipline + patience = consistency.
⚠️ Disclaimer
I am not a SEBI-registered analyst. This analysis is for educational purposes only. Markets involve risk; please consult your financial advisor before trading.

NIFTY KEY LEVELS FOR 31.12.2025NIFTY KEY LEVELS FOR 31.12.2025
Timeframe: 3 Minutes
If the candle stays above the pivot point, it is considered a bullish bias; if it remains below, it indicates a bearish bias. Price may reverse near Resistance 1 or Support 1. If it moves further, the next potential reversal zone is near Resistance 2 or Support 2. If these levels are also broken, we can expect the trend.
When a support or resistance level is broken, it often reverses its role; a broken resistance becomes the new support, and a broken support becomes the new resistance.
If the range(R2-S2) is narrow, the market may become volatile or trend strongly. If the range is wide, the market is more likely to remain sideways
please like and share my idea if you find it helpful
📢 Disclaimer
I am not a SEBI-registered financial adviser.
The information, views, and ideas shared here are purely for educational and informational purposes only. They are not intended as investment advice or a recommendation to buy, sell, or hold any financial instruments.
Please consult with your SEBI-registered financial advisor before making any trading or investment decisions.
Trading and investing in the stock market involves risk, and you should do your own research and analysis. You are solely responsible for any decisions made based on this research

NIFTY : Trading levels and Plan for 31-Dec-2025NIFTY Trading Plan for 31-Dec-2025
(Timeframe: 15-min | Gap criteria considered: 100+ points)
Key Levels to Track (from chart)
Last Intraday Resistance: 26,159
Opening Resistance: 26,056
Opening Resistance / Support (Pivot Zone): 25,970 – 25,933
Opening Support (Gap-down case): 25,835
Lower Support (Extreme): 25,661
🟢 1. GAP-UP OPENING (100+ Points)
If NIFTY opens above 25,970, price starts above the pivot zone with scope for continuation.
🎓 Educational Explanation:
Gap-up opens show overnight strength, but continuation only comes with acceptance above key resistance. Many gap-ups initially retrace before choosing direction. Patience in the first few minutes improves risk-reward.
Plan of Action:
Avoid the first 10–15 minutes; observe price behaviour above 25,970.
Sustaining above 25,970–26,056 → bullish bias remains intact.
Break and acceptance above 26,056 opens upside toward 26,159.
Rejection near 26,056–26,159 may cause a pullback toward 25,970.
Options traders: Prefer ATM / ITM Calls only after confirmation; avoid chasing spikes.
🟡 2. FLAT OPENING
A flat open around 25,930–25,980 places NIFTY inside the pivot / balance zone.
🎓 Educational Explanation:
Flat openings indicate temporary balance between buyers and sellers. Direction usually emerges after a clear breakout or breakdown of the opening range. Trading inside the zone often leads to whipsaws and premium decay.
Plan of Action:
Sustaining above 25,970 keeps bullish bias toward 26,056 → 26,159.
Failure to cross 25,970 keeps price range-bound.
Breakdown below 25,933 signals weakness toward 25,835.
Look for bullish rejection candles near 25,933–25,970 for bounce trades.
🔴 3. GAP-DOWN OPENING (100+ Points)
If NIFTY opens below 25,933, early sentiment turns cautious to bearish.
🎓 Educational Explanation:
Gap-downs are often emotion-driven. Strong support zones can attract short-covering and value buying, so selling blindly into support increases reversal risk.
Plan of Action:
First support to watch is 25,835 — observe volume and candle structure.
Breakdown and acceptance below 25,835 opens downside toward 25,661.
Strong bullish reversal near 25,661 can lead to a sharp intraday bounce.
Any pullback toward 25,933 after breakdown can be used as sell-on-rise.
⚙️ Risk Management Tips for Options Trading 🛡️
Avoid trading the first 5–10 minutes on gap days.
Don’t buy options at resistance or sell at support without confirmation.
Use a time-based stop-loss (15–20 minutes) if premium stalls.
Risk only 1–2% of total capital per trade.
Prefer ATM options or defined-risk spreads to control theta decay.
Book partial profits near marked resistance/support levels.
🧾 Summary & Conclusion
Above 25,970: Bulls remain active; targets 26,056 → 26,159.
Between 25,933–25,970: Market stays balanced; patience is key.
Below 25,933: Sellers gain control unless buyers defend 25,835 / 25,661.
Trade price behaviour at levels, not predictions or emotions.
Consistency comes from discipline, confirmation, and risk control.
⚠️ Disclaimer
I am not a SEBI-registered analyst. This trading plan is for educational purposes only and should not be considered financial or investment advice. Please consult your financial advisor before taking any trades.

NIFTY KEY LEVELS FOR 30.12.2025NIFTY KEY LEVELS FOR 30.12.2025
Timeframe: 3 Minutes
If the candle stays above the pivot point, it is considered a bullish bias; if it remains below, it indicates a bearish bias. Price may reverse near Resistance 1 or Support 1. If it moves further, the next potential reversal zone is near Resistance 2 or Support 2. If these levels are also broken, we can expect the trend.
When a support or resistance level is broken, it often reverses its role; a broken resistance becomes the new support, and a broken support becomes the new resistance.
If the range(R2-S2) is narrow, the market may become volatile or trend strongly. If the range is wide, the market is more likely to remain sideways
please like and share my idea if you find it helpful
📢 Disclaimer
I am not a SEBI-registered financial adviser.
The information, views, and ideas shared here are purely for educational and informational purposes only. They are not intended as investment advice or a recommendation to buy, sell, or hold any financial instruments.
Please consult with your SEBI-registered financial advisor before making any trading or investment decisions.
Trading and investing in the stock market involves risk, and you should do your own research and analysis. You are solely responsible for any decisions made based on this research

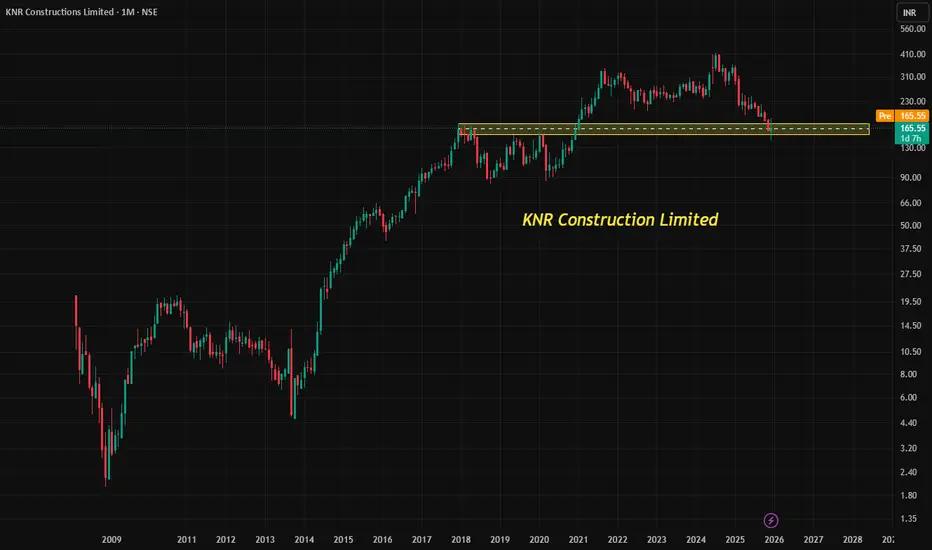
Understanding Resistance Turned Support & Doji Candle Patterns📈 Understanding Resistance Turned Support & Doji Candle Patterns: A Case Study on KNR Construction Limited
🔹 1. Resistance Turned Support Levels/Zone
Resistance is a price level where selling pressure historically outweighs buying, causing the stock to struggle moving higher.
When price breaks above resistance, that level often becomes a support zone. This is because traders who missed buying earlier now see it as a favorable entry point, while previous sellers may re-enter as buyers.
This phenomenon is called “role reversal” in technical analysis: resistance becomes support, and vice versa.
👉 In KNR Construction Limited, the price has approached such a resistance-turned-support zone around ₹167, making it a critical level to watch.
🔹 2. Doji Candle Pattern at Support Levels
A Doji candle forms when the opening and closing prices are nearly equal, reflecting indecision between buyers and sellers.
At support levels, a Doji can signal:
Sellers are losing strength.
Buyers may step in to defend the level.
A potential trend reversal or consolidation.
The reliability of a Doji increases when it appears at key support zones, especially after a downtrend or correction.
👉 KNR Construction’s monthly chart shows a Doji at support, hinting at possible stabilization and a chance for buyers to regain control.
🔹 3. Current Opportunity in KNR Construction Limited
With price at ₹167 near its support zone, the stock presents a potential buying opportunity for swing or positional traders.
The Doji pattern adds weight to the idea that the level could hold, offering a low-risk entry point.
🔹 4. Risk Management: Stop Loss Strategy
No trade is complete without risk management. Here’s how traders can approach it:
Entry Zone: Around ₹167 (current support).
Stop Loss: Place below the support zone, to protect against breakdowns.
Target Levels: If support holds, price could retest higher resistance zones
Risk-Reward Ratio: Aim for at least 1:2, meaning potential reward should be atleast twice the risk.
📊 Key Takeaways
Resistance turned support is a powerful concept in technical analysis, often marking strong zones for entry.
A Doji candle at support signals indecision but can precede reversals when combined with strong levels.
KNR Construction Limited’s chart setup offers a textbook example of these principles, but disciplined stop loss placement is essential to manage risk.
NIFTY : Trading levels and Plan for 30-Dec-2025NIFTY Trading Plan for 30-Dec-2025
(Timeframe: 15-min | Gap criteria considered: 100+ points)
Key Levels to Track (from chart)
Last Intraday Resistance: 26,168.00
Opening Support / Resistance (Pivot): 25,950.00
Opening Support Zone: 25,852 – 25,974
Last Intraday Support: 25,805.00
Lower Support (Extreme): 25,662.45
🟢 1. GAP-UP OPENING (100+ Points)
If NIFTY opens above 25,950, price starts the session near the pivot with scope for a relief bounce.
🎓 Educational Explanation:
Gap-up openings after a decline often invite short-covering first, followed by a test of overhead resistance. Sustainable upside needs acceptance above the pivot; chasing the opening spike usually gives poor R:R.
Plan of Action:
Wait 10–15 minutes to see acceptance above 25,950.
If price holds above 25,950, look for pullback-based long entries.
Upside targets: 26,050 → 26,168 (watch price behaviour near resistance).
Rejection near 26,168 may lead to a pullback toward 25,950.
Options: Prefer ATM / ITM Calls after confirmation; avoid far OTM CE at the open.
🟡 2. FLAT OPENING
A flat open near 25,900–25,980 keeps NIFTY inside the Opening Support / Pivot zone.
🎓 Educational Explanation:
Flat opens indicate balance. Direction generally emerges after a clear break of the opening range. Trading inside the zone without confirmation often results in whipsaws and theta decay.
Plan of Action:
Sustaining above 25,950 keeps bullish bias alive toward 26,050 → 26,168.
Failure to cross 25,950 keeps price range-bound.
Breakdown below 25,852 increases downside risk toward 25,805.
Watch for bullish rejection within 25,852–25,974 for bounce trades.
🔴 3. GAP-DOWN OPENING (100+ Points)
If NIFTY opens below 25,852, early sentiment turns weak.
🎓 Educational Explanation:
Gap-downs are often emotional. Strong demand zones attract short-covering and value buying, so selling blindly into support increases reversal risk.
Plan of Action:
First support to watch is 25,805 — observe candle structure and volume.
Breakdown and acceptance below 25,805 opens downside toward 25,662.45.
Strong bullish reversal signals near 25,662.45 can trigger a sharp intraday bounce.
Any pullback toward 25,852 after breakdown can be used as a selling-on-rise opportunity.
⚙️ Risk Management Tips for Options Trading 🛡️
Avoid trading the first 5–10 minutes on gap days.
Don’t buy options at resistance or sell at support without confirmation.
Use a time-based stop-loss (15–20 minutes) if premium doesn’t move.
Risk only 1–2% of total capital per trade.
Prefer ATM options or defined-risk spreads to manage theta decay.
Book partial profits near marked resistance/support levels.
🧾 Summary & Conclusion
Above 25,950: Bulls attempt recovery; targets 26,050 → 26,168.
Between 25,852–25,950: Market remains balanced; patience required.
Below 25,852: Sellers gain control unless buyers defend 25,805 / 25,662.
Trade price behaviour at levels, not predictions or emotions.
Consistency comes from discipline, confirmation, and risk control.
⚠️ Disclaimer
I am not a SEBI-registered analyst. This trading plan is for educational purposes only and should not be considered financial or investment advice. Please consult your financial advisor before taking any trades.

NIFTY Intraday Trade Setup For 30 Dec 2025NIFTY Intraday Trade Setup For 30 Dec 2025
Bullish-Above 26050
Invalid-Below 26000
T- 26260
Bearish-Below 25900
Invalid-Above 25950
T- 25650
We discussed that index may test 25900 below 26110, triggered and reached. Last week a shooting star candle has been formed in weekly TF. Now below 25900 index may extend the move till 25650. Bullish move can be seen if index sustains above 26050. 50 EMA in daily TF can be a confluence zone, break of which will trigger a short term bearishness in overall market. Plan the view on 15 Min candle close.
I am Not SEBI Registered
This is my personal analysis for my personal trading. Kindly consult your financial advisor before taking any actions based on this.

NIFTY KEY LEVELS FOR 29.12.2025NIFTY KEY LEVELS FOR 29.12.2025
Timeframe: 3 Minutes
If the candle stays above the pivot point, it is considered a bullish bias; if it remains below, it indicates a bearish bias. Price may reverse near Resistance 1 or Support 1. If it moves further, the next potential reversal zone is near Resistance 2 or Support 2. If these levels are also broken, we can expect the trend.
When a support or resistance level is broken, it often reverses its role; a broken resistance becomes the new support, and a broken support becomes the new resistance.
If the range(R2-S2) is narrow, the market may become volatile or trend strongly. If the range is wide, the market is more likely to remain sideways
please like and share my idea if you find it helpful
📢 Disclaimer
I am not a SEBI-registered financial adviser.
The information, views, and ideas shared here are purely for educational and informational purposes only. They are not intended as investment advice or a recommendation to buy, sell, or hold any financial instruments.
Please consult with your SEBI-registered financial advisor before making any trading or investment decisions.
Trading and investing in the stock market involves risk, and you should do your own research and analysis. You are solely responsible for any decisions made based on this research

NIFTY : Trading levels and Plan for 29-Dec-2025📘 NIFTY Trading Plan for 29-Dec-2025
(Chart reference: 15-min | Gap criteria considered: 100+ points)
Key Levels to Track (from chart)
Major Upside Resistance: 26,265.35
Last Intraday Resistance: 26,186.00
Opening Resistance: 26,099.00
Opening Support Zone: 25,979 – 26,040
Last Intraday Support: 25,920.00
Lower Support (Extreme): 25,834.00
🟢 1. GAP-UP OPENING (100+ Points)
If NIFTY opens above 26,099, price will start the session close to a short-term supply area.
🎓 Educational Explanation:
Gap-up openings reflect overnight bullish sentiment, but early profit booking near resistance is common. Strong continuation usually requires acceptance above resistance or a pullback-and-hold. Chasing the opening candle often results in poor risk-reward.
Plan of Action:
Wait for 10–15 minutes to check acceptance above 26,099.
If price sustains above 26,099, look for pullback-based long entries.
Upside targets remain 26,186, followed by 26,265.35 on strong acceptance.
Rejection near 26,186–26,265 may trigger a pullback toward 26,099.
Option buyers should prefer ATM / ITM Calls only after confirmation; avoid chasing far OTM CE.
🟡 2. FLAT OPENING
A flat open near 26,020–26,060 places NIFTY inside the Opening Support Zone (25,979–26,040).
🎓 Educational Explanation:
Flat openings indicate balance between buyers and sellers. Direction usually emerges only after a clear break of the opening range. Trading inside this zone without confirmation often leads to whipsaws and option premium decay.
Plan of Action:
Sustaining above 26,099 shifts bias bullish toward 26,186.
Failure to cross 26,099 keeps the market range-bound or weak.
Breakdown below 25,979 signals weakness toward 25,920.
Watch for bullish rejection candles near 25,979–26,040 for bounce trades.
🔴 3. GAP-DOWN OPENING (100+ Points)
If NIFTY opens below 25,979, early sentiment turns cautious to bearish.
🎓 Educational Explanation:
Gap-down openings are often emotion-driven. However, strong demand zones attract short-covering and value buying. Selling blindly into support increases the probability of getting trapped.
Plan of Action:
First support to watch is 25,920 — observe price behaviour and candle structure.
Breakdown and acceptance below 25,920 opens the downside toward 25,834.
Strong bullish reversal signals near 25,834 may lead to a sharp intraday bounce.
Any pullback toward 25,979 after breakdown can be used as a selling-on-rise opportunity.
⚙️ Risk Management Tips for Options Trading 🛡️
Avoid trading the first 5–10 minutes during gap openings.
Do not buy options at resistance or sell at support without confirmation.
Use a time-based stop-loss (15–20 minutes) if premium doesn’t move.
Risk only 1–2% of total capital per trade.
Prefer ATM options or defined-risk spreads to manage theta decay.
Book partial profits near marked resistance/support zones.
🧾 Summary & Conclusion
Above 26,099: Bulls stay active; targets 26,186 → 26,265.
Between 25,979–26,099: Market remains balanced; patience required.
Below 25,979: Sellers gain control unless buyers defend 25,920 / 25,834.
Focus on price behaviour at predefined levels, not predictions.
Consistency comes from discipline, confirmation, and risk control.
⚠️ Disclaimer
I am not a SEBI-registered analyst. This trading plan is for educational purposes only and should not be considered financial or investment advice. Please consult your financial advisor before taking any trades.

NIFTY Set to Sign Off 2025 Quietly—Could 2026 Bring a Rally?As we enter the last week of 2025 and approach the first week of 2026, Nifty is doing something familiar—consolidating in a tight range.
Everything looks calm at first glance: volatility is very low (India VIX at 9.15), trading volumes are light, and price changes are small. But history shows that such calm often comes before a big move.
◉ What it means actually?
● Nifty near lifetime highs, but breadth remains weak
● Low volatility → calm market, but risk of sudden moves
● Traders aren’t chasing the market, they’re waiting for a trigger rather than pushing prices higher.
◉ Technical View
● From a technical standpoint, Nifty continues to trade within a rising wedge pattern, which carries bearish implications in the short term.
● Looking at the broader structure, a cup-and-handle pattern is forming, typically pointing to a potential upside move once the neckline is decisively breached.
◉ Important Levels to Watch
● Immediate Resistance: 26,100 - 26,200
● Immediate Support: 25,900 - 26,000
Strong breakout or breakdown from here will decide the next big leg.
◉ Looking Ahead
As 2026 begins, markets will closely track:
● FOMC minutes, which could influence global rate expectations.
● Rupee movement and FII flows, key drivers of short-term sentiment.
◉ Strategy Insight
Until fresh catalysts emerge, markets may stay range-bound as they digest year-end positioning. With volatility compressed, stock-specific strategies and relative-strength setups may offer better opportunities than broad index trades.

NIFTY KEY LEVELS FOR 26.12.2025NIFTY KEY LEVELS FOR 26.12.2025
Timeframe: 3 Minutes
If the candle stays above the pivot point, it is considered a bullish bias; if it remains below, it indicates a bearish bias. Price may reverse near Resistance 1 or Support 1. If it moves further, the next potential reversal zone is near Resistance 2 or Support 2. If these levels are also broken, we can expect the trend.
When a support or resistance level is broken, it often reverses its role; a broken resistance becomes the new support, and a broken support becomes the new resistance.
If the range(R2-S2) is narrow, the market may become volatile or trend strongly. If the range is wide, the market is more likely to remain sideways
please like and share my idea if you find it helpful
📢 Disclaimer
I am not a SEBI-registered financial adviser.
The information, views, and ideas shared here are purely for educational and informational purposes only. They are not intended as investment advice or a recommendation to buy, sell, or hold any financial instruments.
Please consult with your SEBI-registered financial advisor before making any trading or investment decisions.
Trading and investing in the stock market involves risk, and you should do your own research and analysis. You are solely responsible for any decisions made based on this research

#NIFTY Intraday Support and Resistance Levels - 26/12/2025A flat opening is expected in Nifty 50, with the index trading around 26,140, indicating continuation of the ongoing range-bound structure. Price action suggests the market is currently oscillating between well-defined support and resistance levels, showing no immediate directional bias. This reflects a cautious tone, where buyers and sellers are evenly placed, and the index is waiting for a decisive breakout to establish momentum.
On the upside, a sustained move above 26,250 will be the key trigger for bullish continuation. If Nifty manages to hold above this level, long positions can be considered with upside targets at 26,350, 26,400, and 26,450+. A clean breakout above this resistance zone may attract fresh buying interest and strengthen bullish sentiment.
On the downside, the 26,200–26,180 zone is acting as a short-term rejection area. Failure to reclaim this zone could lead to reversal selling, with downside targets placed at 26,150, 26,100, and 26,050-. However, if the index finds support near 26,050–26,100 and shows strength, intraday long opportunities may emerge toward 26,150–26,250+. Until a clear breakout or breakdown occurs, traders should focus on level-based trades with strict risk management, avoiding aggressive directional bets in a consolidating market.

NIFTY : Trading levels and Plan for 26-Dec-2025📘 NIFTY Trading Plan for 26-Dec-2025
(Chart reference: 15-min | Gap criteria considered: 100+ points)
Key Levels to Track (from chart)
Major Upside Resistance: 26,341.10
Last Intraday Resistance: 26,265.00
Opening Resistance: 26,212.00
Opening Support / Resistance (Pivot Zone): 26,099 – 26,141
Last Intraday Support: 26,040.50
Lower Support: 25,920.85
🟢 1. GAP-UP OPENING (100+ Points)
If NIFTY opens above 26,212, price starts the session in a bullish zone but close to overhead supply.
🎓 Educational Explanation:
Gap-up opens indicate positive overnight sentiment. However, when price opens near resistance, early profit-booking is common. Strong trends usually continue only after acceptance above resistance or a clean retest, not on impulsive spikes.
Plan of Action:
If price sustains above 26,212 for 10–15 minutes, look for pullback-based long entries.
First upside hurdle is 26,265 (last intraday resistance).
Acceptance above 26,265 can extend the move toward 26,341.10.
Rejection or exhaustion near 26,265–26,341 may lead to a pullback toward 26,212.
Option buyers should avoid chasing CE at the open; confirmation improves R:R.
🟡 2. FLAT OPENING
A flat open around 26,120–26,160 keeps NIFTY inside the opening pivot zone (26,099–26,141).
🎓 Educational Explanation:
Flat opens reflect balance between buyers and sellers. Direction typically emerges after the opening range breaks. Trading inside this zone without confirmation often leads to whipsaws and theta decay.
Plan of Action:
Sustaining above 26,141 keeps bullish bias intact, targeting 26,212 → 26,265.
Failure to hold 26,099 increases downside risk toward 26,040.50.
Bullish rejection near 26,099–26,141 offers a low-risk bounce back to 26,212.
Breakdown and acceptance below 26,099 shifts momentum toward 26,040.50.
🔴 3. GAP-DOWN OPENING (100+ Points)
If NIFTY opens below 26,099, early sentiment turns cautious to bearish.
🎓 Educational Explanation:
Gap-downs are often emotion-driven. Strong demand zones can attract short-covering and value buying, leading to sharp reversals. Selling blindly into support increases risk.
Plan of Action:
First support to watch is 26,040.50 — observe candle structure and volume.
Breakdown below 26,040.50 opens the downside toward 25,920.85.
Strong bullish reversal signals near 25,920.85 may lead to a sharp intraday bounce.
Any pullback toward 26,099 after breakdown can be used as a selling-on-rise opportunity.
⚙️ Risk Management Tips for Options Traders 🛡️
Avoid trading the first 5–10 minutes during gap openings.
Don’t buy options at resistance or sell at support without confirmation.
Use a time-based stop-loss (15–20 minutes) if premium doesn’t move.
Risk only 1–2% of total capital per trade.
Prefer ATM options or defined-risk spreads to manage theta decay.
Book partial profits near marked resistance/support levels.
🧾 Summary & Conclusion
Above 26,212: Bulls remain active; targets 26,265 → 26,341.
Between 26,099–26,212: Market stays balanced; patience is key.
Below 26,099: Sellers gain control unless buyers defend 26,040.50 / 25,920.85.
Trade price behaviour at levels, not predictions.
Consistency comes from discipline, confirmation, and risk control.
⚠️ Disclaimer
I am not a SEBI-registered analyst. This trading plan is for educational purposes only and should not be considered financial or investment advice. Please consult your financial advisor before taking any trades.

NIFTY Intraday Trade Setup For 26 Dec 2025NIFTY Intraday Trade Setup For 26 Dec 2025
Bullish- Above 26250
Invalid-Below 26200
T- 26370-450
Bearish-Below 26110
Invalid-Above 26160
T- 25935
NIFTY has closed on a slight bearish note last day, ending near day low. Below 26110 there is a chance of gap filling towards 25930 zone, strong support placed at 25900. On flat opening short below 26110 on a 15 Min candle close. In case index surprises bears above 26350, then index will shot up towards 26450 zone. Buy above 26350 on a 15 Min candle close. Intraday support lies near 25930-25950 and resistance at 26450. Index is in bulls grip overall.
I am Not SEBI Registered
This is my personal analysis for my personal trading. Kindly consult your financial advisor before taking any actions based on this.
