NIFTY : Trading levels and Plan for 24-Dec-2025NIFTY Trading Plan for 24-Dec-2025
(Chart reference: 15-min | Gap criteria considered: 100+ points)
Key Levels to Track (from chart)
Opening Resistance: 26,266
Last Intraday Resistance: 26,341
Major Upside Resistance: 26,426
Opening Support / Resistance (Pivot): 26,165
Opening Support (Gap-down reference): 26,098
Last Intraday Support: 26,030
Lower Support: 25,919.85
🟢 1. GAP-UP OPENING (100+ Points)
If NIFTY opens above 26,266, price starts the session near a known supply zone.
🎓 Educational Explanation:
A gap-up above resistance shows bullish sentiment, but supply zones attract profit booking. Professional traders wait for acceptance above resistance or a retest before entering. Chasing price at the open often gives poor risk-reward.
Plan of Action:
If price sustains above 26,266 for 10–15 minutes, look for pullback-based long entries.
First upside target is 26,341 (last intraday resistance).
Acceptance above 26,341 can extend the move toward 26,426.
Rejection or exhaustion near 26,341–26,426 may lead to a pullback toward 26,266.
Option buyers should prefer ATM / ITM Calls only after confirmation, not on opening spikes.
🟡 2. FLAT OPENING
A flat open around 26,140–26,200 keeps NIFTY near the opening pivot (26,165).
🎓 Educational Explanation:
Flat opens indicate balance between buyers and sellers. Direction usually emerges only after the opening range is broken. Trading inside this zone without confirmation often results in whipsaws.
Plan of Action:
Sustaining above 26,165 keeps bullish bias intact, targeting 26,266 → 26,341.
Failure to hold 26,165 increases downside risk toward 26,098.
Bullish rejection near 26,098 offers a low-risk bounce trade back to 26,165.
Breakdown and acceptance below 26,098 shifts momentum toward 26,030.
🔴 3. GAP-DOWN OPENING (100+ Points)
If NIFTY opens below 26,098, early sentiment turns cautious to bearish.
🎓 Educational Explanation:
Gap-down openings are often driven by fear. However, strong demand zones attract short-covering and positional buying. Selling blindly into support increases the probability of getting trapped.
Plan of Action:
First support to watch is 26,030 — observe candle structure and volume.
Breakdown below 26,030 opens the downside toward 25,919.85.
Strong bullish reversal signals near 25,919.85 may lead to a sharp intraday bounce.
Any pullback toward 26,098 after a breakdown can be used as a selling-on-rise opportunity.
⚙️ Risk Management Tips for Options Traders 🛡️
Avoid trading in the first 5–10 minutes during gap openings.
Do not buy options at resistance or sell at support without confirmation.
Use time-based stop-loss (15–20 minutes) if premium doesn’t move.
Risk only 1–2% of capital per trade.
Prefer ATM options or defined-risk spreads to control theta decay.
Book partial profits near key resistance/support levels.
🧾 Summary & Conclusion
Above 26,266: Bulls remain active; targets 26,341 → 26,426.
Between 26,098–26,266: Market remains balanced; patience is essential.
Below 26,098: Sellers gain control unless buyers defend 26,030 / 25,919.85.
Focus on price behaviour at predefined levels, not prediction.
Consistency comes from discipline, confirmation, and risk control.
⚠️ Disclaimer
I am not a SEBI-registered analyst. This trading plan is for educational purposes only and should not be considered financial or investment advice. Please consult your financial advisor before taking any trades.
Niftylevels

NIFTY KEY LEVELS FOR 23.12.2025NIFTY KEY LEVELS FOR 23.12.2025
Timeframe: 3 Minutes
If the candle stays above the pivot point, it is considered a bullish bias; if it remains below, it indicates a bearish bias. Price may reverse near Resistance 1 or Support 1. If it moves further, the next potential reversal zone is near Resistance 2 or Support 2. If these levels are also broken, we can expect the trend.
When a support or resistance level is broken, it often reverses its role; a broken resistance becomes the new support, and a broken support becomes the new resistance.
If the range(R2-S2) is narrow, the market may become volatile or trend strongly. If the range is wide, the market is more likely to remain sideways
please like and share my idea if you find it helpful
📢 Disclaimer
I am not a SEBI-registered financial adviser.
The information, views, and ideas shared here are purely for educational and informational purposes only. They are not intended as investment advice or a recommendation to buy, sell, or hold any financial instruments.
Please consult with your SEBI-registered financial advisor before making any trading or investment decisions.
Trading and investing in the stock market involves risk, and you should do your own research and analysis. You are solely responsible for any decisions made based on this research

NIFTY : Trading level and Plan for 23-Dec-2025📘 NIFTY Trading Plan for 23-Dec-2025
(Chart reference: 15-min | Gap criteria considered: 100+ points)
Key Levels to Track (from chart)
Opening Resistance: 26,266
Last Intraday Resistance: 26,331
Opening Support Zone: 26,100 – 26,147
Last Intraday Support: 26,010
Lower Support: 25,900
🟢 1. GAP-UP OPENING (100+ Points)
If NIFTY opens above 26,266, price will directly face a strong overhead supply zone.
🎓 Educational Explanation:
Gap-up openings reflect bullish overnight sentiment, but when price opens near resistance, profit booking and supply absorption usually occur. Smart traders avoid chasing and wait for acceptance or retest confirmation before committing.
Plan of Action:
Sustaining above 26,266 for 10–15 minutes allows pullback-based long entries.
Upside potential remains toward 26,331, the last intraday resistance.
Acceptance above 26,331 may extend the rally further; trail stops tightly.
Rejection near 26,266–26,331 can trigger a pullback toward 26,147.
Option buyers should avoid aggressive CE buying at the open; confirmation is key.
🟡 2. FLAT OPENING
A flat open near 26,150–26,200 keeps NIFTY inside the Opening Support Zone.
🎓 Educational Explanation:
Flat opens represent balance between demand and supply. Direction emerges only after a clear breakout or breakdown. Trading inside the range without confirmation often leads to whipsaws.
Plan of Action:
Sustaining above 26,266 turns momentum bullish, targeting 26,331.
Failure to cross 26,266 keeps price vulnerable to consolidation or pullback.
Breakdown below 26,100 shifts control to sellers toward 26,010.
Bullish rejection patterns near 26,100–26,147 provide low-risk bounce trades.
🔴 3. GAP-DOWN OPENING (100+ Points)
If NIFTY opens below 26,100, early sentiment turns cautious.
🎓 Educational Explanation:
Gap-down openings are often driven by fear. However, strong demand zones usually attract short-covering and value buying, leading to intraday reversals. Selling blindly at support increases risk.
Plan of Action:
First support to watch is 26,010 — observe price behaviour carefully.
Breakdown below 26,010 opens the path toward 25,900.
Bullish reversal signals near 25,900 may trigger a sharp bounce.
Any pullback toward 26,100 after breakdown becomes a selling-on-rise opportunity.
⚙️ Risk Management Tips for Options Traders 🛡️
Avoid trading the first 5–10 minutes on gap days.
Never buy options at resistance or sell at support without confirmation.
Use time-based stop-loss (15–20 minutes) if premium stalls.
Risk only 1–2% of capital per trade.
Prefer ATM options or spreads to manage theta decay.
Book partial profits near key resistance/support levels.
🧾 Summary & Conclusion
Above 26,266: Bulls remain active, targeting 26,331.
Between 26,100–26,266: Market stays range-bound; patience required.
Below 26,100: Sellers gain control unless buyers defend 26,010 / 25,900.
Trade price behaviour at levels, not emotions or predictions.
Consistency comes from discipline and risk control.
⚠️ Disclaimer
I am not a SEBI-registered analyst. This trading plan is for educational purposes only and should not be considered financial or investment advice. Please consult your financial advisor before taking any trades.

NIFTY KEY LEVELS FOR 22.12.2025NIFTY KEY LEVELS FOR 22.12.2025
Timeframe: 3 Minutes
Sorry for the delayed post.
If the candle stays above the pivot point, it is considered a bullish bias; if it remains below, it indicates a bearish bias. Price may reverse near Resistance 1 or Support 1. If it moves further, the next potential reversal zone is near Resistance 2 or Support 2. If these levels are also broken, we can expect the trend.
When a support or resistance level is broken, it often reverses its role; a broken resistance becomes the new support, and a broken support becomes the new resistance.
If the range(R2-S2) is narrow, the market may become volatile or trend strongly. If the range is wide, the market is more likely to remain sideways
please like and share my idea if you find it helpful
📢 Disclaimer
I am not a SEBI-registered financial adviser.
The information, views, and ideas shared here are purely for educational and informational purposes only. They are not intended as investment advice or a recommendation to buy, sell, or hold any financial instruments.
Please consult with your SEBI-registered financial advisor before making any trading or investment decisions.
Trading and investing in the stock market involves risk, and you should do your own research and analysis. You are solely responsible for any decisions made based on this research

NIFTY : Trading levels and Plan for 22-Dec-2025NIFTY Trading Plan for 22-Dec-2025
(Chart reference: 15-min | Gap criteria considered: 100+ points)
Key Levels from Chart
Opening Pivot (Support / Resistance): 25,985
Opening Support Zone: 25,858 – 25,891
Last Intraday Support: 25,808
Buyer’s Support Zone: 25,640 – 25,672
Last Intraday Resistance: 26,100 – 26,137
🟢 1. GAP-UP OPENING (100+ Points)
If NIFTY opens above 25,985, price enters a positive momentum structure but near overhead supply.
🎓 Educational Explanation:
A gap-up above a key pivot reflects bullish overnight sentiment. However, markets often pause near prior resistance zones as early longs book profits. A sustained move above resistance is healthier than a straight vertical rally.
Plan of Action:
If price sustains above 25,985 for 10–15 minutes, look for pullback-based long entries.
Upside momentum can extend toward 26,100 – 26,137, a strong supply zone.
Acceptance above 26,137 may trigger trend continuation; manage trades with trailing SL.
Rejection from 26,100 – 26,137 can lead to a pullback toward 25,985.
Option buyers should avoid chasing CE at the open; enter only after retest confirmation.
🟡 2. FLAT OPENING
A flat open near 25,940 – 25,980 keeps NIFTY inside the balance zone.
🎓 Educational Explanation:
Flat opens indicate equilibrium between buyers and sellers. Direction emerges only after a breakout or breakdown of the opening range. Trading without confirmation in such conditions often leads to whipsaws.
Plan of Action:
Sustaining above 25,985 turns sentiment bullish, targeting 26,100 – 26,137.
Failure to hold 25,985 keeps price vulnerable to a decline toward 25,891 – 25,858.
Strong bullish rejection near 25,858 – 25,891 offers low-risk bounce trades.
Breakdown below 25,858 shifts control to sellers for a move toward 25,808.
🔴 3. GAP-DOWN OPENING (100+ Points)
If NIFTY opens below 25,858, early sentiment turns weak.
🎓 Educational Explanation:
Gap-down openings often trigger emotional selling. However, strong demand zones frequently attract buyers and short-covering. Selling blindly into support increases risk.
Plan of Action:
First support to watch is 25,808 — observe price behaviour closely.
A breakdown below 25,808 exposes the Buyer’s Support Zone: 25,640 – 25,672.
Bullish reversal patterns in 25,640 – 25,672 can lead to a recovery toward 25,858.
Any pullback toward 25,858 after breakdown becomes a selling-on-rise opportunity.
⚙️ Risk Management Tips for Options Traders 🛡️
Avoid trading the first 5–10 minutes during gap days.
Do not buy options near resistance or sell near support without confirmation.
Use time-based stop loss (15–20 minutes) if the premium doesn’t move.
Risk only 1–2% of capital per trade.
Prefer ATM options or spreads to reduce theta decay.
Book partial profits near marked resistance/support zones.
🧾 Summary & Conclusion
Above 25,985: Bulls stay active; targets 26,100 – 26,137.
Between 25,858 – 25,985: Market remains range-bound; patience is key.
Below 25,858: Sellers gain control unless buyers defend 25,808 / 25,640–25,672.
Focus on price behaviour at levels, not prediction.
Consistency comes from discipline, not over-trading.
⚠️ Disclaimer
I am not a SEBI-registered analyst. This trading plan is for educational purposes only and should not be considered financial or investment advice. Please consult your financial advisor before taking any trades.

NIFTY: Calm Before the Next Big Move?After a choppy end to last week, Nifty closed marginally lower, firmly stuck in a tight range of 25,700 – 26,100. Volatility has dipped sharply (India VIX near multi-year lows), which usually means calm before the next directional move.
◉ Technical Snapshot
Nifty continues to trade within a rising wedge pattern and has bounced back from its trendline support, suggesting buyers are still active at lower levels — but conviction is missing.
◉ Key Levels
● Immediate Support: 25,700 – 25,800
Strong put writing in this zone indicates solid downside support.
● Immediate Resistance: 26,000 – 26,100
Heavy call writing here signals supply and hesitation near the top.
◉ Short-Term outlook
● Bullish bias above 26,100: Could fast-track rally to new short-term highs.
● Stuck inside range: Expect sideways, choppy action with stock-specific moves.
● Break below 25,700: Risk of sharper correction increases.
◉ Trader’s Edge
This week is all about range resolution. Until Nifty delivers a clean breakout or breakdown, the smartest approach is to trade the range, keep tight stop-losses, and book profits without getting greedy.

NIFTY Intraday Trade Setup For 22 Dec 2025NIFTY Intraday Trade Setup For 22 Dec 2025
NIFTY has closed on a positive note last day. Consecutive 4 pinbars have formed in weekly TF. A good consolidation near ATH. Now we have zones marked for the next leg of move. 26400 and 25700 are key levels for any directional move either side. It is simply sideways inside this range.
Above 25060 index will be bullish in intraday and 25890 is the downside gateway. Plan trades on 15 Min candle close on intraday levels.
26250 and 25800 zone will be intraday resistance and support respectively.
I am Not SEBI Registered
This is my personal analysis for my personal trading. Kindly consult your financial advisor before taking any actions based on this.

NIFTY 50 Weekly — A Repeating ATH Expansion CycleAfter studying the NIFTY 50 weekly chart, I’ve identified a clearly repeating structural pattern around All-Time Highs (ATH).
This is not random price action — it’s a market expansion–consolidation–expansion cycle that has already played out multiple times.
Let’s break it down step by step so it’s easy to understand.
🔁 The Repeating ATH Pattern (Market Behavior)
Step 1: ATH – A (First All-Time High)
NIFTY makes a fresh All-Time High (ATH-A).
This marks the start of a new bullish expansion phase.
Step 2: Breakout of ATH – A → New ATH – B
Price breaks above ATH-A.
Momentum continues and NIFTY forms a New ATH (ATH-B).
This phase is usually strong and fast.
Step 3: Retest of ATH – A (Very Important)
After making ATH-B, NIFTY pulls back.
Price retests the previous ATH-A (old resistance becomes support).
This confirms structural strength, not weakness.
Step 4: Failed Attempt to Break ATH – B
After the retest, NIFTY tries to break ATH-B again.
The first attempt fails.
This is where many traders get confused, but structurally this is healthy.
Step 5: Consolidation Zone
Price moves sideways between:
Support = ATH-A
Resistance = ATH-B
This is accumulation, not distribution.
Time correction > price correction.
Step 6: Final Breakout of ATH – B
After consolidation, NIFTY successfully breaks ATH-B.
This breakout is clean and sustained.
The result: New ATH – A (Next Cycle Begins)
🧠 Pattern History on the Chart
Pattern – I (Previous Cycle)
ATH-A → Breakout → ATH-B
Retest ATH-A
Failed breakout at ATH-B
Consolidation
Strong breakout → New ATH
Same Pattern Repeating (Current Cycle)
Jan 2024: New ATH – A
Jun 2024: Breakout of ATH-A
Sep 2024: New ATH – B
Feb 2025: Retest of ATH-A
Dec 2025: Failed breakout at ATH-B
Now: Ongoing consolidation zone
➡️ Structurally, this is exactly the same pattern as before.
🔮 What This Suggests (If Pattern Holds)
NIFTY is not bearish.
It is in a time-based consolidation.
If history repeats:
Consolidation continues
ATH-B breaks decisively
New ATH-A is likely in 2026
📌 Key Takeaway
Markets don’t move randomly at higher timeframes.
They expand, pause, absorb liquidity, and expand again.
This weekly ATH structure has already repeated multiple times, and the current price action fits perfectly into the same framework.
⚠️ This is a structural market study, not a prediction or financial advice.
📈 Weekly timeframe focus — patience is key.

NIFTY KEY LEVELS FOR 19.12.2025NIFTY KEY LEVELS FOR 19.12.2025
Timeframe: 3 Minutes
If the candle stays above the pivot point, it is considered a bullish bias; if it remains below, it indicates a bearish bias. Price may reverse near Resistance 1 or Support 1. If it moves further, the next potential reversal zone is near Resistance 2 or Support 2. If these levels are also broken, we can expect the trend.
When a support or resistance level is broken, it often reverses its role; a broken resistance becomes the new support, and a broken support becomes the new resistance.
If the range(R2-S2) is narrow, the market may become volatile or trend strongly. If the range is wide, the market is more likely to remain sideways
please like and share my idea if you find it helpful
📢 Disclaimer
I am not a SEBI-registered financial adviser.
The information, views, and ideas shared here are purely for educational and informational purposes only. They are not intended as investment advice or a recommendation to buy, sell, or hold any financial instruments.
Please consult with your SEBI-registered financial advisor before making any trading or investment decisions.
Trading and investing in the stock market involves risk, and you should do your own research and analysis. You are solely responsible for any decisions made based on this research

NIFTY : Trading levels and Plan for 19-Dec-2025📘 NIFTY Trading Plan for 19-Dec-2025
(Chart reference: 15-min | Gap criteria considered: 100+ points)
Important Levels from Chart
Opening Resistance: 25,848
Last Intraday Resistance: 25,923 – 25,951
Upper Target / Supply: 25,985
Opening Support (No-Trade Zone): 25,763 – 25,814
Last Intraday Support: 25,677 – 25,703
Extreme Support: 25,594
🟢 1. GAP-UP OPENING (100+ Points)
If NIFTY opens above 25,848, it directly enters the overhead resistance structure.
🎓 Educational Explanation:
A gap-up opening indicates overnight positive sentiment, but price often reacts near prior supply zones due to profit booking. Professional traders avoid chasing and instead wait for acceptance above resistance or a healthy retest.
Plan of Action:
Sustaining above 25,848 for 10–15 minutes can allow pullback-based long entries.
First upside hurdle is 25,923–25,951 (last intraday resistance zone).
Acceptance above 25,951 may extend the move toward 25,985.
Rejection or exhaustion near 25,923–25,951 can trigger a pullback toward 25,848.
Option buyers should prefer ATM/ITM Calls only after confirmation; avoid buying at the opening spike.
🟡 2. FLAT OPENING
A flat open near 25,800–25,830 places NIFTY inside the Opening Support / No-Trade Zone.
🎓 Educational Explanation:
Flat opens represent market indecision. During such phases, price tends to trap early buyers and sellers. Direction becomes clear only after a range breakout or breakdown, making patience crucial.
Plan of Action:
Break and sustain above 25,848 shifts momentum toward 25,923–25,951.
Failure to cross 25,848 keeps price vulnerable to a downside test.
Breakdown below 25,763 opens downside toward 25,703–25,677.
Watch for bullish reversal patterns near 25,763–25,814 for bounce trades.
🔴 3. GAP-DOWN OPENING (100+ Points)
If NIFTY opens below 25,763, selling pressure may dominate early.
🎓 Educational Explanation:
Gap-down openings are often driven by fear. However, strong historical demand zones usually attract buyers looking for value, leading to short-covering bounces. Selling blindly at support increases risk.
Plan of Action:
First demand zone to observe is 25,703–25,677; look for rejection or base formation.
A bounce from this zone can retrace toward 25,763–25,814.
Sustained breakdown below 25,677 exposes the 25,594 level.
Any pullback toward 25,763 after breakdown becomes a selling-on-rise opportunity.
⚙️ Risk Management Tips for Options Traders 🛡️
Avoid trading in the first 5–10 minutes during gap days.
Do not buy options near resistance or sell near support—wait for confirmation.
Use time-based stop-loss (15–20 minutes) if the premium fails to move.
Risk only 1–2% of total capital per trade.
Prefer ATM options or vertical spreads to manage theta decay.
Book partial profits near marked resistance/support zones.
🧾 Summary & Conclusion
Above 25,848: Bulls stay active with targets 25,951 → 25,985.
Between 25,763–25,848: Market remains range-bound; patience is key.
Below 25,763: Sellers gain control unless buyers defend 25,703–25,677.
Focus on price behaviour at levels, not prediction.
Consistency comes from discipline, not frequent trades.
⚠️ Disclaimer
I am not a SEBI-registered analyst. This trading plan is for educational purposes only and should not be considered financial or investment advice. Please consult your financial advisor before taking any trades.

NIFTY KEY LEVELS FOR 18.12.2025NIFTY KEY LEVELS FOR 18.12.2025
Timeframe: 3 Minutes
If the candle stays above the pivot point, it is considered a bullish bias; if it remains below, it indicates a bearish bias. Price may reverse near Resistance 1 or Support 1. If it moves further, the next potential reversal zone is near Resistance 2 or Support 2. If these levels are also broken, we can expect the trend.
When a support or resistance level is broken, it often reverses its role; a broken resistance becomes the new support, and a broken support becomes the new resistance.
If the range(R2-S2) is narrow, the market may become volatile or trend strongly. If the range is wide, the market is more likely to remain sideways
please like and share my idea if you find it helpful
📢 Disclaimer
I am not a SEBI-registered financial adviser.
The information, views, and ideas shared here are purely for educational and informational purposes only. They are not intended as investment advice or a recommendation to buy, sell, or hold any financial instruments.
Please consult with your SEBI-registered financial advisor before making any trading or investment decisions.
Trading and investing in the stock market involves risk, and you should do your own research and analysis. You are solely responsible for any decisions made based on this research

NIFTY : Trading levels and Plan for 18-Dec-2025📘 NIFTY Trading Plan for 18-Dec-2025
(Timeframe reference: 15-min | Gap criteria: 100+ points)
Key Levels to Track (from chart):
Opening Resistance: 25,876
Last Intraday Resistance: 25,969 – 25,994
Higher Supply Zone: 26,080 – 26,140
Opening Support: 25,748 – 25,768
Last Intraday Support (Buyer’s Zone): 25,594 – 25,647
🟢 1. GAP-UP OPENING (100+ Points)
If NIFTY opens above 25,876, price directly enters the short-term resistance structure.
🎓 Educational Explanation:
A gap-up above resistance indicates overnight bullish sentiment, but such openings often attract profit booking by early buyers. Markets usually attempt to retest breakout zones before deciding continuation or reversal. Chasing price without confirmation increases risk.
Plan of Action:
If price sustains above 25,876 for 10–15 minutes, look for pullback-based long entries.
Upside targets remain 25,969–25,994, where supply is expected.
Strong breakout and acceptance above 25,994 can open the path toward 26,080–26,140.
Rejection or exhaustion candle near 25,994 may trigger a pullback toward 25,876.
Option buyers should prefer ATM/ITM calls only after retest confirmation, not at the opening spike.
🟡 2. FLAT OPENING
A flat open near 25,800–25,830 keeps NIFTY inside a balance zone.
🎓 Educational Explanation:
Flat opens are decision-making zones. Direction emerges only after buyers or sellers show commitment. The first 30 minutes form the intraday structure, and trading without confirmation leads to whipsaws.
Plan of Action:
Sustaining above 25,876 turns sentiment bullish, targeting 25,969–25,994.
Failure to cross 25,876 keeps price range-bound and vulnerable to pullbacks.
Breakdown below 25,768 shifts control to sellers, opening downside toward 25,647–25,594.
Bullish reversal patterns near 25,748–25,768 can offer low-risk long setups.
🔴 3. GAP-DOWN OPENING (100+ Points)
If NIFTY opens below 25,748, market sentiment turns cautious.
🎓 Educational Explanation:
Gap-downs are often emotion-driven. Initial selling pressure may look strong, but strong demand zones attract positional buyers. Smart traders wait for price behaviour at support instead of selling into panic.
Plan of Action:
First reaction zone: 25,594 – 25,647 (Buyer’s must-try zone).
Look for strong rejection candles or bullish divergence for bounce trades.
If price sustains below 25,594, weakness may extend further—avoid aggressive longs.
Any pullback toward 25,748–25,768 after breakdown becomes a selling-on-rise opportunity.
⚙️ Risk Management Tips for Options Traders 🛡️
Avoid trading in the first 5–10 minutes during gap openings.
Do not buy options at resistance or sell at support—wait for confirmation.
Use time-based stop loss (15–20 minutes) if premium doesn’t move.
Risk only 1–2% of capital per trade.
Prefer spreads or ATM options during high IV sessions.
Protect profits aggressively near resistance zones.
🧾 Summary & Conclusion
Above 25,876: Bulls stay active, targets 25,994 and above.
Between 25,768–25,876: Market remains indecisive—patience required.
Below 25,748: Sellers gain control unless strong demand emerges at 25,594.
Focus on structure, confirmation, and disciplined risk, not prediction.
Best trades come from waiting, not reacting emotionally.
⚠️ Disclaimer
I am not a SEBI-registered analyst. This trading plan is purely for educational purposes and should not be considered as financial or investment advice. Please consult your financial advisor before taking any trades.

#NIFTY Intraday Support and Resistance Levels - 18/12/2025A flat opening is expected in Nifty 50, with the index continuing to trade inside a well-defined consolidation range formed over the last few sessions. Price is currently hovering near the 25,800–25,850 zone, which is acting as a short-term balance area. This indicates that the market remains range-bound, with traders waiting for a decisive breakout or breakdown before committing to a strong directional move.
On the upside, a sustained move above 26,050 will be the key trigger for fresh bullish momentum. If Nifty manages to hold above this resistance level, long positions can be considered, with upside targets placed at 26,150, 26,200, and 26,250+. Additionally, a reversal long trade can be considered near the 25,750–25,800 support zone, provided price shows stability, targeting 25,850, 25,900, and 25,950+.
On the downside, if the index faces rejection near 25,950–25,900, selling pressure may emerge. In such a case, short positions can be initiated with downside targets at 25,850, 25,800, and 25,750-. A stronger bearish continuation will be confirmed if Nifty breaks below 25,700, which may open further downside toward 25,650, 25,550, and 25,500-. Until a clear directional breakout occurs, traders are advised to trade within the range, maintain strict risk management, and avoid over-leveraging.

NIFTY KEY LEVELS FOR 17.12.2025NIFTY KEY LEVELS FOR 17.12.2025
Timeframe: 3 Minutes
If the candle stays above the pivot point, it is considered a bullish bias; if it remains below, it indicates a bearish bias. Price may reverse near Resistance 1 or Support 1. If it moves further, the next potential reversal zone is near Resistance 2 or Support 2. If these levels are also broken, we can expect the trend.
When a support or resistance level is broken, it often reverses its role; a broken resistance becomes the new support, and a broken support becomes the new resistance.
If the range(R2-S2) is narrow, the market may become volatile or trend strongly. If the range is wide, the market is more likely to remain sideways
please like and share my idea if you find it helpful
📢 Disclaimer
I am not a SEBI-registered financial adviser.
The information, views, and ideas shared here are purely for educational and informational purposes only. They are not intended as investment advice or a recommendation to buy, sell, or hold any financial instruments.
Please consult with your SEBI-registered financial advisor before making any trading or investment decisions.
Trading and investing in the stock market involves risk, and you should do your own research and analysis. You are solely responsible for any decisions made based on this research
Update idea
Add note

#NIFTY Intraday Support and Resistance Levels - 17/12/2025A gap-up opening near 25,950 is expected in Nifty 50, placing the index once again inside the well-defined consolidation range that has been holding for the past few sessions. The price is hovering around the 25,950–26,000 zone, which continues to act as a short-term equilibrium area, indicating a balance between buyers and sellers. This structure suggests that the market is still undecided, and a clear breakout on either side is required to establish directional strength.
On the upside, a sustained move above 26,050 will be the key signal for bullish continuation. If the index manages to hold above this level with strong price acceptance, long positions can be considered. The immediate upside targets will be 26,150, 26,200, and 26,250+. A decisive breakout above this resistance zone may trigger fresh buying momentum and short covering, pushing the index toward higher resistance levels.
On the downside, failure to sustain above the 25,950–25,900 zone may result in renewed selling pressure. A rejection from this area would open the door for short trades, with downside targets placed at 25,850, 25,800, and 25,750-, where strong demand and previous support are expected. Until Nifty delivers a confirmed breakout or breakdown, traders should stick to range-based setups, maintain strict stop-loss discipline, and avoid aggressive directional positions.

NIFTY : Trading levels and Plan for 17-Dec-2025📘 NIFTY Trading Plan for 17-Dec-2025
(Based on key levels: 25,953 – 26,011 – 26,111 (resistances) and 25,874 – 25,747 – 25,771 – 25,647 (supports))
Gap criteria considered: 100+ points
🔵 1. GAP-UP OPENING (100+ Points)
If NIFTY opens above 25,953, it directly enters the resistance territory visible on the chart, where the market often tests supply zones.
🔍 Educational Logic:
When the index opens significantly higher, early buyers from the previous session tend to book profits. Hence the market may retest the breakout zone before showing a directional move. Understanding this behaviour prevents traders from chasing breakouts blindly.
Plan of Action:
If price opens above 25,953 and sustains for 15-min, look for long entries toward 26,011.
If 26,011 breaks with volume, expect a momentum push toward 26,111, the major intraday resistance.
A rejection wick or bearish Engulfing pattern at 26,011 = ideal for a small pullback trade back to 25,953.
For option buyers: Prefer CE entries only after a retest & confirmation; avoid buying at resistance.
🟠 2. FLAT OPENING
A flat open near the 25,874–25,880 zone places NIFTY exactly at the Opening Support/Resistance line.
🔍 Educational Logic:
Here the market is neutral, and the first 30 minutes typically decide the trend. The concept of "Opening Range" becomes very important—break of ORH/ORL gives a cleaner directional move. Avoid predicting the direction—wait for confirmation.
Plan of Action:
If price holds above 25,874, buyers may take charge and lead a move toward 25,953.
A breakout above 25,953 can extend quickly toward 26,011.
If NIFTY slips below 25,851, that becomes a weak sign → expect a move toward 25,771–25,747 support zone.
Watch for bullish reversal candle at 25,747–25,771 (buyers must try zone).
🔴 3. GAP-DOWN OPENING (100+ Points)
If NIFTY opens below 25,771, we enter a sentiment-driven weak zone.
🔍 Educational Logic:
Large gap-downs often occur due to overnight negative cues. The initial volatility is usually created by fear-based reactions. A structured trader waits for stability before entering. Many reversals also begin after a gap-down because early sellers exhaust quickly.
Plan of Action:
First support comes at 25,747–25,771 — monitor for a reversal setup.
If price fails to hold this zone, next downside target becomes 25,647, the major support.
A break below 25,647 with strong candles = trending bearish day; avoid bottom-fishing.
If reversal occurs near 25,747, expect a recovery toward 25,851 and later 25,874.
⚙️ Risk Management Tips for Option Traders
📌 These principles protect your capital and sustain long-term trading:
Never buy options at major resistance or support — wait for confirmation.
Follow time-stop: if your option doesn't move in 15–20 minutes despite the index moving, exit.
Maintain a fixed risk: reward of at least 1:2 on every directional trade.
Avoid trading in the first 5 minutes during 100+ point gaps — volatility is artificially high.
Define your loss level before entering; never widen your SL emotionally.
Scale-in only after the trade moves in your favour, not before.
🧾 Summary & Conclusion
A Gap-Up above 25,953 demands patience for a retest before long entries.
A Flat Open near 25,874 is a neutral scenario — rely on Opening Range breakout.
A Gap-Down below 25,771 invites caution; watch for reversal patterns at support zones.
Market structure is more important than prediction. Stick to confirmation-based entries and disciplined exits.
For option buyers, momentum zones and retest confirmations are crucial for high-quality trades.
⚠️ Disclaimer
I am not a SEBI-registered analyst. This trading plan is for educational purposes only and should not be considered financial advice. Please consult your financial advisor before making trading decisions.

NIFTY50 – Short Term Support TradeNIFTY50 has been trading inside a falling channel for the last ~15 sessions, indicating controlled corrective price action.
Key Short-Term Support Zone:
25,780 – 25,835
Why this zone matters (Confluence):
0.50 Fibonacci retracement (50%)
Mid-point / 50% of the falling channel
Volume Area Low (VAL) – strong demand zone
Multiple tests without breakdown
Trade Plan (Short Term):
Buy near: 25,800 ±
Stop Loss: Below 25,720 (closing basis)
Breakdown below 25,720 invalidates the setup and may extend the corrective move.
As long as price holds above the support zone, buy on dips is favored within the channel.
Fibonacci + Structure + Volume = High-probability support.

NIFTY : Trading levels and Plan for 15-Dec-2025📊 NIFTY – TRADING PLAN FOR 15 DEC 2025 (Rewritten & Improved)
Price closed near 26,014, exactly at a midpoint where both buyers and sellers showed activity.
Your directional arrows indicate:
Green arrows → Areas where buyers are expected to step in strongly; ideal long setups after confirmation
Red arrows → Areas where sellers take control after buyer exhaustion; ideal short setups after breakdown & retest
Orange arrows → Areas where price is indecisive; avoid trading until breakout or breakdown
🚀 1. GAP-UP OPENING (100+ points)
1. If Nifty opens between 26,093 – 26,138
• This region reflects a hesitation zone, as shown by the orange arrows.
• Buyers and sellers are both active; market is likely to range.
• No trade here until market shows clear direction.
• Watch for:
– A breakout above 26,138 → follow the green arrow path, buyers take control → Targets 26,257 → 26,294.
– A rejection from 26,138 and fall below 26,093 → follow red arrow path, sellers gain momentum → Target 25,947.
2. If market opens above 26,138
• According to the green directional arrows, buyers are ready to continue the rally.
• Best trade:
– Wait for a minor pullback into 26,138 area
– Enter long on bullish confirmation
• Target zone remains 26,257–26,294.
• Ideal for option buyers due to direction clarity.
3. If gap-up opens only slightly above 26,014 but below 26,093
• The chart arrows show mixed direction — no strong trend yet.
• Wait for confirmation.
• Only trade after:
– Break and retest above 26,093 (long)
– Break below 25,947 (short)
⚖ 2. FLAT OPENING (around 26,000)
1. Price moves into 26,093 zone first (orange arrows)
• This is a stalling region — price may oscillate, offering no clear setup.
• Avoid trading until breakout or breakdown.
• Once direction is chosen:
– Above 26,093 → follow green arrows → long opportunity
– Below 25,947 → follow red arrows → short opportunity
2. If 25,947 holds strongly after open
• Buyers are showing interest exactly where the green arrows begin.
• Good long setup after a higher-low or bullish candle pattern.
• Targets: 26,014 → 26,093 → 26,138.
3. If price rejects 26,093 and turns down sharply
• This is aligned with first red arrow structure.
• Short only when price breaks 25,947 with momentum and retests.
• Targets: 25,885 → 25,771.
📉 3. GAP-DOWN OPENING (100+ points)
1. Opening near 25,885
• Your green arrows show this as a strong buyer reaction zone.
• Expect a possible reversal or stabilisation.
• Long setup only after:
– Wick rejections
– CHoCH / BOS
– Retest of intraday level
• Upside targets: 25,947 → 26,014 → 26,093.
2. If 25,885 breaks and price fails retest
• This confirms the red arrows' downward continuation path.
• Best short entry:
– Break
– Retest
– Confirmation candle
• Targets: 25,771.
3. If price opens directly near 25,771
• This is where the strongest fight occurs before the market chooses direction — shown by mixed arrows.
• Avoid immediate entry.
• Only trade once:
– Strong reversal appears (long)
– Or level breaks and confirms (short)
🛡 RISK MANAGEMENT FOR OPTIONS TRADERS
1. Avoid trading the first 5 minutes, especially on gap days.
2. SL must be based on SPOT price, not premium.
3. Follow arrow direction strictly:
– Green arrows → Consider CE / long futures
– Red arrows → Consider PE / short futures
– Orange arrows → Avoid trades completely
4. Do not buy far OTM options during consolidation.
5. When in profit, trail SL — especially near 26,138 & 26,257 resistance.
6. Respect max loss limit: stop for the day if you hit 1–2% capital loss.
📌 SUMMARY & CONCLUSION
• Green arrows = Buyer strength zones → Best long setups with good R:R.
• Red arrows = Short continuation zones → Ideal areas to short after breakdown confirmation.
• Orange arrows = No-trade areas → Wait for breakout; don’t force trades.
• Above 26,138, bullish momentum increases.
• Below 25,947, bearish continuation strengthens.
• Profit booking expected at 26,257–26,294.
This plan aligns exactly with the direction suggested by your arrows and provides a clean, professional decision-making framework.
⚠ DISCLAIMER
I am not a SEBI-registered analyst.
This plan is only for educational purposes.
Trade using your own analysis and risk management.

Daily analysis: NIFTY 15.12.2025A mixed sentiment is there for Nifty. Although the fall in the morning has filled Friday's gap, prices are expected to fill today's gap as well. But for any buy, a retest of support is suggested.
Levels are mostly for intraday purposes, except for the sell-side 25660sh range.

#NIFTY Intraday Support and Resistance Levels - 15/12/2025A flat opening is expected in Nifty, with price continuing to respect the same key levels observed in previous sessions. The index remains trapped inside a well-defined consolidation range, with 25,954–26,051 acting as the immediate supply–demand zone. The lack of fresh momentum indicates that the market is waiting for a decisive trigger before choosing direction.
On the upside, a sustained move above 26,050 will be the first sign of strength. If Nifty manages to hold above this level, long opportunities can open up toward 26,150, 26,200, and 26,250+, aligning with the upper resistance zone marked on the chart. Any breakout above this zone should ideally be supported by strong volume for confirmation.
On the downside, failure to hold the consolidation zone and a move below 25,950–25,900 may invite selling pressure. In such a scenario, short trades can be considered with downside targets at 25,850, 25,800, and 25,750-, where previous buying interest was seen. Until a clear breakout or breakdown occurs, traders should expect range-bound movement, focusing on level-based trades with disciplined risk management.

NIFTY : Trading levels and Plan for 15-Dec-2025📊 NIFTY – TRADING PLAN FOR 15 DEC 2025
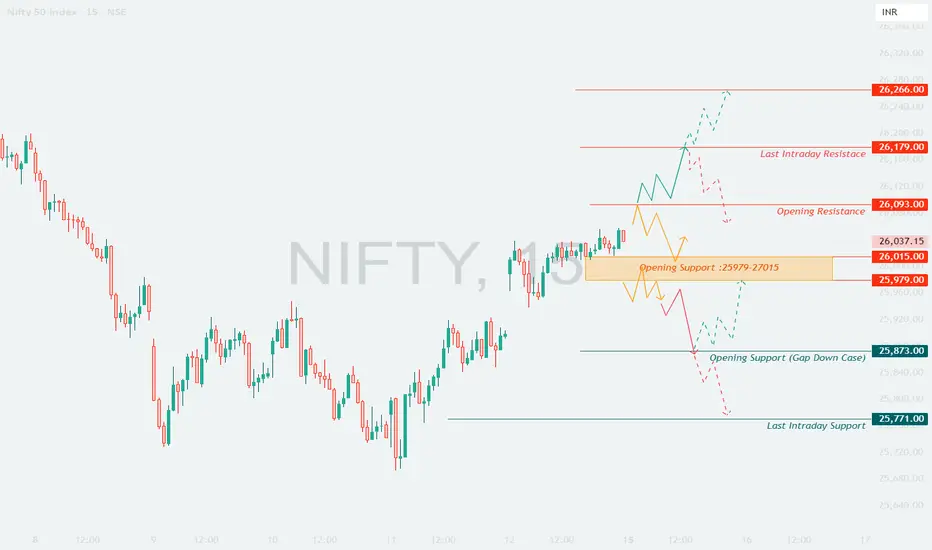
Nifty closed near 26,037, just above a key support band (Opening Support: 25,979–26,015) and below a series of overhead resistances.
The session will heavily depend on how price reacts at:
Opening Support Zone: 25,979 – 26,015
Opening Resistance: 26,093
Last Intraday Resistance: 26,179
Major Upside Target: 26,266
Opening Support (Gap-down case): 25,873
Last Intraday Support: 25,771
Let’s break down every opening scenario.
🚀 1. GAP–UP OPENING (100+ points)
A gap-up above 26,130–26,150 shows strong bullish intent.
1. If Nifty opens above 26,093 but below 26,179
• Market opens directly inside resistance.
• Do NOT chase long immediately.
• Wait for either:
– Breakout above 26,179, followed by retest → Long toward 26,266.
– Rejection at 26,179, falling back under 26,093 → Short toward 26,015.
2. If Nifty opens above 26,179
• Strong bullish continuation.
• On a retest of 26,179, a long becomes high-probability.
• Targets: 26,220 → 26,266.
• Book partial profits in the final target zone.
3. If gap-up is between 26,015–26,093
• Price opens slightly above support and may retest the zone.
• If 26,015–25,979 holds → Long toward 26,093 → 26,179.
• If 26,015 breaks with momentum, move to caution; market becomes vulnerable to deeper pullbacks.
⚖ 2. FLAT OPENING (near 25,980–26,030)
A flat open near support allows clearer early structure.
1. If 25,979–26,015 holds as strong support
• Watch for bullish rejection candles or higher lows.
• Long setups valid toward 26,093 → 26,179.
2. Break above 26,093 with a retest
• Confirms directional strength.
• Target becomes 26,179 → 26,266.
3. If price rejects 26,093 early and falls back
• Sideways consolidation may form inside the orange zone.
• Only short when 25,979 breaks convincingly.
• Downside targets: 25,873 → 25,771.
📉 3. GAP–DOWN OPENING (100+ points)
Expected gap-down region: 25,930–25,850.
1. If opening is near 25,873 (Gap-down Support)
• Avoid shorting blindly; it’s a strong demand zone.
• Look for reversal patterns (wick rejections, CHoCH).
• If confirmed → Long toward 25,979 → 26,015.
2. If opening falls below 25,873
• Market enters weak territory.
• Next support is 25,771 (Last Intraday Support).
• A retest of 25,873 after breakdown → Short toward 25,771.
3. If 25,771 also breaks
• Trend turns bearish for the session.
• Expect extended downside movement; avoid bottom fishing.
• Trail SL aggressively if short.
🛡 RISK MANAGEMENT GUIDELINES FOR OPTIONS TRADERS
1. Avoid trading first 3–5 minutes, especially on gap days (IV distortion).
2. Keep SL based on spot levels, not premium fluctuation alone.
3. Prefer ATM/ITM options for directional trades — better risk control.
4. Do NOT average losing positions — cut losers quickly.
5. Avoid deep OTM options unless using them for hedging.
6. Book partial profits at intermediate levels to lock in gains.
7. If VIX rises sharply → favor option selling with hedges.
8. Maximum daily loss limit = 1–2% of capital. Stop trading once hit.
📌 SUMMARY & CONCLUSION
• Bullish bias only above 26,093, with confirmation above 26,179.
• Upside target zone: up to 26,266.
• Neutral/choppy zone: 25,979–26,093. Confirm structure before entering.
• Downside risk: Below 25,979, real weakness begins.
• Major supports for reversal: 25,873 and 25,771.
Stay patient, avoid emotional trades, and trade only on confirmation.
⚠ DISCLAIMER
I am not a SEBI-registered analyst.
This trading plan is for educational purposes only and should not be treated as investment advice.
Always conduct your own analysis and follow strict risk management.
NIFTY 50 – Price Action & Market Structure AnalysisCurrent Price: ~26,050
Market Context: Post-rally consolidation near ATH supply
🔹 Higher Timeframe (Weekly) Structure
NIFTY remains in a primary bullish market structure on the weekly timeframe.
The index has consistently respected Higher Highs (HH) and Higher Lows (HL) since the March reversal.
Price is currently consolidating below a clearly defined weekly supply zone near 26,300–26,500, indicating distribution rather than reversal.
No weekly Break of Structure (BOS) to the downside has occurred yet — bullish structure remains intact.
Key Weekly Levels
Weekly Supply / Resistance: 26,300 – 26,500
Weekly Demand / Support: 25,200 – 25,000
Major HTF Demand: 24,400 – 24,000
🔹 Daily Timeframe – Internal Structure
After the strong impulsive leg up, price entered a range-bound corrective phase.
A Minor Market Structure Shift (MSS) occurred on the daily chart, confirming short-term weakness, not a trend reversal.
Price is trading inside a premium zone, suggesting limited upside without deeper consolidation.
Multiple Fair Value Gaps (FVGs) below remain unmitigated — increasing probability of a pullback.
Daily Levels of Interest
Immediate Resistance: 26,200 – 26,350
Range Support: 25,750 – 25,600
Daily Demand Zone: 25,400 – 25,200
Invalidation Level (Bullish): Daily close below 25,200
🔹 Market Scenarios
Scenario 1 – Healthy Bullish Continuation
Price retraces into 25,400–25,200 demand
Liquidity sweep + bullish displacement
Continuation toward 26,600+
Scenario 2 – Extended Consolidation
Range persists between 25,600–26,300
Ideal environment for mean-reversion & intraday trading
Scenario 3 – Deeper Correction (Low Probability)
Weekly close below 25,000
Opens path toward 24,400 HTF demand
🔹 Trading Bias
Bias: Bullish on dips, cautious near highs
Environment: Distribution / consolidation
Strategy Preference: Buy at HTF demand, avoid chasing highs
📌 Conclusion
NIFTY is not bearish, but overextended in the short term. The current price action suggests smart money digestion, not distribution breakdown. Patience is required for high-probability entries at discounted levels.

NIFTY at a Pause: Consolidation Shapes the Near-Term TrendIndian equity markets ended the week on a slightly softer note, with the benchmark NIFTY slipping 0.53% on a weekly basis. While a supportive rate cut by the US Federal Reserve helped improve global sentiment and led to two consecutive sessions of gains, the broader trend remains mixed.
Adding to this, India VIX dropped 2.01% to 10.11, suggesting calm market conditions.
◉ Technical Setup: Key Pattern in Focus
On the daily chart, NIFTY is forming a rising wedge pattern and has recently bounced from its trendline support.
● Typically, a rising wedge reflects bearish undertones, especially near maturity.
● However, if the index manages to break above the upper resistance line and sustain, it could invalidate the bearish setup and shift sentiment positively.
● On the flip side, a decisive breakdown below support may open the door for a meaningful correction in the coming sessions.
◉ Important Levels to Watch
Based on open interest data, two critical zones are emerging as key for the current monthly expiry:
● Strong Support: 25,900 – 26,000
● Strong Resistance: 26,400 – 26,500
With no major triggers visible in the near term, NIFTY is likely to remain range-bound, consolidating between these levels.
◉ Strategy: Trade Smart, Stay Selective
Traders should maintain a moderately cautious stance in the current setup.
● Book or protect profits near higher levels.
● Avoid aggressive long positions until a clear breakout above 26,400–26,500 is confirmed.
● Prefer a stock-specific approach, focusing on names showing relative strength, while keeping risk management front and center.
