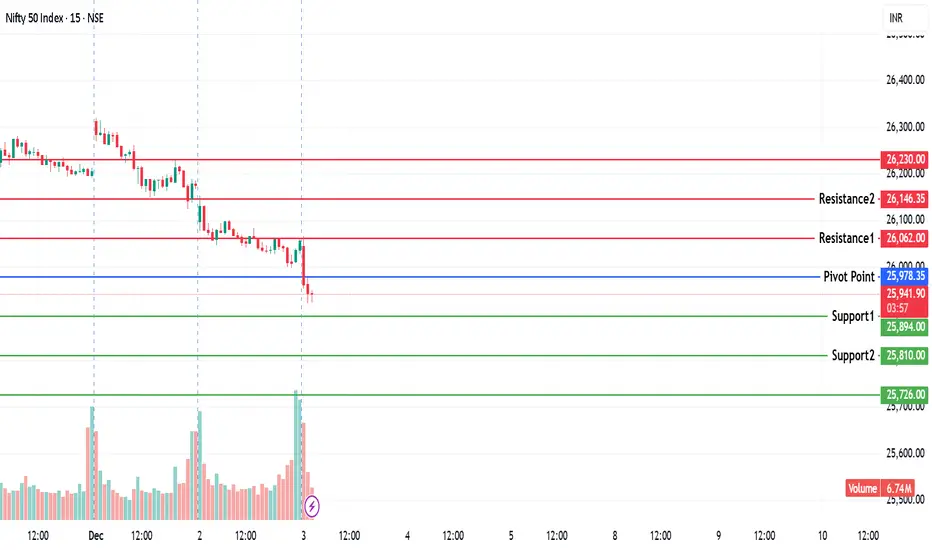
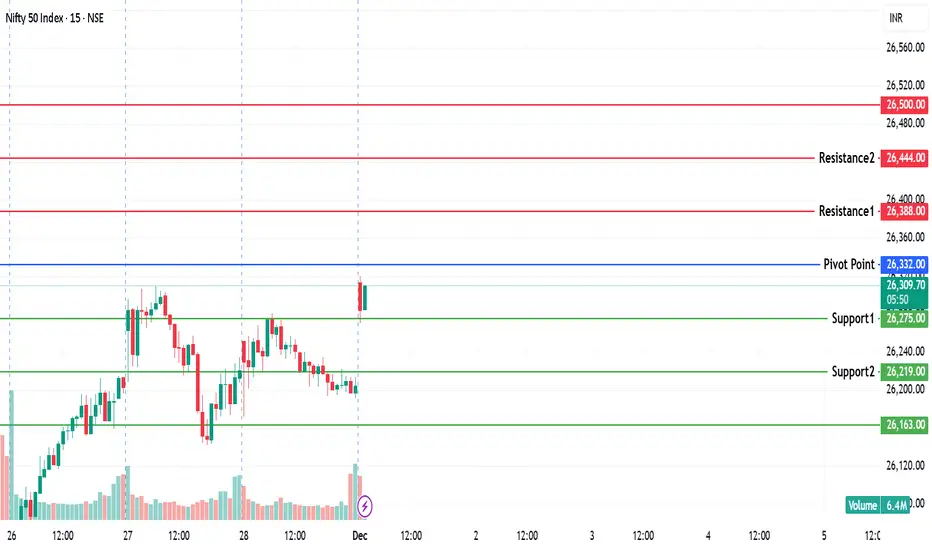
NIFTY KEY LEVELS FOR 03.12.2025NIFTY KEY LEVELS FOR 03.12.2025
Timeframe: 3 Minutes
If the candle stays above the pivot point, it is considered a bullish bias; if it remains below, it indicates a bearish bias. Price may reverse near Resistance 1 or Support 1. If it moves further, the next potential reversal zone is near Resistance 2 or Support 2. If these levels are also broken, we can expect the trend.
When a support or resistance level is broken, it often reverses its role; a broken resistance becomes the new support, and a broken support becomes the new resistance.
If the range(R2-S2) is narrow, the market may become volatile or trend strongly. If the range is wide, the market is more likely to remain sideways
please like and share my idea if you find it helpful
📢 Disclaimer
I am not a SEBI-registered financial adviser.
The information, views, and ideas shared here are purely for educational and informational purposes only. They are not intended as investment advice or a recommendation to buy, sell, or hold any financial instruments.
Please consult with your SEBI-registered financial advisor before making any trading or investment decisions.
Trading and investing in the stock market involves risk, and you should do your own research and analysis. You are solely responsible for any decisions made based on this research
Niftylevels
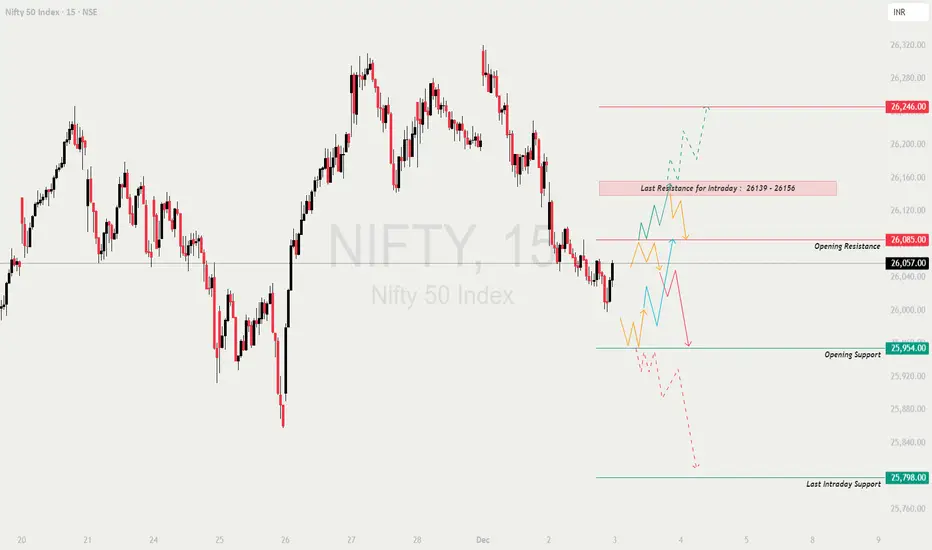
NIFTY : Trading levels and Plan for 03-Dec-2025📊 NIFTY TRADING PLAN — 03 DEC 2025
Nifty closed around 26,057, sitting just below the Opening Resistance (26,085) and far from both the day’s support and supply zones.
The chart indicates bearish pressure, but buyers still defend the 25,954 support on dips.
The behaviour at the opening will define whether the index attempts a rebound or continues the downtrend.
🔍 Key Levels For The Day
🟥 Opening Resistance: 26,085
🟥 Last Intraday Resistance: 26,139 – 26,156
🟥 Major Upside Target: 26,246
🟩 Opening Support: 25,954
🟩 Last Intraday Support: 25,798
🟩 Major Breakdown Target: 25,760 – 25,720
🟩 SCENARIO 1 — GAP-UP OPENING (100+ Points)
If Nifty opens near 26,150–26,200, it jumps straight into the resistance zone.
If price sustains above 26,085 → It will attempt the next resistance at:
26,139 → 26,156 → 26,200+
Break & retest above 26,156 gives a drive toward 26,246.
If price rejects 26,085–26,139 (upper wicks, strong red candle) →
Expect profit-booking down toward 26,020 → 25,954.
Safer Long Setup:
✔️ Breakout above 26,156 + Retest → Target 26,200 / 26,246
Early aggressive shorting is risky.
Gap-ups near resistance often create trap candles.
📘 Educational Note:
A gap-up directly into resistance is often a testing zone where institutions check if late buyers will panic.
Let the chart confirm strength before entering.
🟧 SCENARIO 2 — FLAT OPENING (25,980–26,050)
Flat openings create a balanced battlefield between bulls and bears.
Upside trigger → Break above 26,085
Targets → 26,139 → 26,156 → 26,200
Downside trigger → Break below 25,954
Targets → 25,900 → 25,850 → 25,798
Avoid trading inside the tight range 26,020–26,070 — high noise, low reward.
Two ideal setups:
✔️ Breakout & Retest above 26,085
✔️ Breakdown & Retest below 25,954
💡 Educational Tip:
Flat opens typically lead to a clean breakout after the first 2–3 candles.
Let direction reveal itself instead of predicting it.
🔻 SCENARIO 3 — GAP-DOWN OPENING (100+ Points)
If Nifty opens around 25,920–25,960, it opens near or inside support.
If buyers defend 25,954 and form higher lows →
Reversal targets:
26,020 → 26,057 → 26,085
If 25,954 breaks decisively →
Next targets → 25,900 → 25,850 → 25,798
Breakdown below 25,798 triggers stronger fall →
Targets → 25,760 → 25,720
Reversal trades should only be taken with:
✔️ bullish candle
✔️ higher low
✔️ strong wick rejection
inside the support zone.
📘 Educational Note:
Gap-downs into support attract smart money buying, but only if the zone holds.
A breakdown usually gives a clean trend day on the downside.
💼 RISK MANAGEMENT TIPS FOR OPTION TRADERS 🔐💡
Do NOT trade the first 5 minutes after open (avoid traps).
Prefer ITM/ATM options for directional moves.
Use chart-level SL, not premium-level SL.
Avoid averaging losing trades — re-entry is always safer.
Trail SL once the trade hits the first target.
During high VIX, prefer option spreads.
Avoid overtrading during volatile candle clusters.
⚠️ Golden Rule:
Protect capital first.
Exposure without risk control = guaranteed loss.
📌 SUMMARY
Bullish Above:
✔️ 26,085 → 26,139 → 26,156 → 26,200 → 26,246
Bearish Below:
✔️ 25,954 → 25,900 → 25,850 → 25,798 → 25,760
Reversal Zones:
🟩 25,954 (Opening Support)
🟩 25,798 (Intraday Support)
🟥 26,085 (Opening Resistance)
🟥 26,139–26,156 (Key Supply Zone)
Avoid Trading Inside:
⚠️ 26,020–26,070
This is the NOISE zone.
🧾 CONCLUSION
Nifty is set for a decisive day with clear vertical levels.
Trend direction will be driven by:
✔️ Sustaining above 26,085 = Bullish continuation
✔️ Breaking below 25,954 = Fresh downside
✔️ Breakout above 26,156 = Strong rally
✔️ Breakdown below 25,798 = Sharp sell-off
Trade only with confirmation, avoid guessing direction, and focus on clean structure-based entries.
⚠️ DISCLAIMER
I am not a SEBI-registered analyst.
This analysis is purely for educational purposes.
Please consult your financial advisor before making trading decisions.
Nifty 50 Price Structure Analysis [03/12/2025: Wednesday]Top-Down Nifty 50 Price Structure Analysis for 03rd of December 2025. The day is Wednesday.
(1) Monthly Time Frame:
Red candle. So far, it is an inside month. The long-term trend is bullish, but the short-term trend shows weakness. Strong resistance is at levels 26300 and 26150. Strong support is at levels 26000 and 26850. The market is showing weakness at the all-time high (ATH). The view is indecisive to bearish.
(2) Weekly Time Frame:
Red Marubozu. The candle engulfed the body of the last week. A clear sign of weakness. Now major resistance is in the zone 26150 - 26100. Minor support is at level 26000. If level 26000 is breached, then level 25850 is reachable. No bearish trade till the price goes above the 26150 level. The view is bearish.
(3) Daily Time Frame:
Back-2-back 4 red days. Price gave a breakdown from level 26150, confirming the consolidation zone (26300 - 26150) as a major distribution zone. No, the previous consolidation zone is a major resistance. Take no bullish trade till price sustains above the level 26150. Every upmove should be doubted. A minor support is at level 26000. If level 26000 is breached, then there is a high chance of breaking down to level 25850. The view is bearish.
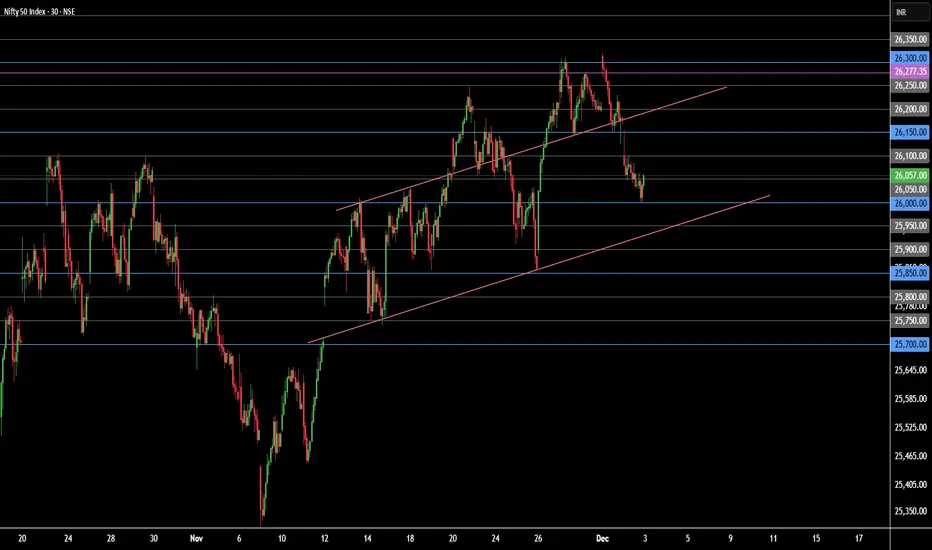
(4) 30-Minute Time Frame:
A clear sign of a sell-off. There is weakness in the market structure. Very strong resistance is at level 26150. No sign of bullishness until the price starts to trade above the level 26150. Every up move should be doubted. Minor support is at level 26000. The view is bearish.
No Trading Zone (NTZ): 26150 - 26000.
Major resistance: 26150.
Minor Support: 26000.
Probable first bearish target: 25850 (if there is a breakdown below 26000).
Bullish Scenario Set-Up:
(i) Price sustains above the opening price.
(ii) Price sustains above the level 26150.
(iii) Price forms a higher highs and higher lows structure above the level 26150.
Beairsh Scenario Set-Up:
(i) Price sustains below the opening price.
(ii) Price decisively breaches (or breaks down) level 26000.
Event:
No expiries on Wednesday. No high-impact event. However, a high-impact event is on 05 December (Friday) this week.
Expectations (Hypothesis and insight from the trade planning):
(i) There is a clear sign of weakness in the price structure. The view is bearish.
(ii) The previous zone of consolidation (26300 - 26150) is now a major zone is resistance. Any up move should be doubted.
(iii) Take no bullish trade till price forms a higher highs and lower lows structure above the level 26150.
(iv) Look only for the bearish trade.
(v) In case either a bullish or a bearish scenario does not happen, then don't trade. Trade only when conditions are met.
NOTE:
"Mark your points. Trade your points. Price is God. Anything can happen. Therefore, trade what you see, not what you believe."
Happy Trading!
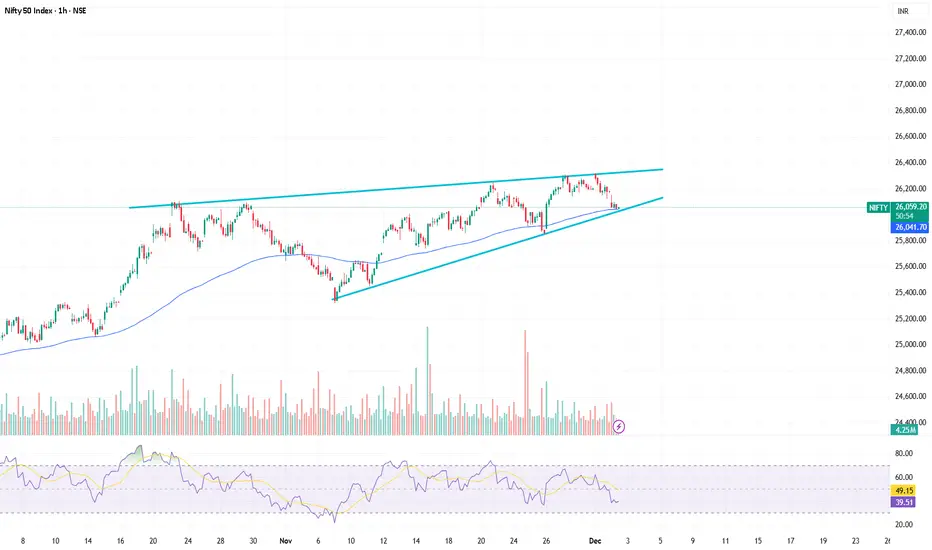
NIfty Hourly Strong SupportHello Friends,
Nifty Spot at 26050-60 having support of EMA100 along with trendline support and RSI oversold in hourly ......Overall Momentum is Bullish this is good DIP expceting 26400,26500,26700+ in coming few sessions
NIFTY KEY LEVELS FOR 02.12.2025NIFTY KEY LEVELS FOR 02.12.2025
Timeframe: 3 Minutes
If the candle stays above the pivot point, it is considered a bullish bias; if it remains below, it indicates a bearish bias. Price may reverse near Resistance 1 or Support 1. If it moves further, the next potential reversal zone is near Resistance 2 or Support 2. If these levels are also broken, we can expect the trend.
When a support or resistance level is broken, it often reverses its role; a broken resistance becomes the new support, and a broken support becomes the new resistance.
If the range(R2-S2) is narrow, the market may become volatile or trend strongly. If the range is wide, the market is more likely to remain sideways
please like and share my idea if you find it helpful
📢 Disclaimer
I am not a SEBI-registered financial adviser.
The information, views, and ideas shared here are purely for educational and informational purposes only. They are not intended as investment advice or a recommendation to buy, sell, or hold any financial instruments.
Please consult with your SEBI-registered financial advisor before making any trading or investment decisions.
Trading and investing in the stock market involves risk, and you should do your own research and analysis. You are solely responsible for any decisions made based on this research

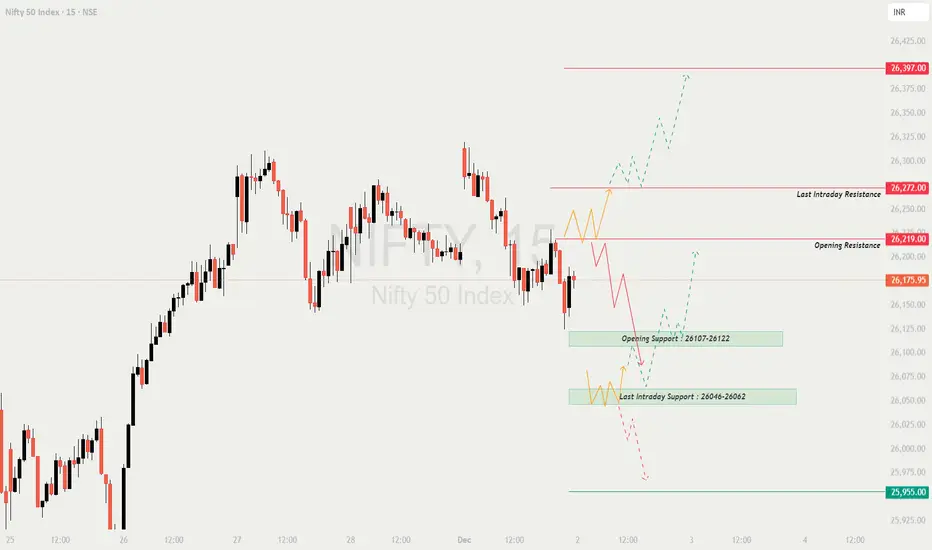
NIFTY : Trading levels and Plan for 02-Dec-2025📊 NIFTY TRADING PLAN — 02 DEC 2025
Nifty closed near 26,175, right between the Opening Resistance (26,219) and Opening Support (26,107–26,122).
The market is currently in a low-momentum, direction-hunting phase, where the opening behaviour will determine the next trend leg.
The structure shows clean supply zones above and strong demand zones below, meaning both sides have potential — but only confirmation-based trading is safe.
🔍 Key Intraday Levels
🟥 Opening Resistance: 26,219
🟥 Last Intraday Resistance: 26,272
🟥 Major Breakout Level: 26,397
🟩 Opening Support: 26,107 – 26,122
🟩 Last Intraday Support: 26,046 – 26,062
🟩 Major Breakdown Level: 25,955
🟢 SCENARIO 1 — GAP-UP OPENING (100+ Points)
If Nifty opens near 26,260–26,300, price opens right at or above resistance.
If price sustains above 26,219 for 10–15 minutes →
Upside targets: 26,272 → 26,330 → 26,397
This zone becomes a continuation breakout if volumes support.
If Nifty rejects 26,219–26,272 (wick rejections, long red candle) →
Expect a retracement towards:
➡️ 26,175 → 26,122
Best Long Setup:
Breakout above 26,272 → Retest → Bullish candle → Target 26,330 / 26,397
Avoid early shorting on gap-ups —
fakes are common near resistance clusters.
📘 Educational Note:
A gap-up directly into resistance requires patience.
Breakouts without retests often fail.
Retests confirm whether buyers truly control the level.
🟧 SCENARIO 2 — FLAT OPENING (26,150–26,190)
A flat open places Nifty between support and resistance. Expect early indecision.
Upside trigger → Break and sustain above 26,219.
Targets → 26,272 → 26,330
Downside trigger → Break below 26,122.
Targets → 26,062 → 26,046
The zone 26,175–26,200 is a noise range. Avoid trading inside it.
Two safe setups:
✔️ Breakout & Retest above 26,219
✔️ Breakdown & Retest below 26,122
💡 Educational Tip:
Flat openings give the cleanest structure of the day.
Wait for the breakout from the initial range (first 3–4 candles).
Impulse moves from the flat zone lead to strong trends.
🔻 SCENARIO 3 — GAP-DOWN OPENING (100+ Points)
If Nifty opens around 26,050–26,090, price enters the demand zones.
If support 26,062–26,046 holds and higher-low structure forms →
Reversal upside targets → 26,122 → 26,175 → 26,219
If 26,046 breaks →
Sharp downside possible →
➡️ 26,000 → 25,955 (major support)
This is a crucial liquidity zone.
Only sell BELOW 25,955 with confirmation.
Targets: 25,900 → 25,850
Reversal trades are valid ONLY after a bullish confirmation candle in the support zone.
📘 Educational Note:
Gap-downs into strong support often cause big traps for late sellers.
Wait for price to show exhaustion before buying —
Higher low + strong bullish candle = safest reversal pattern.
💼 RISK MANAGEMENT TIPS FOR OPTION TRADERS 💡
Avoid trading the first 5 minutes after the open.
Use ATM or ITM options for directional trades.
Set SL based on chart level, not premium price.
Never average a losing trade — cut and re-enter if needed.
Trail stop-loss after first target to lock profits.
Weekly expiry days → avoid overtrading during volatility spikes.
High VIX → Prefer spreads over naked buying.
⚠️ Golden Rule:
Be a risk manager first, a trader second.
Capital safety guarantees longevity.
📌 SUMMARY
Bullish Bias Above:
✔️ 26,219 → 26,272 → 26,330 → 26,397
Bearish Bias Below:
✔️ 26,122 → 26,062 → 26,046 → 25,955
Reversal Zones:
🟩 26,107 – 26,122 (Opening Support)
🟩 26,046 – 26,062 (Last Intraday Support)
🟥 26,219 – 26,272 (Heavy Resistance)
Danger / No-Trade Zone:
⚠️ 26,165–26,200 (Choppy, low-quality zone)
🧾 CONCLUSION
Nifty is at a decisive stage where both sides are open.
The day’s trend will be controlled by these key triggers:
✔️ Bullish only above 26,219
✔️ Bearish below 26,122
✔️ Strong breakout only above 26,272
✔️ Major breakdown only below 25,955
Trade with confirmation, respect levels, and avoid emotional entries.
Let market structure guide your trades — not impulses.
⚠️ DISCLAIMER
I am not a SEBI-registered analyst.
This analysis is purely for educational purposes.
Please consult your financial advisor before making trading decisions.
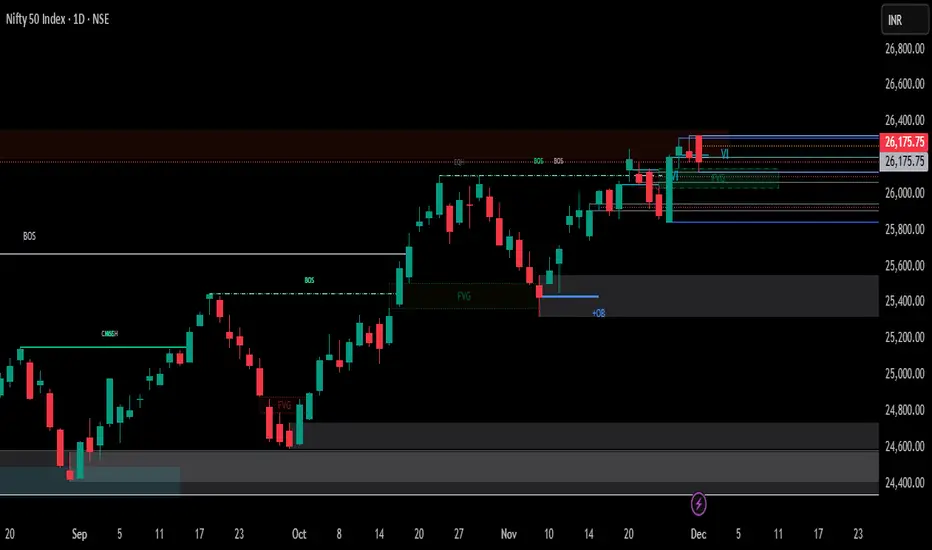
Nifty 50 Analysis (Based on Your 4H+1D Chart ) Key Observations from Your Markups (ICT Style):
1. Price is sitting inside a 4H FVG (26,110–26,170 zone)
This is acting as intraday demand / discount region.
Price bounced here previously and is testing it again.
2. Multiple PDH levels above + Weak High at ~26,320–26,350
This cluster suggests **liquidity resting above.
If price reclaims PDH → expect a sweep toward the weak high.
3. PDL is protected (~26,070–26,090)
Clean liquidity pool below.
A sweep into PDL + FVG confluence gives high-probability long setup.
4. Daily chart shows rejection from the supply zone (26,300–26,380)
But the structure is still **bullish BOS → continuation** unless 25,950 breaks.
---
📌Tomorrow’s Probable Scenarios
🟢 Bullish Setup (Higher Probability)
Entry Zone:
➡️ 26,080–26,120 (PDL + 4H FVG + discount)
Entry Trigger:
W-pattern
BOS on 5m/15m
Stop-run below today’s low
Targets:
1. 26,240
2. 26,310 (PDH)
3. 26,350–26,380 (Weak High / liquidity sweep)
Stoploss:
➡️ Below 25,980 (structure invalidation + 4H FVG break)
---
🔴 Bearish Setup (If 26,300 is rejected again)
Entry Zone:
➡️ 26,300–26,350 (weak high + PDH cluster)
Targets:
1. 26,180
2. 26,110 (FVG midpoint)
3. 25,980 (PDL & liquidity)
Stoploss:
➡️ Above 26,380 (clean invalidation)
NIFTY KEY LEVELS FOR 01.12.2025NIFTY KEY LEVELS FOR 01.12.2025
Timeframe: 3 Minutes
If the candle stays above the pivot point, it is considered a bullish bias; if it remains below, it indicates a bearish bias. Price may reverse near Resistance 1 or Support 1. If it moves further, the next potential reversal zone is near Resistance 2 or Support 2. If these levels are also broken, we can expect the trend.
When a support or resistance level is broken, it often reverses its role; a broken resistance becomes the new support, and a broken support becomes the new resistance.
If the range(R2-S2) is narrow, the market may become volatile or trend strongly. If the range is wide, the market is more likely to remain sideways
please like and share my idea if you find it helpful
📢 Disclaimer
I am not a SEBI-registered financial adviser.
The information, views, and ideas shared here are purely for educational and informational purposes only. They are not intended as investment advice or a recommendation to buy, sell, or hold any financial instruments.
Please consult with your SEBI-registered financial advisor before making any trading or investment decisions.
Trading and investing in the stock market involves risk, and you should do your own research and analysis. You are solely responsible for any decisions made based on this research.
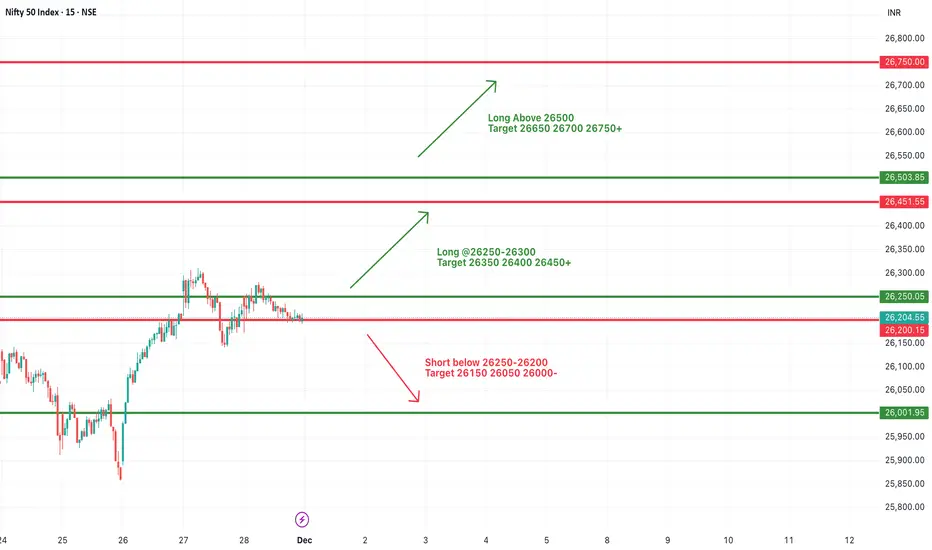
#NIFTY Intraday Support and Resistance Levels - 01/12/2025Nifty is expected to open with a strong gap-up near the 26450 zone, signalling sustained bullish momentum and renewed buying interest at higher levels. This opening zone is significant because it aligns closely with a key resistance area that the index has been attempting to break over the past few sessions. If Nifty manages to sustain above the 26250–26300 support band after the opening surge, it will reinforce bullish strength and keep the long setup active toward 26350, 26400, and back into the 26450 region. A stable price action above 26450 becomes particularly important, as it will indicate that buyers are willing to absorb supply at the upper levels and push the market into the next breakout phase.
A clear breakout above the psychological and technical resistance of 26500 could attract fresh buying momentum, opening the path toward higher targets at 26650, 26700, and even 26750+, especially if global cues support risk-on sentiment. In such a scenario, the market could experience a trend-driven rally with shallow pullbacks and continuous higher supports.
However, traders should also be cautious of any rejection from the 26450–26500 zone. Immediate weakness will only be confirmed if Nifty slips back below the 26250–26200 region, which would activate the short setup with downside targets at 26150, 26050, and 26000-. Such a move would indicate exhaustion of the gap-up momentum and potential profit booking by short-term participants.
Overall, with a gap-up opening near 26450, the broader short-term bias remains decisively positive. Sustaining above key breakout levels throughout the first hour will be crucial for maintaining momentum and validating the expected bullish continuation for the day.
NIFTY : Trading levels and Plan for 01-Dec-2025📊 NIFTY TRADING PLAN — 01 DEC 2025
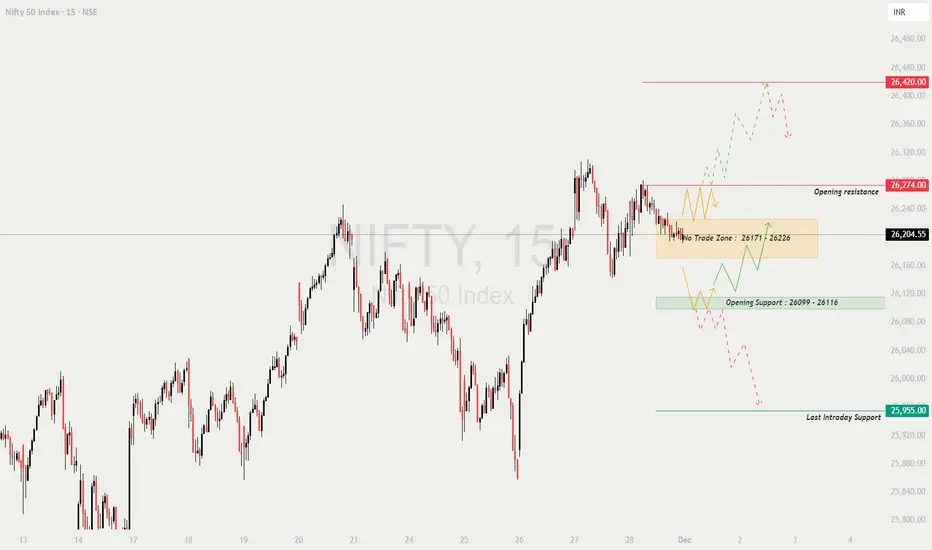
Nifty closed near 26,204, positioned right above the No-Trade Zone (26,171–26,226) and below the Opening Resistance (26,274).
The market is currently compressing inside a value area, meaning the reaction at the opening price will decide the day’s direction.
This session has clean levels for trend continuation and clear reversal zones, so disciplined execution is key.
🔍 Key Intraday Levels
🟧 No Trade Zone: 26,171 – 26,226
🟥 Opening Resistance: 26,274
🟥 Major Resistance: 26,420
🟩 Opening Support Zone: 26,099 – 26,116
🟩 Last Intraday Support: 25,955
🟢 SCENARIO 1 — GAP-UP OPENING (100+ Points)
If Nifty opens around 26,300–26,360, it will open near or above the resistance cluster.
If price sustains above 26,274 for 10–15 mins →
⭐ Upside targets → 26,330 → 26,365 → 26,420 (Major Resistance)
This is the bullish continuation zone.
If price rejects 26,274–26,300, expect a drop toward:
➡️ 26,226 → 26,171
Best long setup →
Breakout above 26,274, followed by retest and a strong green candle.
Avoid shorting immediately in a gap-up — wait for a clean rejection wick.
📘 Educational Note:
Gap-ups near resistance often trap impatient buyers.
Always wait for a retest confirmation rather than buying the first candle.
🟧 SCENARIO 2 — FLAT OPENING (Near 26,180–26,220)
A flat open keeps Nifty inside the No-Trade Zone (26,171–26,226) — expect choppy movement initially.
Only trade after a breakout from the zone:
— Above 26,226 → Trend resumes upward
— Below 26,171 → Downtrend resumes
Breakout above 26,226 →
Targets → 26,260 → 26,274 → 26,330
Breakdown below 26,171 →
Targets → 26,099 → 26,060
Do NOT take trades inside 26,171–26,226.
This zone is deliberately marked as confusing and unreliable.
💡 Educational Tip:
Flat openings are ideal to observe market intent.
The first directional breakout after 15–20 mins usually leads the entire session.
🔻 SCENARIO 3 — GAP-DOWN OPENING (100+ Points)
A gap-down near 26,080–26,120 places price into the Opening Support Zone (26,099–26,116).
If support 26,099–26,116 holds with bullish rejection →
Upside targets → 26,171 → 26,226 → 26,274
If support breaks decisively →
Next downside → 26,020 → 25,955 (Last Intraday Support)
A strong bounce from 25,955 is a potential high-probability reversal zone.
If 25,955 breaks with volume →
Deeper downside → 25,880 → 25,825
📘 Educational Note:
Gap-down into a clean support often produces high-quality reversal trades —
but only once a higher low forms. Never pre-empt the reversal.
💼 RISK MANAGEMENT TIPS FOR OPTION TRADERS 💡
Avoid trading the first 5 minutes — volatility is artificial.
Prefer ATM or ITM options for directional clarity.
SL should be based on chart levels, not premium amount.
Avoid averaging losers — if the structure breaks, exit immediately.
Use partial booking after each breakout target.
When VIX is low → Option buying works well.
When VIX rises → Switch to hedged strategies (spreads).
⚠️ Golden Rule:
Protect your capital. The goal is consistency, not hitting home runs every day.
📌 SUMMARY
Bullish above → 26,226
Targets → 26,260 → 26,274 → 26,330 → 26,420
Bearish below → 26,171
Targets → 26,116 → 26,060 → 25,955
Strong Reversal Zones:
🟩 26,099–26,116 (Opening Support)
🟩 25,955 (Major Support)
🟥 26,274 (Opening Resistance)
🟥 26,420 (Major Supply Zone)
No-Trade Zone:
⚠️ 26,171–26,226
🧾 CONCLUSION
Nifty will take a clear direction only after breaking out of the No-Trade Zone.
Trend clarity will come from:
✔️ A breakout above 26,226
✔️ A rejection from 26,274
✔️ A breakdown below 26,171
✔️ A bullish reversal from 26,099 or 25,955
Wait for confirmation; avoid overtrading in consolidation zones.
⚠️ DISCLAIMER
I am not a SEBI-registered analyst.
This analysis is for educational purposes only.
Always consult a certified financial advisor before trading or investing.
1-Day (Daily) & 4H Chart — What It Says Now🔎 1-Day (Daily) Chart — What It Says Now
📌 Moving Averages Extremely Supportive
All key moving averages — 5, 10, 20, 50, 100, and 200 DMA — continue to trend upward, with price comfortably trading above them.
This alignment reflects:
strong underlying demand
a sustained uptrend
buyers active on dips
Trend structure: Clean, bullish, and stable.
📌 Momentum Indicators Point Upwards
RSI (14) hovering in mid-60s → bullish but not overbought
MACD remains in positive territory, signal line crossover holding
Stochastic %K is elevated → reflects strength and sustained momentum
Overall, momentum is firmly bullish, with no signs of exhaustion yet.
📌 Pivot Levels Active
Price is reacting near key pivot zones, meaning:
Intraday swings may occur
Breakouts or rejections can come quickly
Supports/resistances are likely to be respected
This adds importance to short-term decision zones.
📌 Overall Daily Trend
✔ Strong uptrend
✔ Healthy momentum
✔ Above all major moving averages
✔ Buyers retain dominance
Bottom Line:
Nifty’s daily structure is bullish. Trend remains intact unless key support levels break decisively.
⏳ 4-Hour (4H) Chart — Short-Term Market Behavior
The 4H chart adds more detail to shorter-term moves and shows the internal strength of the ongoing trend.
📌 4H Trend Still Up, but Entering a Decision Zone
Price action shows:
Higher lows
Higher highs
Strong support clusters on dips
Sellers showing mild presence near upper resistances
This timeframe suggests mild consolidation within a bullish structure.
📌 4H Indicators
RSI mildly elevated
MACD flattening slightly as price approaches resistance
Price compression possible before a breakout
This hints at short-term stabilization — a pause rather than reversal.
📈 4-Point Broader Chart / Market Outlook (Short → Medium Term)
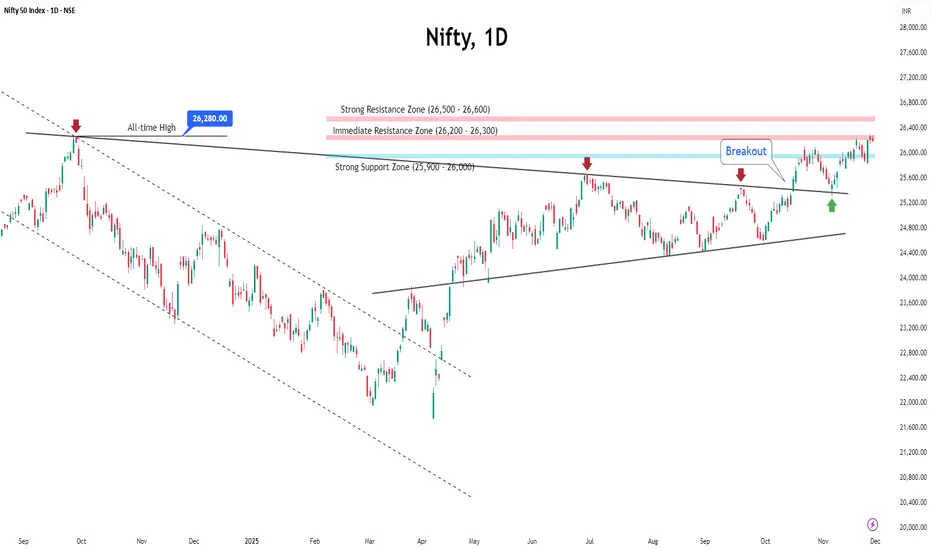
1️⃣ Near-Term Upside Target / Resistance Zone
Key resistance seen at 26,440 – 26,800.
This is the zone to watch for:
Breakout → fresh rally
Rejection → consolidation or dip
A decisive close above this range may open the gate for new highs.
2️⃣ Key Support Levels to Track
Immediate support: 26,100 – 26,200
If this breaks, deeper supports lie near previous consolidation levels.
As long as Nifty holds above these, the structure remains bullish.
3️⃣ Volatility & Consolidation Risk
Despite bullish trend, momentum is steady, not euphoric:
ADX not extremely strong → trend is healthy but not overheated
Possible sideways movement
Integrated consolidation before next leg
Ideal for range trading until breakout clarity emerges.
4️⃣ Sectoral & Breadth Context
Even though headline Nifty is strong:
Media, Realty, IT have underperformed
Breadth is not fully aligned with index strength
Heavyweight stocks driving the rally
Sector rotation may be key for medium-term sustainability.
🎯 Key Scenarios Going Forward
📌 1. Bullish Continuation (High Probability)
If Nifty holds 26,100–26,200 and breaks 26,440–26,800 →
Upside expansion likely, trend remains intact.
📌 2. Range / Consolidation (Likely Before Breakout)
Mixed breadth + moderate volatility suggests
Brief sideways movement before decisive direction.
📌 3. Pullback / Correction (Risk Trigger)
If supports break along with sectoral weakness →
Nifty may test lower supports with increased volatility.
💼 What This Means for Traders & Investors
For Traders
Bullish bias is intact
Prefer trades on breakouts or support bounces
Avoid premature entries near resistance
Manage risk due to short-term consolidation risk
For Medium-Term Investors
Trend is not showing signs of topping
Continue exposure but track sectoral leadership
Focus on stock-specific strength rather than index alone
Risk Management
Avoid over-leveraging as volatility pockets may emerge
Respect support levels
Watch the 26,440–26,800 zone for next directional cue
📌 Final Combined View (1D + 4H)
Nifty remains in a strong, well-supported uptrend across both timeframes.
Daily chart shows broad strength → 4H chart shows controlled consolidation.
Market is setting up for a potential breakout, though short-term range-bound action is likely until price crosses key levels.

NIFTY Hits New Highs but Breadth Weakens — What’s the Signal?The NIFTY 50 closed the week with a neat gain of 134.80 points (0.52%), touching fresh lifetime highs of 26,310.45.
Sounds impressive, right?
Yes — but there’s a twist.
A deeper look shows the Nifty 500 is still over 2.5% below its all-time high.
Meaning? This rally is not broad-based — it’s being carried by select large-cap heavyweights.
Meanwhile, the India VIX dropped 14.77% to 11.62, keeping volatility calm… for now.
◉ Key Levels to Watch This Week
Support Zones
● 26,000 — Strong and immediate support. Heavy put writing is visible here.
Resistance Zones
● 26,200 – 26,300 — Near-term supply zone
● 26,500 — Major resistance to beat
◉ Key Triggers This Week
1. RBI Policy – December 5
A 25 bps rate cut is widely expected, but the RBI may take a cautious approach as it balances low inflation with rising growth momentum.
2. Q2 GDP at 8.2%
The stronger-than-expected GDP print boosts sentiment but reduces the urgency for aggressive rate cuts, shifting the policy outlook toward a more measured stance.
3. India–US Trade Deal
Both countries are close to finalizing the agreement by year-end, which could support IT, manufacturing and export-focused sectors.
4. Rupee Weakness
The rupee’s slide to ₹89.49/$ raises import costs and potential inflation risks, adding pressure on the RBI while impacting corporate margins differently across sectors.
◉ December Outlook — What’s Likely Ahead?
● Base Case: NIFTY stays in a 26,000–26,500 range, with most upside already priced in.
● Bull Case: A breakout above 26,500 could send it toward 26,700 by month-end.
● Caution: If market breadth weakens further, volatility may creep back in.
◉ Strategy:
● As long as NIFTY holds above 26,000, sentiment stays positive.
● Dips above 26,000 = buying opportunity
● Avoid chasing breakouts blindly — focus on quality sectors and high-volume confirmations.
NIFTY KEY LEVELS FOR 28.11.2025NIFTY KEY LEVELS FOR 28.11.2025
Timeframe: 3 Minutes
If the candle stays above the pivot point, it is considered a bullish bias; if it remains below, it indicates a bearish bias. Price may reverse near Resistance 1 or Support 1. If it moves further, the next potential reversal zone is near Resistance 2 or Support 2. If these levels are also broken, we can expect the trend.
When a support or resistance level is broken, it often reverses its role; a broken resistance becomes the new support, and a broken support becomes the new resistance.
If the range(R2-S2) is narrow, the market may become volatile or trend strongly. If the range is wide, the market is more likely to remain sideways
please like and share my idea if you find it helpful
📢 Disclaimer
I am not a SEBI-registered financial adviser.
The information, views, and ideas shared here are purely for educational and informational purposes only. They are not intended as investment advice or a recommendation to buy, sell, or hold any financial instruments.
Please consult with your SEBI-registered financial advisor before making any trading or investment decisions.
Trading and investing in the stock market involves risk, and you should do your own research and analysis. You are solely responsible for any decisions made based on this research.

Daily Analysis: Nifty 28/11/25Targets on either side for Nifty based on the breakout of support and resistance levels as mentioned.

NIFTY : Trading levels and Plan for 28-Nov-2025📊 NIFTY TRADING PLAN — 28 NOV 2025
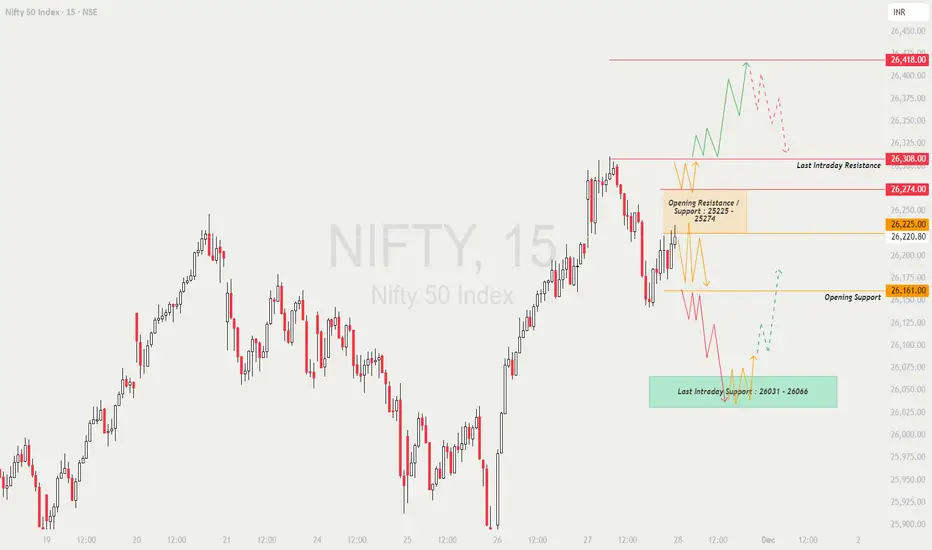
Nifty closed around 26,220, after bouncing strongly from lower levels and now sitting just below an important Opening Resistance / Support Zone (26,225–26,274).
The market is positioned between major overhead resistance and key intraday support.
This increases the importance of the opening direction.
Key Intraday Levels
🟧 Opening Resistance / Support Zone: 26,225 – 26,274
🟥 Last Intraday Resistance: 26,308
🟥 Profit Booking Zone: 26,418
🟩 Opening Support: 26,161
🟩 Last Intraday Support: 26,031 – 26,066
🟢 SCENARIO 1 — GAP-UP OPENING (100+ Points)
If Nifty opens around 26,300–26,350, it directly enters the resistance territory.
If price sustains ABOVE 26,308 for 10–15 minutes →
⭐ Expect bullish continuation toward → 26,360 → 26,395 → 26,418
If Nifty rejects 26,308 with sharp wicks →
Expect pullback toward → 26,274 → 26,225
Avoid long entries immediately at open — gap-ups near resistance can cause bull traps.
Best long setup = Breakout → Retest above 26,308 → Continuation.
📘 Educational Note:
Resistance-based gap-ups often create volatility. Always wait for confirmation candles, not emotional entries.
🟧 SCENARIO 2 — FLAT OPENING (26,200–26,250 Range)
A flat open places Nifty inside or just below the Opening Resistance / Support Zone.
A breakout above 26,274 →
Targets → 26,308 → 26,360 → 26,418
Failure to sustain above the zone may drag price back to 26,161.
Inside the 26,225–26,274 zone →
No high-probability trade. Avoid jumping into noise.
Best trades:
✔️ Breakout retest above 26,274
✔️ Breakdown below 26,161
✔️ Long from Last Intraday Support 26,031–26,066 (strong bounce zone)
💡 Educational Tip:
Flat openings provide the most reliable trend insight through the first 15-min candle. Let price choose direction — don’t force trades.
🔻 SCENARIO 3 — GAP-DOWN OPENING (100+ Points)
A gap-down around 26,080–26,120 brings Nifty near the Opening Support (26,161) area.
If price rejects 26,161 with bullish wick →
Reversal targets → 26,200 → 26,225 → 26,274
If price breaks 26,161 decisively →
Price will slide quickly toward the big support → 26,031–26,066
A strong bounce at 26,031–26,066 offers an attractive long opportunity.
If 26,031 breaks with momentum →
Expect downside extension → 25,980 → 25,940
📘 Educational Note:
Gap-downs into support often give excellent reversal trades — but NEVER without confirmation.
Watch for higher lows or bullish engulfing candles.
💼 RISK MANAGEMENT TIPS FOR OPTION TRADERS 💡
Avoid the first 5 minutes — large gap openings often reverse quickly.
Use ATM or ITM options for directional momentum.
NEVER average a losing option trade.
Use fixed SL based on structure, not on premium.
When VIX is low → prefer option buying.
When VIX is high → hedged option selling is safer.
Book partial profits near resistance zones like 26,308 & 26,418.
⚠️ Golden Rule:
Protect your capital first — good opportunities always come after clarity.
📌 SUMMARY
Bullish Above → 26,274
Targets → 26,308 → 26,360 → 26,418
Bearish Below → 26,161
Targets → 26,120 → 26,066 → 26,031 → 25,980
High-Risk Zones:
🟧 26,225–26,274 (Opening whipsaw zone)
🟥 26,308–26,418 (Profit booking region)
🧾 CONCLUSION
Nifty is approaching a strong overhead resistance zone, and the opening candle will decide whether we get a breakout continuation or a pullback day.
The highest-probability trades will come from:
✔️ Breakout retest above 26,274
✔️ Rejection / reversal at 26,308
✔️ Bounce from 26,031–26,066
✔️ Breakdown below 26,161 for momentum shorts
Trade only clean structures — avoid noise inside the middle consolidation zone.
⚠️ DISCLAIMER
I am not a SEBI-registered analyst.
This analysis is meant only for educational purposes.
Please consult a certified financial advisor before trading or investing.
NIFTY KEY LEVELS FOR 27.11.2025NIFTY KEY LEVELS FOR 27.11.2025
Timeframe: 3 Minutes
If the candle stays above the pivot point, it is considered a bullish bias; if it remains below, it indicates a bearish bias. Price may reverse near Resistance 1 or Support 1. If it moves further, the next potential reversal zone is near Resistance 2 or Support 2. If these levels are also broken, we can expect the trend.
When a support or resistance level is broken, it often reverses its role; a broken resistance becomes the new support, and a broken support becomes the new resistance.
If the range(R2-S2) is narrow, the market may become volatile or trend strongly. If the range is wide, the market is more likely to remain sideways
please like and share my idea if you find it helpful
📢 Disclaimer
I am not a SEBI-registered financial adviser.
The information, views, and ideas shared here are purely for educational and informational purposes only. They are not intended as investment advice or a recommendation to buy, sell, or hold any financial instruments.
Please consult with your SEBI-registered financial advisor before making any trading or investment decisions.
Trading and investing in the stock market involves risk, and you should do your own research and analysis. You are solely responsible for any decisions made based on this research.

NIFTY : Trading levels and Plan for 27-Nov-2025📊 NIFTY TRADING PLAN — 27 NOV 2025
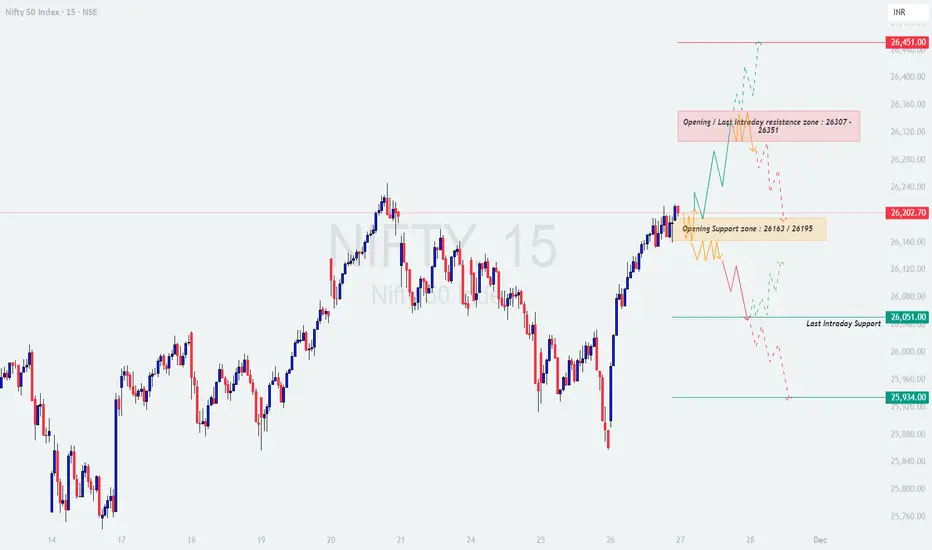
Nifty closed around 26,202, sitting right under the Opening / Intraday Resistance Zone (26,307–26,351) and above the Opening Support Zone (26,163–26,195).
Market structure is slightly bullish but still inside a supply region, meaning the opening reaction will decide trend strength.
Key Level Zones to Track:
🟥 Opening / Last Intraday Resistance Zone: 26,307 – 26,351
🟥 Major Resistance: 26,451
🟧 Opening Support Zone: 26,163 – 26,195
🟩 Last Intraday Support: 26,051
🟩 Major Downside Support: 25,934
🟢 SCENARIO 1 — GAP-UP OPENING (100+ Points)
If Nifty opens around 26,300–26,360, price immediately enters the opening/intraday resistance zone.
If price sustains above 26,351 for 10–15 minutes →
⭐ Upside targets → 26,395 → 26,420 → 26,451
If price rejects the 26,307–26,351 zone →
Expect a correction toward 26,250 → 26,195
A bullish retest above 26,307 can offer a continuation long opportunity.
Avoid chasing long directly on gap-up — opening candles at resistance often trap buyers.
📘 Educational Note:
Gap-ups near a major supply zone require confirmation. Look for higher low formation or strong bullish candle closing above resistance before entering.
🟧 SCENARIO 2 — FLAT OPENING (Near 26,170–26,210)
A flat open puts Nifty inside the Opening Support Zone (26,163–26,195) — a decision-making region.
Breakout above 26,210 →
Targets → 26,260 → 26,307 → 26,351
Breakdown below 26,163 →
Targets → 26,120 → 26,080 → 26,051
Avoid trading inside the 26,163–26,210 range until a clear breakout forms.
Best trades:
✔️ Breakout → Retest → Continuation
✔️ Support bounce from 26,163
💡 Educational Tip:
Flat openings usually define trend early. The first 15-minute candle often gives directional bias — don’t rush into the chop.
🔻 SCENARIO 3 — GAP-DOWN OPENING (100+ Points)
A gap-down below 26,120 brings price directly toward 26,051 (last intraday support).
If 26,051 holds with strong wick rejections →
Upside targets → 26,100 → 26,163 → 26,195
If price breaks 26,051 decisively →
Next downside zone → 25,980 → 25,934
A bounce from 25,934 can give a powerful reversal trade — but only after confirmation.
If price stays below 26,051, expect trend-day weakness and follow-through selling.
📘 Educational Note:
Gaps into strong support zones often create high-quality reversal opportunities, but ONLY after confirmation through candle structure + volume.
💼 RISK MANAGEMENT TIPS FOR OPTION TRADERS 💡
Avoid trading immediately at market open, especially during gaps.
Use ITM options for directional trades to reduce theta decay.
Follow strict SL based on structure — never widen stop losses.
Do NOT average losing trades.
If VIX is low → option buying works better.
If VIX is high → use spreads or hedged selling.
Book partial profits at levels to protect gains.
Focus on quality setups, not quantity.
⚠️ Golden Rule:
Your job is not to win every trade — your job is to protect capital and stay consistent.
📌 SUMMARY
Bullish above → 26,210
Targets → 26,260 → 26,307 → 26,351 → 26,451
Bearish below → 26,163
Targets → 26,120 → 26,080 → 26,051 → 25,934
Avoid Zones:
— 26,163–26,195 (Indecision zone)
— 26,307–26,351 (High resistance; risky for longs)
🧾 CONCLUSION
Nifty is at a crucial turning point between support at 26,163 and resistance at 26,307.
The directional trend for the day will come from:
✔️ Breakout & retest above 26,210
✔️ Reversal from 26,051
✔️ Momentum short below 26,163
Avoid trades inside choppy mid-zones and wait for the market to reveal direction.
⚠️ DISCLAIMER
I am not a SEBI-registered analyst.
This analysis is for educational purposes only.
Please consult a certified financial advisor before trading or investing.
NIFTY KEY LEVELS FOR 26.11.2025NIFTY KEY LEVELS FOR 26.11.2025
Timeframe: 3 Minutes
If the candle stays above the pivot point, it is considered a bullish bias; if it remains below, it indicates a bearish bias. Price may reverse near Resistance 1 or Support 1. If it moves further, the next potential reversal zone is near Resistance 2 or Support 2. If these levels are also broken, we can expect the trend.
When a support or resistance level is broken, it often reverses its role; a broken resistance becomes the new support, and a broken support becomes the new resistance.
If the range(R2-S2) is narrow, the market may become volatile or trend strongly. If the range is wide, the market is more likely to remain sideways
please like and share my idea if you find it helpful
📢 Disclaimer
I am not a SEBI-registered financial adviser.
The information, views, and ideas shared here are purely for educational and informational purposes only. They are not intended as investment advice or a recommendation to buy, sell, or hold any financial instruments.
Please consult with your SEBI-registered financial advisor before making any trading or investment decisions.
Trading and investing in the stock market involves risk, and you should do your own research and analysis. You are solely responsible for any decisions made based on this research.

NIFTY : Trading levels and Plan for 26-Nov-2025📊 NIFTY TRADING PLAN — 26 NOV 2025
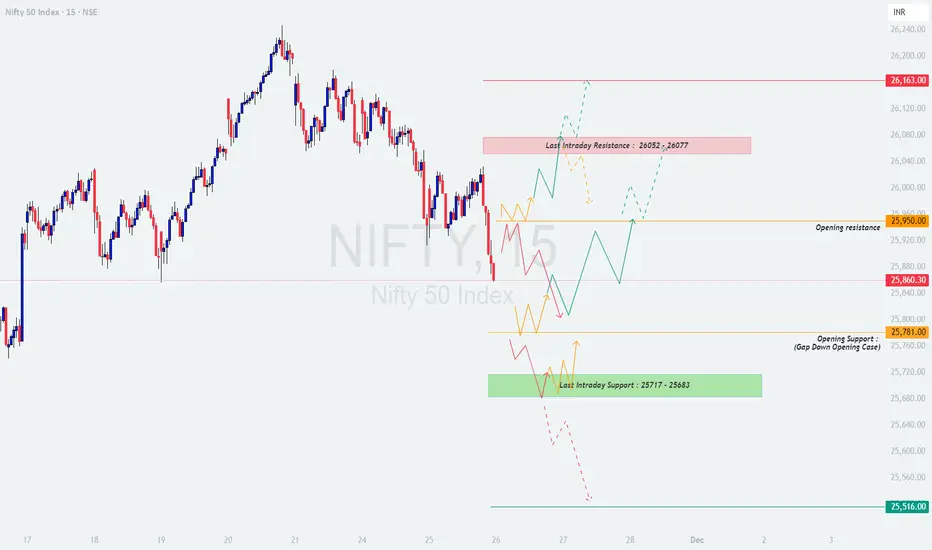
Current price sits around 25,860, right below the Opening Resistance (25,950) and just above the Opening Support (Gap-down case): 25,781.
The broader structure is weak, but Nifty is approaching a strong support zone around 25,717–25,683, which may trigger sharp intraday reversals.
Key Zones to Track:
🟥 Last Intraday Resistance: 26,052 – 26,077
🟥 Major Resistance: 26,163
🟧 Opening Resistance: 25,950
🟩 Opening Support (Gap-down case): 25,781
🟩 Last Intraday Support: 25,717 – 25,683
🟩 Major Support: 25,516
🟢 SCENARIO 1 — GAP-UP OPENING (100+ Points)
If Nifty opens around 25,960–26,050, price immediately enters the sellers’ zone near the Opening Resistance or slightly below the Last Intraday Resistance.
If price sustains above 26,052 for 10–15 minutes →
⭐ Upside targets: 26,077 → 26,120 → 26,163
If price rejects 26,052–26,077 zone →
Expect intraday pullback to 25,950 → 25,900 → 25,860
A bullish retest above 25,950 can give a continuation long opportunity.
Avoid aggressive longs at open — gap-ups into resistance often produce whipsaws.
📘 Educational Insight:
Gap-ups near resistance are continuation traps. Always wait for confirmation (higher low or strong candle close) before entering.
🟧 SCENARIO 2 — FLAT OPENING (Near 25,840–25,900)
A flat open places Nifty right inside the neutral compression zone, making direction unclear during the first 15 minutes.
Breakout above 25,950 →
Targets → 26,020 → 26,052 → 26,077
Breakdown below 25,840 →
Targets → 25,781 → 25,750
Avoid trading INSIDE 25,840–25,900 until price gives clear breakout/retest structure.
Best Opportunities:
— Breakout above 25,950 (retest entry)
— Breakdown below 25,840 (momentum entry)
💡 Educational Tip:
Flat opens help identify the day’s trend. The first clear breakout of the range usually decides the move for the next 1–2 hours.
🔻 SCENARIO 3 — GAP-DOWN OPENING (100+ Points)
A gap-down below 25,780 takes price directly into the Opening Support Zone and close to the Last Intraday Support (25,717–25,683).
If price holds 25,717–25,683 with strong wick rejections →
Upside targets: 25,781 → 25,840 → 25,900
If price fails to hold 25,683, next major support is:
➡️ 25,516
A bounce from 25,516 can provide a high-quality reversal long, but only after bullish confirmation.
If momentum remains bearish below 25,683, expect trend-day downside continuation.
📘 Educational Insight:
Gap-downs into major support often create the strongest reversal trades — but only after confirmation through volume + structure. Never jump early.
💼 RISK MANAGEMENT TIPS FOR OPTION TRADERS 💡
Avoid trading the first 5–10 minutes, especially on big gap opens.
Use ITM strikes for directional trades to reduce theta decay.
Always keep a fixed stop loss — do NOT widen SL after entry.
Avoid averaging losers (it damages your risk-reward and psychology).
Low VIX → good for option buying.
High VIX → prefer spreads or hedged selling.
Book partial profits at key swing levels; protect your capital.
⚠️ Golden Rule:
Your goal is not to catch every move — your goal is to stay in the game.
📌 SUMMARY
Bullish above → 25,950
Targets → 26,020 → 26,052 → 26,077 → 26,163
Bearish below → 25,840
Targets → 25,781 → 25,717 → 25,683 → 25,516
High-Risk Zones (Avoid Trading):
— 25,840–25,900 (choppy zone)
— 26,052–26,077 (strong supply; rejection possible)
🧾 CONCLUSION
Nifty is approaching a crucial support-resistance flip region. The reaction at 25,950 and 25,717 will decide the day’s trend.
The cleanest trades will come from:
✔️ Breakout & retest above 25,950
✔️ Reversal from 25,717–25,683 support
✔️ Momentum short below 25,840
Avoid trading the first volatile swings — let the direction develop clearly.
⚠️ DISCLAIMER
I am not a SEBI-registered analyst.
This analysis is strictly for educational purposes.
Please consult a certified financial advisor before taking any trading or investment decisions.
NIFTY KEY LEVELS FOR 25.11.2025NIFTY KEY LEVELS FOR 25.11.2025
Timeframe: 3 Minutes
If the candle stays above the pivot point, it is considered a bullish bias; if it remains below, it indicates a bearish bias. Price may reverse near Resistance 1 or Support 1. If it moves further, the next potential reversal zone is near Resistance 2 or Support 2. If these levels are also broken, we can expect the trend.
When a support or resistance level is broken, it often reverses its role; a broken resistance becomes the new support, and a broken support becomes the new resistance.
If the range(R2-S2) is narrow, the market may become volatile or trend strongly. If the range is wide, the market is more likely to remain sideways
please like and share my idea if you find it helpful
📢 Disclaimer
I am not a SEBI-registered financial adviser.
The information, views, and ideas shared here are purely for educational and informational purposes only. They are not intended as investment advice or a recommendation to buy, sell, or hold any financial instruments.
Please consult with your SEBI-registered financial advisor before making any trading or investment decisions.
Trading and investing in the stock market involves risk, and you should do your own research and analysis. You are solely responsible for any decisions made based on this research.

#NIFTY Intraday Support and Resistance Levels - 25/11/2025Nifty is expected to open flat today, indicating a neutral start with no clear directional bias in the early session. If the index sustains above the 26050–26100 zone, it will activate the long setup with upside targets of 26150, 26200, and 26250+. A decisive move above this range may help Nifty recover back toward the higher resistance levels.
On the downside, weakness will confirm only if Nifty breaks below 25950, which will trigger the short setup with targets at 25850, 25800, and 25750-. Since the market is opening flat, initial movement may stay within the consolidation zone, and a breakout from these key levels will determine the trend for the day.

NIFTY : Trading levels and Plan for 25-Nov-2025📊 NIFTY TRADING PLAN — 25 NOV 2025
(Reference: 15-min structure & intraday reaction zones)
Nifty closed near 25,943, slipping into the Opening Support Zone (25,931–25,950) after a sharp late-day decline. The structure has shifted into a short-term bearish bias, but the first 15–20 minutes of the session will decide whether a reversal or continuation unfolds.
🔑 Key Levels to Track
🟥 Opening Resistance (Gap-up Case): 26,050 – 26,079
🟥 Last Intraday Resistance: 26,175
🟥 Major Upside Level: 26,307
🟧 Opening Support: 25,931 – 25,950
🟩 Last Intraday Support: 25,750 – 25,807
🟩 Major Downside Support: 25,516
🟢 SCENARIO 1 — GAP-UP OPENING (100+ Points)
If Nifty opens around 26,050+, price immediately enters the Opening Resistance Zone (26,050 – 26,079), a zone known for trapping early buyers.
If price sustains above 26,079 for 15–20 minutes →
📈 Targets: 26,120 → 26,175 → 26,225 → 26,307
If price rejects 26,079, expect pullback toward:
➡️ 26,020 → 25,970 → 25,950
The safest long trade is a retest–reclaim of 26,050 after rejection wicks.
Avoid aggressive buying directly at the open — resistance gaps often fade.
📘 Educational Note:
Gap-ups into resistance require confirmation via higher lows. A flat or weak breakout candle usually signals exhaustion, not strength.
🟧 SCENARIO 2 — FLAT OPENING (Around 25,930–25,960)
A flat open keeps Nifty inside the Opening Support Zone (25,931–25,950) — a decision-making region.
Breakout above 25,970 →
Targets: 26,020 → 26,050 → 26,079
Failure to hold 25,931 →
Decline toward 25,807 → 25,750
Avoid trading inside the 25,930–25,970 region until direction is clear.
Best trades:
✔️ Breakout–retest above 25,970
✔️ Support bounce at 25,807–25,750
💡 Educational Tip:
Flat openings reveal trend direction quickly — wait for the first candle to close before acting.
🔻 SCENARIO 3 — GAP-DOWN OPENING (100+ Points)
A gap-down below 25,880 pushes price rapidly toward the Last Intraday Support Zone (25,750 – 25,807).
If 25,807–25,750 holds with bullish wicks →
📈 Reversal targets: 25,900 → 25,950 → 26,020
If 25,750 breaks →
Next downside targets: 25,640 → 25,580 → 25,516
A sharp bounce from 25,516 provides a low-risk reversal trade setup.
Avoid picking bottoms blindly — wait for structure (HH/HL) to form.
📘 Educational Note:
Gap-downs into strong support often offer the best risk-to-reward if reversal signs appear — but only after confirmation.
💼 RISK MANAGEMENT TIPS FOR OPTIONS TRADERS 💡
Avoid trading during first 5–10 minutes after open.
Prefer ATM or ITM options for directional momentum.
Never widen your stop-loss under emotional pressure.
Avoid averaging losers — compound losses destroy accounts.
When VIX is low → option buying works better.
When VIX is high → use spreads or hedged selling.
Book partial profits to secure gains during volatility.
⚠️ Golden Rule:
Focus on capital preservation first — opportunities come daily, capital does not.
📌 SUMMARY
🔼 Bullish Above → 26,020 / 26,079
Targets: 26,120 → 26,175 → 26,225 → 26,307
🔽 Bearish Below → 25,931 / 25,807
Targets: 25,750 → 25,640 → 25,580 → 25,516
🚫 No-Trade Zone
25,930 – 25,970 (Flat opening zone — high noise, low clarity)
🧾 CONCLUSION
Nifty is approaching a high-volatility reversal area with both upside and downside swings possible. The reaction to the 25,931 support and 26,050 resistance will decide the trend for the day.
The most reliable trades will come from:
✔️ Breakout–retest above 26,020/26,079
✔️ Reversal confirmation at 25,807–25,750
✔️ Continuation trades after breakdown below 25,750
Patience and discipline are essential — avoid chasing.
⚠️ DISCLAIMER
I am not a SEBI-registered analyst.
This analysis is for educational purposes only.
Please consult a certified financial advisor before trading or investing.

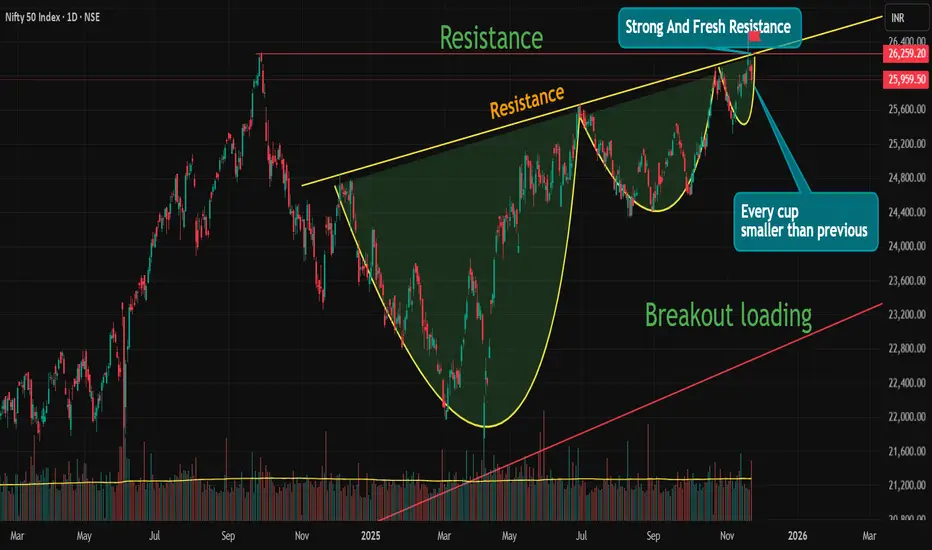
Something is cooking big than patternNSE:NIFTY
Nifty make continuously cup pattern smaller than previous cup . this is good sign for uptrend. but here also some negative points like all time resistance, negative pattern at all time resistance also another trend line resistance. global uncertainty here is big role. these are negative point.
you think i make confusion right but only half.
every analysis has two side
1. if analysis will right than we are ready for plan of action.
2. if analysis will wrong than we also ready for plan of action.
So, be prepared for both side.
Here is another 3 side if nifty make another cup 😅
hahahhaha