Nifty Looks ChoppyThough Nifty is reacting from a big timeframe’s demand area, on smaller timeframe things are very choppy and confusing.
However, this looks good. We have taken out most recent liquidity sweep, but enough demand comes, we can see a reversal.
Niftylong

Nifty RallyNifty Rally Start Weekly Chart,
Elliot Wave 1,2 Complete,
Elliot Wave 3 Continue ,
Elliot Wave 4,5 Pending
Monthly View
Monthly Chart RSI Divergence,
Continue Market Over Value,
Monthly Chart Some Time Then Heavy Selling

Nifty 50 Swing Trading setup - RRR 1:3Nifty swing trading setup analysis through Elliott wave Downside risk max 200 points target 600 point reaching possible on before 02/01/2026 maximum hold 2 weeks this setup useful for swing traders so go long at 25900-25800 Risk reward is good 1:3 Happy trading Journey

Nifty Bullish Confluence Set up ( Swing+ positional)Hello,
Nifty spot 24610 from low of 21780 made high around 25650 april to june in 2 months now Its retrace to 24600 i.e almost more than 50% retracement another is RSI squezze with bullish divergence in lowertimeframe with EMA 200 support and making pattern of falling wedge .
expecting bullish reversal set up for new lifetime high possibilties in next 2 months
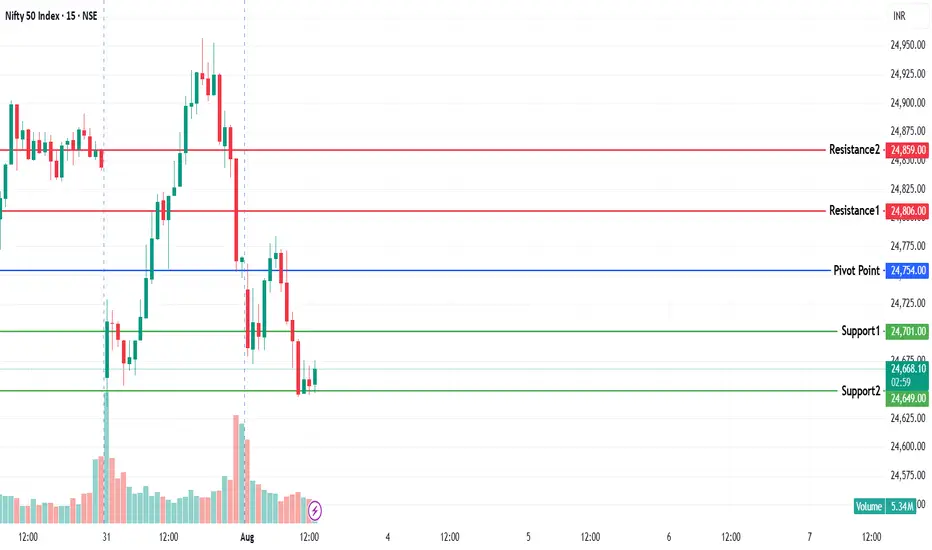
NIFTY KEY LEVELS FOR 01.08.2025NIFTY KEY LEVELS FOR 01.08.2025
If the candle stays above the pivot point, it is considered a bullish bias; if it remains below, it indicates a bearish bias. Price may reverse near Resistance 1 or Support 1. If it moves further, the next potential reversal zone is near Resistance 2 or Support 2. If these levels are also broken, we can expect the trend.
If the range(R2-S2) is narrow, the market may become volatile or trend strongly. If the range is wide, the market is more likely to remain sideways
📢 Disclaimer
I am not a SEBI-registered financial adviser.
The information, views, and ideas shared here are purely for educational and informational purposes only. They are not intended as investment advice or a recommendation to buy, sell, or hold any financial instruments.
Please consult with your SEBI-registered financial advisor before making any trading or investment decisions.
Trading and investing in the stock market involves risk, and you should do your own research and analysis. You are solely responsible for any decisions made based on this research.
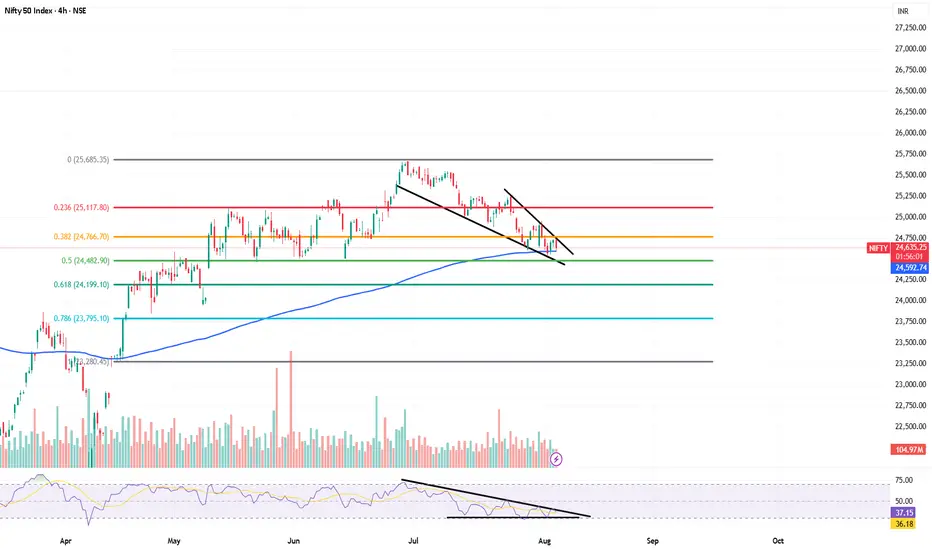
Regression channel breakout - Short term Shift1. Price is out of regression channel — signaling short-term weakness.
2. POC around 24,750 — That is most traded level.
Option Chain Data:
Call writing at 25,300 & 25,500 — clear resistance
But
Yesterday we got positive earnings of ICICI & HDFC Bank.
There is a expectation of pullback as long as nifty is above 24450, long term view is positive
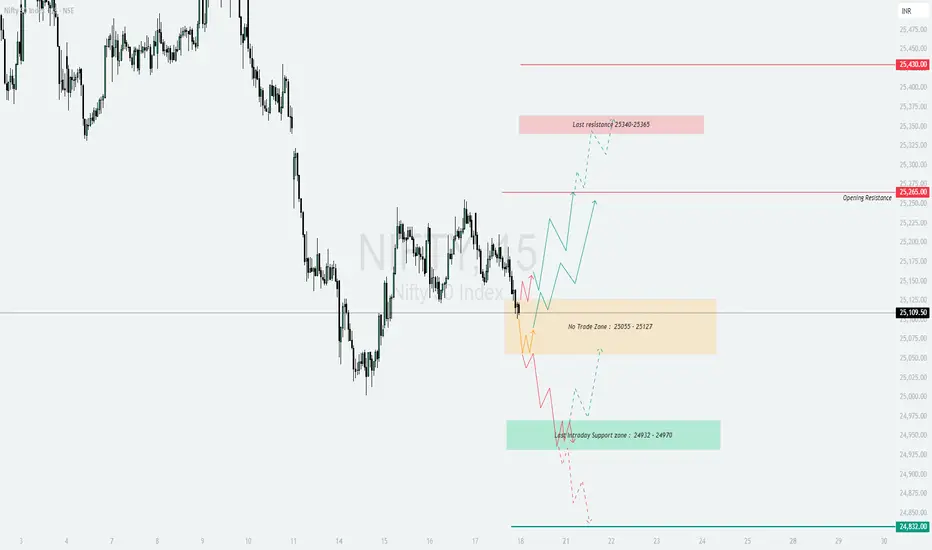
NIFTY - Trading levels and plan for 18-July-2025📊 NIFTY INTRADAY TRADING PLAN – 18-Jul-2025
Gap Opening Consideration: 100+ points from previous close
📍 KEY LEVELS TO MONITOR
🟥 Last Resistance: 25,340 – 25,365
🟥 Major Resistance: 25,430
🟧 Opening Resistance: 25,265
🟨 No Trade Zone: 25,055 – 25,127
🟩 Last Intraday Support Zone: 24,932 – 24,970
🟢 Major Support: 24,832
🚀 SCENARIO 1: GAP-UP OPENING (Above 25,365) 📈
(Gap-up considered as 100+ points above previous close)
If Nifty opens above 25,365 , it indicates bullish strength. Wait for a pullback near 25,340–25,365 for potential long entries.
If price sustains, expect a possible rally toward 25,430+ , which is the next resistance zone.
Avoid chasing entries; use 15–30 min candle confirmation to avoid false breakouts.
Options Strategy: Focus on ATM or slightly OTM Call Options or try a Bull Call Spread for limited risk.
⚖️ SCENARIO 2: FLAT OPENING (Between 25,055 – 25,127) 🟠
(Flat range aligns with the No Trade Zone )
This is a tricky zone with indecision between bulls and bears. Avoid initiating any trade immediately.
If Nifty breaks and sustains above 25,127 , bullish bias may emerge toward 25,265 – 25,340 .
On breakdown below 25,055 , a short trade setup opens targeting 24,932 – 24,970 zone .
Wait for clear hourly close before taking action in either direction.
Options Strategy: Consider Strangle or Iron Fly strategies for range-based volatility exploitation.
📉 SCENARIO 3: GAP-DOWN OPENING (Below 24,932) 🚨
(Gap-down considered below previous close by 100+ points)
If Nifty opens below 24,932 , monitor price action near the 24,832 major support .
If the support fails and prices break down below 24,832 , expect further downside pressure.
However, if price finds buying interest at 24,832 and bounces, you may consider scalping long with tight stop loss.
Options Strategy: Deploy ATM or ITM Put Options or Bear Put Spreads to play downside with defined risk.
💡 RISK MANAGEMENT & OPTIONS TRADING TIPS
🛑 Never risk more than 1–2% of your capital on any single trade.
⏳ Avoid entering trades during the first 15–30 minutes ; let volatility settle.
📉 Use Hourly candle close to determine validity of breakouts/breakdowns.
⚖️ Prefer spread strategies like Bull Call or Bear Put to cap your risk.
🧠 Avoid revenge trading after losses—stick to your trading plan.
📌 SUMMARY & CONCLUSION
Bullish View: Above 25,365, look for long opportunities up to 25,430 with stop-loss below 25,340.
Range-Bound View: Between 25,055–25,127 (No Trade Zone) – wait for breakout/breakdown confirmation.
Bearish View: Below 24,932 – focus on support at 24,832; breach can accelerate fall.
Action Plan: Wait for price behavior near key levels before committing capital.
⚠️ DISCLAIMER: I am not a SEBI-registered analyst. This analysis is for educational and informational purposes only. Please consult your financial advisor before taking any trade or investment decisions.
NIFTY : Trading plan for 16-Jul-2025📊 NIFTY 50 INTRADAY TRADING PLAN – 16-Jul-2025
Strategy prepared with 15-Min chart observation. Gap openings 100+ points considered significant for intraday volatility.
📍 IMPORTANT LEVELS TO WATCH
🟥 Opening / Last Intraday Resistance: 25,340
🟧 Opening Resistance / Support Zone: 25,225
🟧 Opening Support: 25,132 – 25,150
🟩 Last Intraday Support: 25,053
🟩 Buyer’s Support Zone: 24,950 – 24,981
🟥 Profit Booking Zone: 25,408 – 25,430
🚀 SCENARIO 1: GAP-UP OPENING (Above 25,340) 📈
If NIFTY opens above 25,340 , it indicates a strong bullish sentiment. However, watch for immediate profit booking around the Profit Booking Zone 25,408 – 25,430 .
Do not rush into trades immediately. Wait for a 15-minute candle close above 25,340 to confirm continuation.
If it fails to hold 25,340, there can be a quick dip toward 25,225 again.
Options Tip: Prefer ATM or Slightly ITM CE for momentum continuation. Avoid far OTM options due to theta risk on gap-up days.
📊 SCENARIO 2: FLAT OPENING (Between 25,132 – 25,225) 🔄
A flat opening suggests an indecisive mood. Watch how prices behave around Opening Resistance 25,225 and Opening Support 25,132 – 25,150 .
If price sustains above 25,225 with good volume, expect a bullish move toward 25,340 .
If price breaks and sustains below 25,132 , expect weakness toward 25,053 or even 24,950 – 24,981 .
Options Tip: Use ATM Straddles/Strangles if market consolidates between 25,132 – 25,225 for premium decay setups.
📉 SCENARIO 3: GAP-DOWN OPENING (Below 25,053) ⚠️
A gap-down opening below 25,053 creates immediate bearish pressure. First downside support to monitor is 24,950 – 24,981 (Buyer’s Support Zone) .
If this zone holds, expect reversal buying with a stop-loss below 24,950 .
If 24,950 breaks, avoid fresh longs. Downtrend extension possible below this zone.
Options Tip: On gap-down days, prefer Bear Put Spreads or ATM Put Options for controlled risk instead of buying far OTM PEs.
💡 RISK MANAGEMENT TIPS FOR OPTIONS TRADERS
Risk only 1–2% of your capital per trade.
Avoid chasing prices in the first 15 minutes after the opening bell.
Prefer ATM/ITM options for directional trades.
Always mark Stop Loss and Stick to it strictly.
Control position sizing—don’t over-leverage on gap opening days.
📌 SUMMARY & CONCLUSION
Bullish Scenario: Above 25,340 → Target 25,408–25,430.
Range-Bound Scenario: Between 25,132 – 25,225 → Watch consolidation before acting.
Bearish Scenario: Below 25,053 → Target 24,950–24,981.
Always stay disciplined with entries and exits. Risk control should be your primary focus as an options trader.
⚠️ DISCLAIMER: I am not a SEBI-registered analyst. This trading plan is shared purely for educational purposes. Please do your own analysis or consult a certified financial advisor before acting on this information.

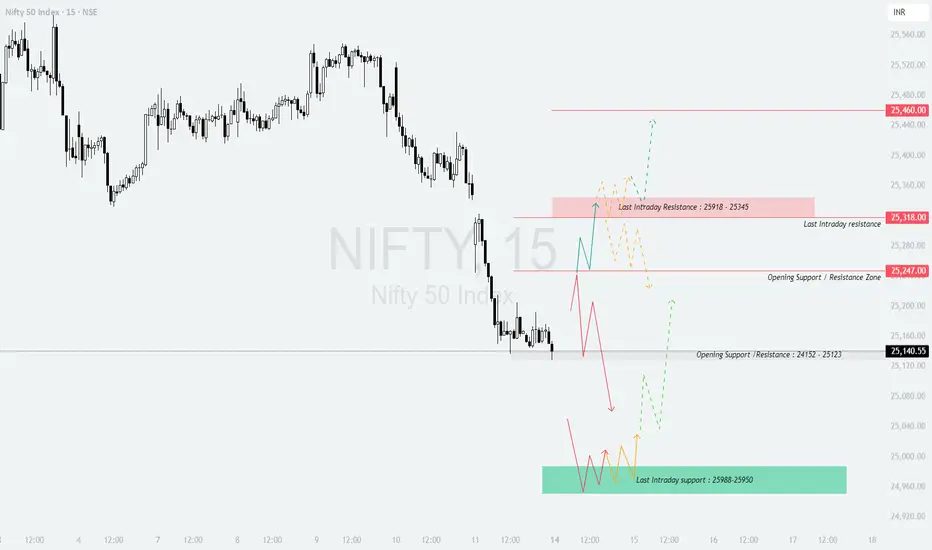
NIFTY : Trading levels and Plan for 14-Jul-2025b]📊 NIFTY 50 INTRADAY PLAN – 14 JULY 2025 (15-Min Chart Study)
Educational insights for all opening scenarios: Gap-Up, Flat, and Gap-Down.
📍 Previous Close: 25,140.55
📌 Gap opening threshold considered: 100+ points
⏱️ Tip: Let the first 15–30 minutes settle before entering trades based on levels.
📌 KEY LEVELS TO MONITOR
Resistance Zone: 25,460
Last Intraday Resistance: 25,318
Opening Support / Resistance Zone: 25,247
Opening Support / Resistance Zone: 25,152 – 25,123
Last Intraday Support Zone: 25,088 – 25,050
🚀 SCENARIO 1: GAP-UP OPENING (Above 25,247) 📈
Bias: Bullish continuation possible
If Nifty opens above 25,247 , watch for continuation towards 25,318 (Last Intraday Resistance) .
Sustainable strength above 25,318 can lead to 25,460 . That’s the upper profit booking zone.
If price shows exhaustion candles near 25,460, avoid fresh longs. Instead, look for selling opportunities with tight stop-loss.
Options Traders: Prefer ATM or slightly ITM calls; avoid chasing far OTM CE after gap-up. Time decay will be sharp in such cases.
📊 SCENARIO 2: FLAT OPENING (Near 25,140 – 25,152) 🔄
Bias: Neutral-to-bearish bias
If the market opens around 25,140 – 25,152 , focus on whether the 25,152 – 25,123 zone holds as support or flips as resistance.
If price holds above 25,152, there’s potential for a bounce towards 25,247.
If price breaks and sustains below 25,123, expect a gradual drift towards the Last Intraday Support: 25,088 – 25,050 .
Avoid quick trades here — observe the first 30 minutes’ range before committing capital.
📉 SCENARIO 3: GAP-DOWN OPENING (Below 25,050) ⚠️
Bias: Bearish with bounce attempt from lower supports
If Nifty opens below 25,050 , immediate attention should be given to Last Intraday Support: 25,088 – 25,050 .
If that zone breaks, next major support becomes psychological round numbers or extreme supports which may form intraday.
Aggressive selling should only be considered if prices show no reaction around this zone. Watch for hammer or reversal patterns before taking contra long trades.
Options Traders: Avoid buying deep OTM puts after a large gap-down as premiums often get inflated due to IV spikes.
💡 OPTIONS TRADING – RISK MANAGEMENT TIPS
Focus on ATM or ITM strikes to reduce theta impact on both CE and PE buying.
Apply Stop-Loss based on 15-minute candle closes instead of absolute price ticks to avoid noise.
If VIX is high, hedge with vertical spreads instead of naked options buying.
Strictly maintain a 1–2% max risk of your capital per trade.
Avoid over-trading after 2:45 PM as theta erosion accelerates in options.
Keep tracking Bank Nifty as well for broader market cues.
📌 SUMMARY & CONCLUSION
Bullish Trigger: Above 25,247 → Target 25,318 – 25,460
Neutral Zone: 25,140 – 25,152 → Wait and watch zone
Bearish Trigger: Below 25,123 → Watch 25,088 – 25,050 for bounce
Keep your discipline intact and avoid emotional trades.
Options premium decay is real — always respect time and structure.
⚠️ DISCLAIMER: I am not a SEBI-registered analyst. This trading plan is for educational purposes only. Please do your own analysis or consult with a financial advisor before making trading decisions.
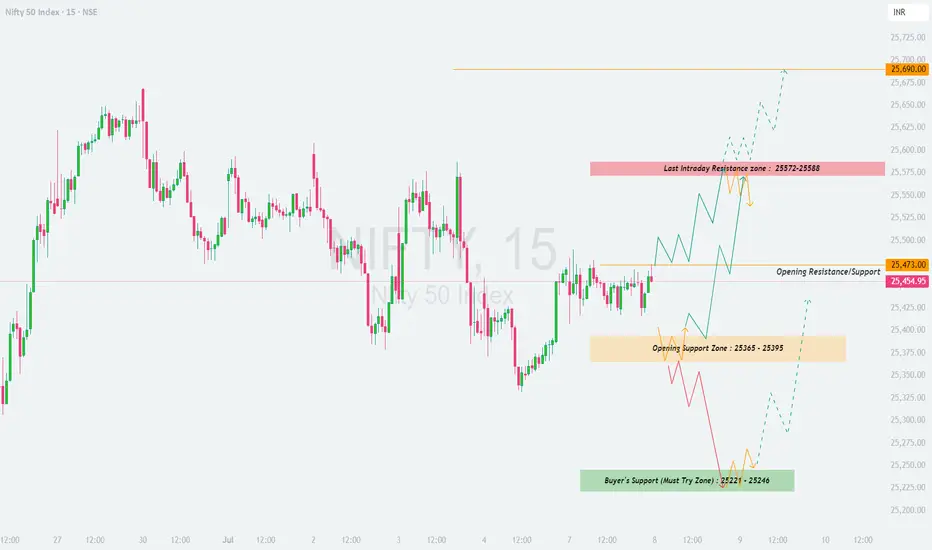
NIFTY : Trading levels and plan for 08-July-2025📊 NIFTY TRADING PLAN – 08 July 2025
(Based on 15-min chart structure – For educational purposes only)
Gap Opening Reference: 100+ pts
Structure favors breakout or reversal play from key zones.
Let price settle in first 15–30 mins before executing any plan.
🔍 Key Zones to Watch:
Opening Resistance/Support: 25,473
Opening Support Zone: 25,365 – 25,395
Buyer’s Must-Hold Zone: 25,221 – 25,246
Last Intraday Resistance: 25,572 – 25,588
Major Resistance (Profit Booking): 25,690
📈 SCENARIO 1: GAP-UP OPENING (100+ pts above 25,473)
If NIFTY opens above 25,572 and sustains, expect price to test the 25,690 zone.
Look for signs of reversal near 25,690 to book longs or consider a short with SL above the zone.
If price fails to hold above 25,572, it may fall back toward 25,473.
📉 SCENARIO 2: FLAT OPENING (within 25,454 – 25,473 range)
Avoid early trades — let the price action confirm direction.
Break above 25,473 can take NIFTY toward 25,572–25,588.
Break below 25,395 may open downside toward 25,246.
📉 SCENARIO 3: GAP-DOWN OPENING (100+ pts below 25,365)
Watch for support near 25,221–25,246 zone — a strong demand area.
If price bounces with bullish structure, a reversal trade can be taken with defined SL.
Break and sustain below 25,221 could invite further selling toward 25,080.
💡 OPTIONS RISK MANAGEMENT TIPS:
Trade only near defined levels with confirmation.
Use spreads (e.g., bull call/bear put) during high volatility to reduce risk.
Avoid buying deep OTM options unless there's a strong trending move.
Always define SL and adhere to position sizing rules.
📌 SUMMARY:
Above 25,473 = Bullish bias
Below 25,365 = Bearish bias
25,221–25,246 = Strong reversal zone
Wait for price action to confirm before taking positions
⚠️ DISCLAIMER: I am not a SEBI-registered advisor. This plan is for educational purposes only. Please do your own research or consult a financial advisor before trading.
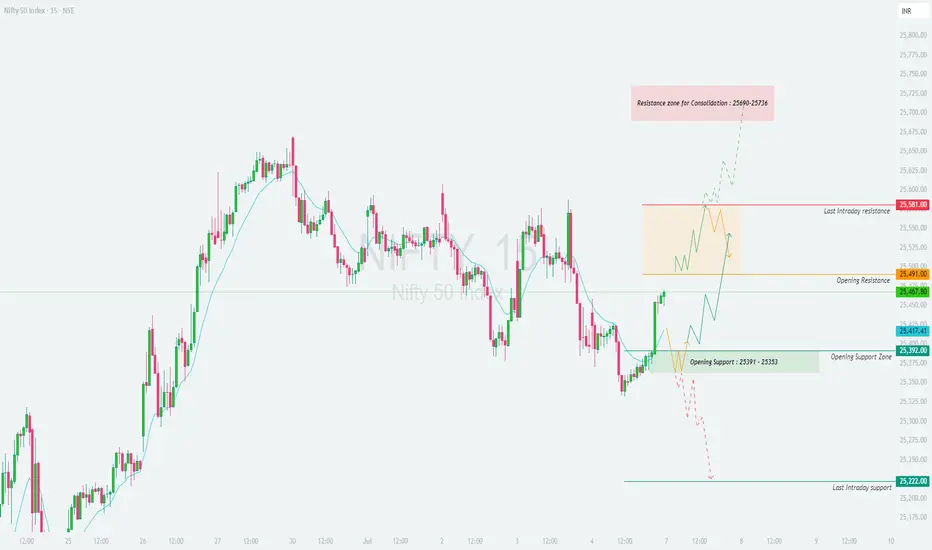
NIFTY : Trading levels and plan for 07-July-2025📘 NIFTY INTRADAY TRADING PLAN – 07-Jul-2025
🕒 Chart Timeframe: 15-Min | 🧭 Approach: Zone-Based Price Action | 🎯 Focus: Scalping to Positional Intraday
📍 Important Levels:
🔸 Opening Support Zone: 25,391 – 25,353
🔹 Opening Resistance Zone: 25,491
🔸 Last Intraday Resistance: 25,581
🔺 Major Resistance for Consolidation: 25,690 – 25,736
🔻 Last Intraday Support: 25,222
🟩 1. GAP-UP Opening (100+ points above 25,491)
If Nifty opens near or above 25,600, it will enter the last Intraday Resistance Zone and approach the Consolidation Resistance Zone (25,690–25,736).
📈 Action: Wait for a candle close above 25,581, then buy on strength toward 25,690–25,736.
🔄 Partial Booking: Consider profit booking in the upper consolidation zone.
📉 Rejection Trade: If strong reversal appears near 25,736, aggressive traders may short for a pullback to 25,491 with tight SL above the highs.
🛑 Stop Loss: Below 15-min candle low (for long) or above rejection high (for short).
🟨 2. Flat Opening (between 25,417 – 25,491)
This is the Opening Resistance Band—expect sideways price behavior in the first 15–30 mins.
📊 Wait for price to either break above 25,491 or fall below 25,417 with strength.
📈 Long Setup: If price crosses 25,491, ride it toward 25,581. Book partial at this resistance.
📉 Short Setup: Breakdown below 25,417 opens up support test at 25,391 – 25,353.
🧠 Tip: Avoid trades within the orange range (25,417–25,491) unless breakout is clear.
🟥 3. GAP-DOWN Opening (100+ points below 25,353)
This brings price closer to Opening Support and possibly into Breakdown Territory.
📉 Breakdown Trade: If price opens below 25,353 and fails to recover in first 15–30 mins, consider shorting toward 25,222 (Last Support).
📈 Reversal Trade: If price rebounds sharply and crosses back above 25,417, initiate reversal long with targets at 25,491.
🛑 SL Management: Use 15-min candle close basis – especially near support/resistance edges.
⚠️ Avoid shorts near 25,222 unless clean breakdown occurs.
💡 Risk Management Tips for Options Traders:
✅ Use ATM or slightly ITM options for directional trades; avoid deep OTM in the morning.
✅ Avoid trading aggressively in the first 15 mins—allow price to settle.
✅ For rangebound markets, prefer option selling strategies like Iron Condor or Strangle.
✅ Set a maximum loss limit for the day (1–2% of capital) and stick to it.
✅ Avoid emotional averaging—follow the plan or stay out.
📝 Summary & Conclusion:
📌 Above 25,581, Nifty could push into a high-consolidation resistance near 25,736
📌 Failure to sustain above 25,491 may result in a pullback to the support zone
📌 Break below 25,353 brings the 25,222 zone into play
📌 Wait for the first 15–30 mins to reduce fakeouts—zone-based trading will offer best R:R setups.
⚠️ Disclaimer:
I am not a SEBI-registered analyst . This plan is shared purely for educational purposes. Please consult a registered financial advisor or conduct your own analysis before making any trades.
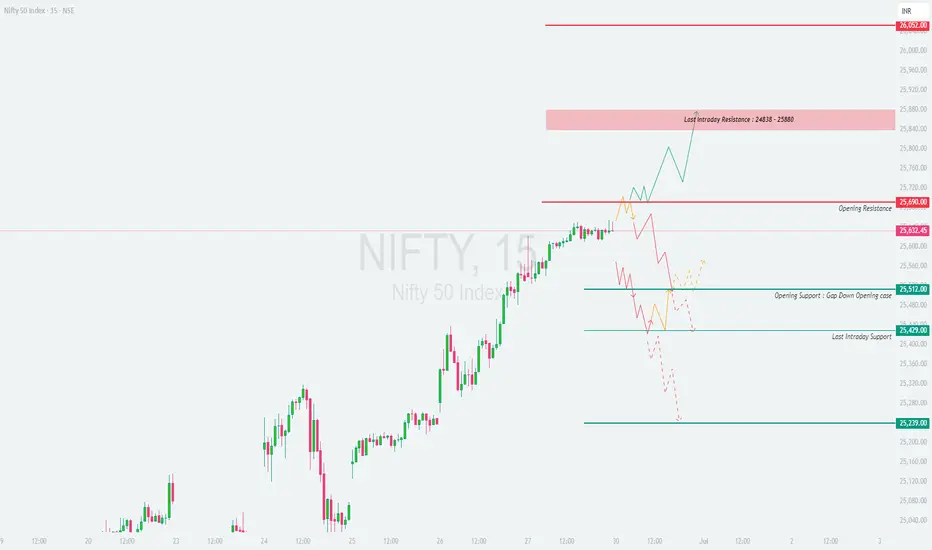
NIFTY : Trading levels and Plan for 30-JUN-2025
\ 📊 NIFTY 50 TRADING PLAN – 30-Jun-2025\
📍 \ Previous Close:\ 25,632
📏 \ Gap Opening Consideration:\ ±100 points
📈 \ Chart Timeframe:\ 15-min
🧩 \ Key Zones:\ Resistance – 25,690 / Support – 25,429 / Last Resistance – 25,838–25,880
---
\
\ \ 🚀 GAP-UP OPENING (Above 25,730):\
If NIFTY opens above \ 25,730\ , it will quickly enter the \ Last Intraday Resistance Zone (25,838 – 25,880)\ . This area is likely to act as a supply zone where profit booking may kick in. Traders should avoid aggressive longs near resistance unless a breakout is confirmed with strong momentum.
✅ \ Plan of Action:\
• Wait for price action to stabilize near 25,838
• Go long only if there's a breakout above 25,880 with strong volume
• Watch for bearish patterns like shooting stars or bearish engulfing near this zone
🎯 \ Trade Setup:\
– \ Buy above:\ 25,880
– \ Target:\ 26,000+
– \ SL:\ Below 25,730 or initial range low
📘 \ Tip:\ Avoid FOMO entries in first 15 minutes. Let the candle confirm breakout strength.
\ \ ⚖️ FLAT OPENING (Near 25,630 – 25,690):\
A flat opening near \ 25,632\ brings the market directly around the \ Opening Resistance of 25,690\ . This area could lead to sideways choppiness if there’s no directional conviction. Best strategy is to wait for a breakout or breakdown from this zone.
✅ \ Plan of Action:\
• Observe price behavior between 25,690 (resistance) and 25,512 (support)
• Go long if price breaks and sustains above 25,690 with strength
• Go short if breakdown below 25,512 is seen
🎯 \ Trade Setup Options:\
– \ Buy above:\ 25,690
– \ Sell below:\ 25,512
– \ Target:\ 25,838 or 25,429 depending on breakout/breakdown
– \ SL:\ Opposite zone or prior swing candle
📘 \ Tip:\ Wait for at least a 15-min candle close outside the range for confirmation.
\ \ 📉 GAP-DOWN OPENING (Below 25,512):\
If NIFTY opens below \ 25,512\ , it enters the \ Opening Support Zone for Gap-Down Cases\ . Immediate support lies at \ 25,429\ , which could act as a reversal point. However, if that breaks, NIFTY may fall towards \ 25,239\ .
✅ \ Plan of Action:\
• Watch for a bounce at 25,429 for possible reversal trades
• If price breaks below 25,429 and sustains, initiate short trades
• Look for bullish candles like hammers for reversal signals
🎯 \ Trade Setup:\
– \ Sell below:\ 25,429
– \ Target:\ 25,239
– \ SL:\ Above 25,512
📘 \ Tip:\ Avoid aggressive buying in early dip unless price holds and consolidates above support levels.
---
\ 🧭 KEY LEVELS TO WATCH:\
🔴 \ Opening Resistance:\ 25,690
🟥 \ Last Intraday Resistance:\ 25,838 – 25,880
🟩 \ Opening Support (Gap Down):\ 25,512
🟦 \ Last Intraday Support:\ 25,429
🟫 \ Major Support:\ 25,239
---
\ 💡 OPTIONS TRADING – RISK MANAGEMENT TIPS:\
✅ Trade near ATM options for quick deltas
✅ Don’t hold naked options if VIX is falling
✅ Always set stop-loss for option premiums
✅ Avoid averaging into losing trades
✅ For gap-ups, consider Bear Call Spreads
✅ For gap-downs, look into Bull Put Spreads
🛑 Never trade based on emotion; follow structure and levels only.
---
\ 📌 SUMMARY – ACTIONABLE ZONES:\
• ✅ \ Bullish above:\ 25,690 → Upside potential till 25,880+
• ⚠️ \ Choppy zone:\ 25,512 – 25,690 → Avoid forced trades
• ❌ \ Bearish below:\ 25,429 → Downside open till 25,239
🎯 \ Best Trades:\ Buy above 25,880 (momentum breakout), Sell below 25,429 (breakdown confirmation)
---
\ ⚠️ DISCLAIMER:\
I am not a SEBI-registered analyst. This analysis is shared for educational purposes only. Please do your own research or consult a registered financial advisor before taking trades. Always use strict stop-loss and risk management protocols.
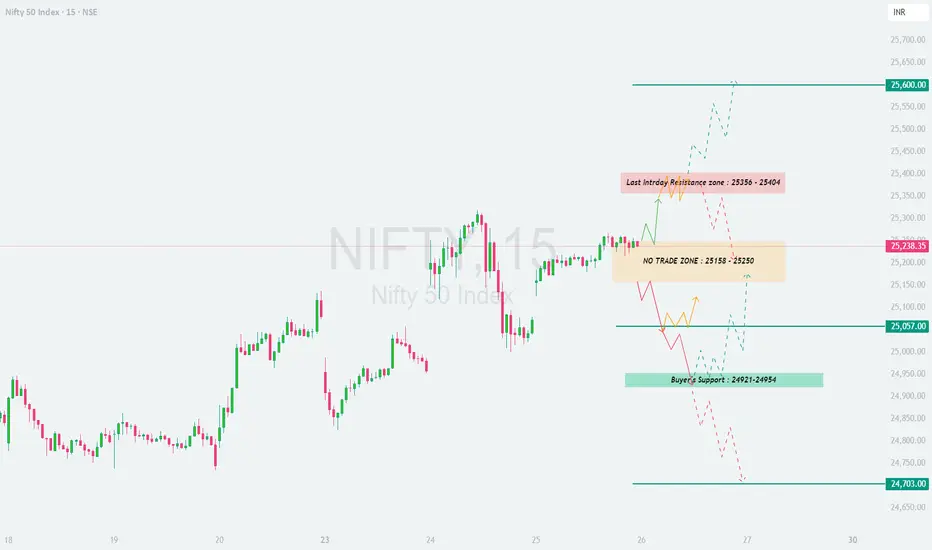
NIFTY : Trading levels and Plan for 26-Jun-2025\ 📈 NIFTY TRADING PLAN – 26-Jun-2025\
📍 \ Previous Close:\ 25,238
📏 \ Gap Opening Consideration:\ ±100 points
🕒 \ Chart Timeframe:\ 15-Minutes
🧩 \ Strategy Focus:\ Zone-based reaction + Breakout/Breakdown with confirmation
---
\
\ \ 🚀 GAP-UP OPENING (Above 25,356):\
If Nifty opens 100+ points above and trades above \ 25,356\ , it will directly enter the \ Last Intraday Resistance Zone (25,356 – 25,404)\ . Sustained strength above this zone could trigger a move toward the upper resistance at \ 25,600\ .
✅ \ Plan of Action:\
• Observe price reaction near 25,404 — look for rejection or breakout
• If breakout sustains with volume, trend continuation possible
• A rejection here might signal intraday reversal or consolidation
🎯 \ Trade Setup:\
– Long above 25,404 with confirmation
– Target: 25,600
– SL: Below 25,356
– Short only if clear rejection occurs below 25,356 with volume
📘 \ Pro Tip:\ Don’t jump into trades immediately post open — let the first 15-minute candle confirm the bias.
\ \ ⚖️ FLAT OPENING (Between 25,158 – 25,250):\
This region is marked as \ NO TRADE ZONE\ , where indecision and false moves are more likely. Trapped buyers/sellers from previous sessions often create sideways or volatile price action here.
✅ \ Plan of Action:\
• Avoid trading within this zone
• Wait for a breakout above 25,250 or a breakdown below 25,158
• Entry only after 15–30 minutes of trend confirmation
🎯 \ Trade Setup:\
– Long above 25,250 → Target: 25,356
– Short below 25,158 → Target: 25,057
– SL: Outside of range boundary
📘 \ Pro Tip:\ Protect your capital — “no trade” is also a strategy. Trade only when structure forms outside the zone.
\ \ 📉 GAP-DOWN OPENING (Below 25,057):\
Opening below the \ Opening Support (25,057)\ brings the \ Buyer’s Support Zone (24,921 – 24,954)\ into focus. A reversal bounce or further breakdown will depend on early price action around this zone.
✅ \ Plan of Action:\
• Look for bullish candles or wicks from 24,921 zone for potential intraday reversal
• If breakdown below 24,921 occurs, expect move toward \ 24,703\
• Be cautious during volatile flushes in first 5–10 mins
🎯 \ Trade Setup:\
– Long only on strong reversal at 24,921–24,954
– Short below 24,921 with momentum
– Target: 24,703
– SL: Tight SL below support for longs or above resistance for shorts
📘 \ Pro Tip:\ Lower supports attract buying interest — ideal for low-risk reversals, but only with confirmation.
---
\ 📊 KEY LEVELS TO WATCH:\
🟧 \ NO TRADE ZONE:\ 25,158 – 25,250
🟥 \ Resistance Zone:\ 25,356 – 25,404
🟢 \ Opening Support:\ 25,057
🟦 \ Buyer’s Support Zone:\ 24,921 – 24,954
🔻 \ Breakdown Support:\ 24,703
---
\ 🛡️ OPTIONS TRADING & RISK MANAGEMENT TIPS:\
✅ Use \ Bull Call Spreads\ above resistance to reduce premium decay risk
✅ In sideways zones, prefer \ Iron Condors or Short Straddles\ (only if IV is high)
✅ Avoid naked OTM options inside no trade zone – theta kills premium
✅ Never chase after missed trades – wait for next setup
✅ SL should always be based on \ 15-min closing candles\
✅ Maintain risk per trade ≤ \ 2% of capital\
---
\ 📌 SUMMARY:\
• 🔼 \ Bullish Above:\ 25,404 → Next stop: 25,600
• ⛔ \ Avoid trading inside:\ 25,158 – 25,250
• 🔽 \ Bearish Below:\ 25,057 → Watch 24,921
• 🧲 \ Reversal or flush below:\ 24,921 → Can test 24,703
---
\ ⚠️ DISCLAIMER:\
I am not a SEBI-registered advisor. All trade setups shared are for educational purposes only. Always perform your own analysis or consult a financial expert before entering any trades. Use strict stop-loss and adhere to risk management at all times.
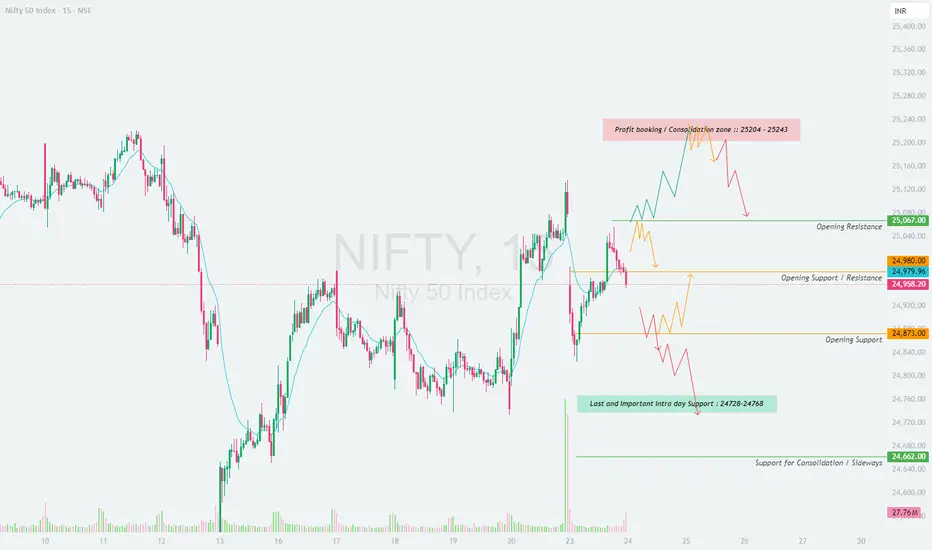
NIFTY : Trade plan and level for 24-Jun-25
\ 📈 NIFTY 50 TRADING PLAN – 24-Jun-2025\
📍 \ Previous Close:\ 24,958.20
📏 \ Gap Threshold:\ 100+ points
🕒 \ Chart Timeframe:\ 15-min
---
\
\ \ 🚀 GAP-UP OPENING (Above 25,087):\
If Nifty opens above the \ Opening Resistance at 25,087\ , it would enter the red zone labeled \ Profit Booking / Consolidation Zone :: 25,204 – 25,243\ .
✅ \ Plan of Action:\
• Wait for 15–30 minutes to check if the price sustains above 25,087.
• If the price shows strength and crosses 25,204, it can trigger a short-term bullish move up to 25,243+.
• However, if the index shows a reversal in the red zone, profit booking may trigger a pullback to 25,087.
🎯 \ Trade Setup:\
– Buy on breakout + sustain above 25,204
– Target: 25,243–25,275
– SL: 25,080
– OR wait to short near 25,243 if reversal pattern forms
📘 \ Pro Tip:\ Avoid aggressive longs in the consolidation zone. Better to trade with breakout confirmations.
\ \ 📘 FLAT OPENING (Between 24,980 – 25,087):\
A flat opening puts Nifty in a narrow decision zone between \ Opening Resistance (25,087)\ and \ Opening Support/Resistance flip zone (24,980)\ .
✅ \ Plan of Action:\
• Avoid trading inside this range initially as volatility traps are common.
• A breakout above 25,087 = bullish continuation.
• Breakdown below 24,980 = early signs of weakness toward lower support levels.
🎯 \ Trade Setup:\
– Buy above 25,087 with volume
– Sell below 24,980 only if price sustains
– SL: 15–25 pts depending on entry type
📘 \ Pro Tip:\ Do not anticipate the breakout or breakdown—wait for confirmation and volume spikes to participate.
\ \ 📉 GAP-DOWN OPENING (Below 24,873):\
A gap-down below \ Opening Support (24,873)\ pushes Nifty into weaker terrain. The next reliable demand zone is the \ Last Important Intraday Support: 24,728–24,768\ .
✅ \ Plan of Action:\
• Look for price behavior near 24,728–24,768.
• If this zone holds, expect a bounce back toward 24,873
• If it breaks, downside may extend to \ Support for Consolidation / Sideways at 24,662\
🎯 \ Trade Setup:\
– Sell on breakdown below 24,728
– SL: 24,775
– Buy only if strong bullish reversal pattern forms around 24,728
📘 \ Pro Tip:\ Gap-down trades are riskier—patience pays. Avoid trading the first candle. Let sentiment unfold.
---
\ 💡 OPTIONS RISK MANAGEMENT TIPS:\
✅ \ 1. Avoid buying options inside tight ranges or sideways zones\
✅ \ 2. Use spreads (like Bull Call or Bear Put) when IV is high or near resistance zones\
✅ \ 3. Exit positions on major reversal signals or key levels break\
✅ \ 4. Always use stop-losses and pre-defined capital exposure per trade\
✅ \ 5. Don't overtrade on volatile days. Sit out if unclear!\
---
\ 📌 SUMMARY – KEY LEVELS FOR 24-Jun-2025:\
🔺 \ Profit Booking Zone:\ 25,204 – 25,243
🟥 \ Opening Resistance:\ 25,087
🟧 \ Opening Support/Resistance Flip:\ 24,980
🟨 \ Opening Support:\ 24,873
🟩 \ Key Intraday Support:\ 24,728 – 24,768
🟦 \ Lower Demand Zone:\ 24,662
---
\ 📚 CONCLUSION:\
• 🔼 \ Above 25,204:\ Bulls may extend to 25,243+
• ⏸ \ Between 24,980–25,087:\ Volatile – wait for clarity
• 🔽 \ Below 24,873:\ Bearish tone, support at 24,728
Patience and precision are more valuable than prediction. Wait for confirmation, and always protect your capital. 🎯📉📈
---
\ ⚠️ DISCLAIMER:\
I am not a SEBI-registered analyst. This trading plan is prepared purely for educational purposes. Please consult your financial advisor before taking any trades based on this information. Trade responsibly and with proper risk management.
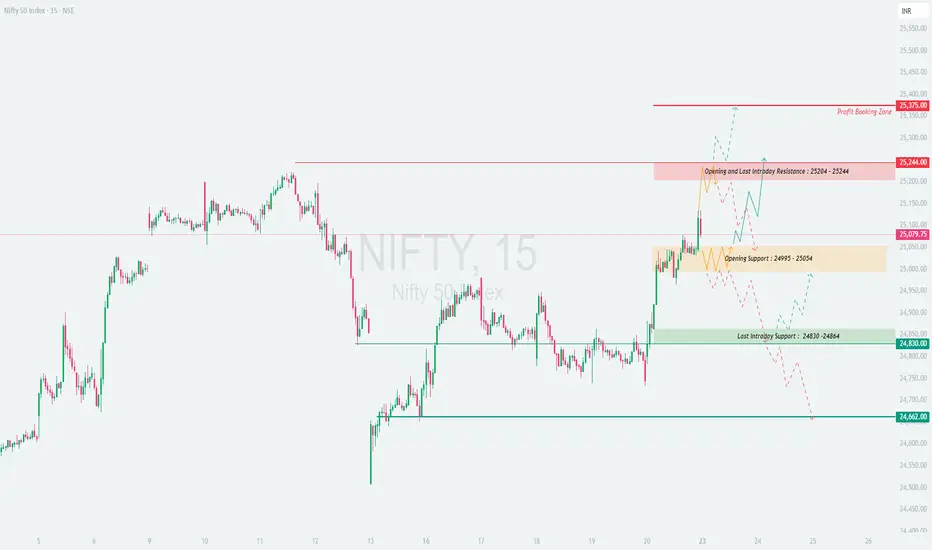
NIFTY : Trading plan and levels for 21-Jun-2025
\ 📊 NIFTY TRADING PLAN – 21-Jun-2025\
📍 \ Previous Close:\ 25,079.75
📏 \ Gap Threshold:\ 100+ points
🕒 \ Chart Reference:\ 15-minute timeframe
---
\
\ \ 🚀 GAP-UP OPENING (Above 25,244):\
If Nifty opens above 25,244, it would break above the \ Opening & Last Intraday Resistance zone (25,204 – 25,244)\ , entering a profit-booking territory.
✅ \ Plan of Action:\
• Wait for 15–30 minutes for confirmation candles.
• If sustained above 25,244, bullish continuation is likely toward the \ Profit Booking Zone – 25,375+\ .
• However, if the index shows rejection near 25,244, expect a retest of the previous resistance zone.
🎯 \ Trade Setup:\
– Buy on a successful retest or breakout above 25,244
– Stop-loss: below 25,200
– Target: 25,350–25,375
📘 \ Pro Tip:\ Avoid impulsive longs on big gap-ups. Let price digest the gap and give a clear entry.
\ \ 📘 FLAT OPENING (Between 25,054 – 25,204):\
A flat opening places the index in a volatile consolidation zone between \ Opening Support (24,995 – 25,054)\ and resistance.
✅ \ Plan of Action:\
• Avoid trading inside the range of 25,054–25,204 due to fakeouts.
• Trade directional breakout from either side of this box:
– \ Above 25,204\ : Possible bullish breakout toward 25,350
– \ Below 24,995\ : Breakdown can push index to 24,864 or lower
🎯 \ Trade Setup:\
– Buy above 25,204 or sell below 24,995 with confirmation
– Tight SL (20–30 pts) is necessary inside this choppy zone
📘 \ Pro Tip:\ Avoid trading in the orange "Opening Support" zone unless a strong volume-based breakout or breakdown is seen.
\ \ 📉 GAP-DOWN OPENING (Below 24,864):\
A gap-down opening below the \ Last Intraday Support (24,864 – 24,830)\ signals early weakness in the market.
✅ \ Plan of Action:\
• First support to watch: \ 24,662\
• If price bounces from 24,662 with strength, short-covering may lead to a test of 24,864
• A breakdown below 24,662 can open doors to 24,500–24,420 levels
🎯 \ Trade Setup:\
– Short if price sustains below 24,830
– Stop-loss: above 24,880
– Buy only if sharp reversal seen at 24,662
📘 \ Pro Tip:\ Avoid panic selling. Wait for price to stabilize post-gap down and then decide.
---
\ 🛡 RISK MANAGEMENT & OPTIONS TRADING TIPS:\
✅ \ 1. Never chase trades at market open – observe price structure first\
✅ \ 2. For gap-ups, prefer debit spreads instead of naked calls to limit risk\
✅ \ 3. Don’t hold OTM options during range-bound action – decay is rapid\
✅ \ 4. Trail profits – especially after a breakout move hits your first target\
✅ \ 5. Respect volatility – no trade is also a trade in indecision zones\
---
\ 📌 SUMMARY – LEVELS TO WATCH FOR 21-Jun-2025:\
• 🔴 \ Resistance Zone:\ 25,204 – 25,244
• 🎯 \ Profit Booking Zone:\ 25,375
• 🟠 \ Opening Support Zone:\ 24,995 – 25,054
• 🟢 \ Last Intraday Support:\ 24,864 – 24,830
• 🔻 \ Breakdown Support:\ 24,662
💡 \ Summary Recap:\
• 🔼 Above 25,244 = Bullish momentum resumes
• ⏸ Between 25,054–25,204 = Sideways chop, avoid trades
• 🔽 Below 24,864 = Watch for sell pressure and bounce from 24,662
---
\ 📢 DISCLAIMER:\
I am not a SEBI-registered analyst. This trading plan is for educational and informational purposes only. Please consult your financial advisor before taking any market decisions. Trade safe and always manage your risk! ⚖️📉📈
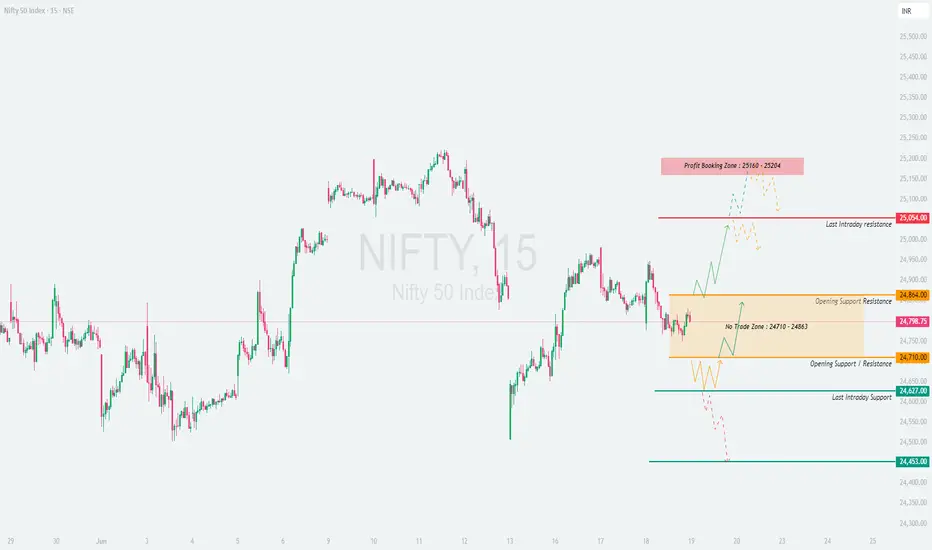
NIFTY : Trading levels and plan for 18-Jun-2025📊 NIFTY TRADING PLAN – 19-June-2025
📍 Previous Close: 24,798.75 | 🕒 Timeframe: 15-min
📏 Gap Threshold Considered: 100+ points for classification
🔼 GAP-UP OPENING (Above 24,964):
If NIFTY opens above 24,964, it breaks out of the "No Trade Zone" (24,710–24,864) and suggests bullish momentum toward upper resistances.
✅ Plan of Action:
• Wait for price to sustain above 25,054 (Last Intraday Resistance).
• If 15-min candle closes strong above 25,054 with volume, initiate long trades toward the Profit Booking Zone: 25,160 – 25,204 .
• Stop-loss: Below 25,000 (15-min candle close basis).
• If prices face rejection at 25,054 or near 25,160 zone, look for short trades for a pullback toward 24,864.
📘 Tip: On gap-up days, avoid chasing the open blindly . Let the first 15–30 minutes define control – buyers vs sellers.
⚖️ FLAT OPENING (Between 24,710 – 24,864):
Opening within the No Trade Zone signifies indecision. This zone needs a breakout for directional trades.
✅ Plan of Action:
• Avoid any aggressive trade within 24,710 – 24,864.
• If price breaks and sustains above 24,864, initiate long trade toward 25,054, with SL below 24,820.
• If price breaks down below 24,710, initiate short trade toward 24,627, SL above 24,750.
• Watch for wick traps — ensure breakout happens with solid volume candle, not just one spike.
📘 Tip: In no-trade zones, your capital is safest when you wait . Let price exit the confusion before entering.
🔽 GAP-DOWN OPENING (Below 24,610):
If NIFTY opens below 24,710 by over 100 points, it’s a gap-down near the Last Intraday Support at 24,627 , which brings weakness into play.
✅ Plan of Action:
• If price breaks and sustains below 24,627, short trades can be taken toward 24,453 (next major support).
• SL for short trades above 24,680.
• If sharp buying emerges from 24,453 – 24,500 zone, look for reversal long trades back toward 24,710.
• Confirm with reversal candles like hammer/morning star on 15-min chart.
📘 Tip: Buyer’s Support zones are best for risk-reward long trades , but confirmation is key — don’t knife-catch.
🛡 OPTIONS TRADING – RISK MANAGEMENT TIPS:
✅ 1. Use Spread Strategies: Vertical spreads (Bull Call/Bear Put) help limit losses on volatile days.
✅ 2. Don’t Enter in the First 5-min Candle: Especially on gap-up/down days, let the initial volatility settle.
✅ 3. Track IV (Implied Volatility): High IV days can erode premiums fast post breakout — consider theta decay risk.
✅ 4. Set SL Based on 15-min Candle Close: Avoid panic exits due to wicks or noise.
✅ 5. Book 50% Profits Early: If your trade moves 50–70% in favor, partial exit helps lock-in gains.
📌 SUMMARY – KEY LEVELS TO WATCH:
🟩 Support Zones:
• Opening Support / Resistance: 24,710
• Last Intraday Support: 24,627
• Strong Buyer’s Support: 24,453
🟥 Resistance Zones:
• Opening Resistance: 24,864
• Last Intraday Resistance: 25,054
• Profit Booking Area: 25,160 – 25,204
⚔️ Battle Zone (No Trade): 24,710 – 24,864
📈 Trend Decision Zones:
• Above 24,864 → Bullish toward 25,160+
• Below 24,710 → Bearish toward 24,453
📢 DISCLAIMER: I am not a SEBI-registered analyst. This plan is prepared purely for educational purposes. Please consult your financial advisor before making any trading or investment decision.
nifty analysismay be nifty will positive in this month from monday. nifty next target is ATH. after that i aspecting a fake breakout . then nifty will fall upto 24100- 24000 levels . we see 24000 levels in the month of september.

Nifty Inverted Head and Shoulder Bullidh Breakout possibleNifty has confirmed an Inverted Head and Shoulder breakout around 22,650, indicating a strong bullish momentum. This classic reversal pattern suggests that buyers are gaining control, and further upside movement is expected.
Trade Setup:
Entry: Above 22,650
Stop Loss: 22,350 (below the right shoulder)
Target: 22,950 (measured move projection)
Technical Analysis:
The neckline breakout with good volume confirms bullish strength.
RSI is showing positive divergence, supporting the uptrend.
If Nifty sustains above the breakout level, we may witness further upward momentum.
Risk Management:
Always follow proper risk-reward management.
Keep position sizing appropriate to your risk appetite.
Avoid over-leveraging.
Disclaimer: This analysis is for educational and informational purposes only and should not be considered financial advice. Trading in the stock market involves risk. Please do your own research and consult a SEBI-registered financial advisor before making any investment decisions.

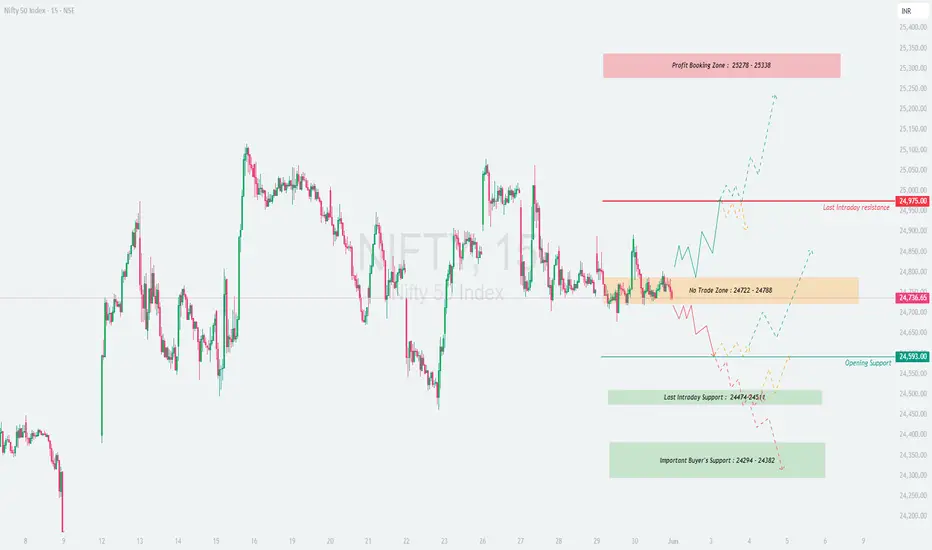
NIFTY : Trading Levels and Plan for 02-JUN-2025📘 NIFTY 50 – TRADING PLAN for 02-Jun-2025
🕒 Timeframe: 15-minute Chart Structure
📍 Gap Opening Threshold: 100+ points from previous close of 24,736.65
🔼 GAP-UP OPENING (Above 24,875):
If Nifty opens with a gap-up above the upper end of the No Trade Zone (24,722 – 24,788) , it indicates early strength and a potential breakout. However, it will face immediate resistance near the psychological mark of 24,975, which is the Last Intraday Resistance .
✅ Plan of Action:
• If the first 15–30 minutes show strength above 24,875 with bullish candles and follow-through volume, look to enter long above 24,900–24,975.
• Targets:
→ First: 24,975
→ Extended: 25,278 – 25,338 (Profit Booking Zone)
• Stop-loss: Below 15-min support candle or under 24,788 for confirmation-based trades.
• Avoid entering long trades directly near 24,975 unless a pullback-retest happens and sustains above.
🧠 Educational Tip: Don’t chase gap-ups blindly. Wait for confirmation like bullish engulfing or retest near breakout zone before taking the trade.
⚖️ FLAT OPENING (Between 24,722 – 24,788):
This is the No Trade Zone , meaning price is in indecision and trapped between key levels. Market may consolidate or build a base before directional movement.
✅ Plan of Action:
• Avoid trading the first 15–30 minutes. Let the price break out of this zone decisively.
• Break Above 24,788: Go long with SL below 24,722, targets: 24,975 / 25,278
• Break Below 24,722: Go short with SL above 24,788, targets: 24,593 / 24,474
• Watch for fakeouts – ensure breakout is supported by strong candle close and not just a wick.
🧠 Educational Tip: No Trade Zones are created for a reason – they usually trap impatient traders. Let the market choose direction and join the trend.
🔽 GAP-DOWN OPENING (Below 24,593):
A gap-down below Opening Support (24,593) suggests early weakness. Nifty may try to test deeper support levels near 24,474 – 24,451 (Last Intraday Support) and further toward 24,294 – 24,382 (Important Buyer’s Support).
✅ Plan of Action:
• Watch the 24,474 – 24,451 zone for signs of reversal. If a bullish reversal candle forms, a long entry can be attempted targeting:
→ 24,593
→ Extended: 24,722
• If 24,451 breaks decisively, expect momentum to carry prices toward 24,294 – 24,382.
• Short Trades: Can be taken only if price rejects bounce zones with bearish structure (e.g., bearish engulfing or retest failure).
🧠 Educational Tip: Don’t buy into weakness without confirmation. Bearish momentum tends to accelerate if support zones break early in the day.
🛡 RISK MANAGEMENT TIPS FOR OPTIONS TRADERS:
✅ 1. Avoid buying far OTM options after a gap opening – stick to ATM or near ATM strikes for better delta.
✅ 2. Use spreads (Bull Call/Bear Put) when expecting directional move with defined risk.
✅ 3. Never trade without a stop-loss ; even best setups fail in volatile markets.
✅ 4. Wait for the 15–30 minute structure to develop before taking directional trades.
✅ 5. Don’t average losers – instead, analyze the trade thesis and exit quickly if invalidated.
📊 SUMMARY & CONCLUSION:
• 🟢 Bullish Above: 24,788, Targets: 24,975 / 25,278 – 25,338
• 🔴 Bearish Below: 24,722, Targets: 24,593 / 24,451 / 24,294
• 🟧 No Trade Zone: 24,722 – 24,788 → Avoid initial trades, wait for breakout
• 🟩 Support Levels: 24,593 / 24,474 / 24,294
• 🟥 Resistance Levels: 24,975 / 25,278 / 25,338
• 📌 Key Rule: Let the structure confirm the bias – don't trade on emotions or pre-conceived notions.
✨ Final Note: Trade with discipline. Best trades don’t come every day — but risk-managed ones preserve your capital always.
📢 DISCLAIMER: I am not a SEBI-registered analyst. The trading plan shared above is strictly for educational purposes. Please consult with a SEBI-registered financial advisor before making any trading or investment decisions.
NIFTY : Trading levels and Plan for 29-May-2025📘 NIFTY 50 – TRADING PLAN for 29-May-2025
📈 Based on 15-min structure and key zones
📍 Gap Opening Threshold: 100+ points from previous close of 24,757
🔼 GAP-UP OPENING (Above 24,857):
If Nifty opens above 24,857+, it will open above the current Opening Resistance Zone: 24,748 – 24,786 , creating early bullish momentum.
✅ Plan of Action:
• Let the price settle in the first 15–30 mins. Avoid chasing green candles in the first 5 mins.
• If Nifty sustains above 24,891 (Opening Resistance), bullish momentum is confirmed. You may initiate long trades (Call options or Futures) with targets at 24,997 (Last Intraday Resistance) and trail SL at 24,891 .
• Once price reaches 24,997, partial profit booking is advised, as it’s a strong resistance zone.
• In case of a sharp pullback toward the 24,748–24,786 zone, observe for bullish reversal patterns (hammer, engulfing) before considering re-entry.
• A failure to sustain above 24,891 followed by bearish price action may lead to a trap. Wait for confirmation before going short.
🧠 Educational Tip: A gap-up followed by sideways movement or rejection at resistance often leads to profit-booking. Be cautious if momentum fades quickly.
⚖️ FLAT OPENING (Between 24,748 – 24,786):
This is a tricky Opening Support-Resistance Zone , often referred to as the "No Trading Zone" due to choppy price action.
✅ Plan of Action:
• Stay out initially – wait for either a breakout above 24,786 or a breakdown below 24,748 to take a directional trade.
• A 15-min candle close above 24,786 with volume confirmation can lead to upward momentum targeting 24,891 → 24,997 .
• If Nifty breaks and sustains below 24,748 , consider short trades toward 24,702 → 24,667 .
• Avoid overtrading in this zone; wait for clean structure and direction. Sideways zones are premium killers in options.
🧠 Educational Tip: Price often consolidates near open when inside a resistance-support overlap. Don't anticipate the move — participate only when confirmation arrives.
🔽 GAP-DOWN OPENING (Below 24,657):
If Nifty opens more than 100 points lower (below 24,657), it opens near the Opening Support Zone: 24,667 – 24,702 or possibly close to Last Intraday Support: 24,592 .
✅ Plan of Action:
• Observe early reactions around 24,592 . If this level holds and bullish reversal patterns emerge, you can go long for an intraday bounce toward 24,702+ with a tight SL below 24,592.
• If Nifty breaks 24,592 and sustains below on 15-min candle close, you may initiate Put trades or shorts, targeting 24,391 → 24,326 (Important Buyer’s Support).
• Be cautious near 24,391–24,326 zone — sharp reversals often occur there as it’s a critical demand zone.
• Avoid emotional shorting just because of gap-down; confirm weakness through patterns like breakdown and retest.
🧠 Educational Tip: Many retail traders short gap-downs only to be trapped in V-shape recoveries. Patience and pattern confirmation matter more than the gap itself.
🛡 RISK MANAGEMENT TIPS FOR OPTIONS TRADERS:
📌 Always follow 15-min candle close SLs for directional confirmation.
📌 Use spread strategies like Bull Call/Bear Put spreads on high IV days to limit risk.
📌 Avoid trades inside overlapping zones like 24,748 – 24,786 unless a breakout/breakdown occurs.
📌 Stick to maximum 1–2 trades a day. Avoid overtrading due to boredom or FOMO.
📌 Define your Risk:Reward ≥ 1:2 before entering any trade.
📌 Don’t average losing positions. Respect your stop-loss.
📌 Protect profits using trailing SL once targets start hitting.
📊 SUMMARY & CONCLUSION:
• 🟢 Bullish Above: 24,891 → Targets: 24,997
• 🔴 Bearish Below: 24,592 → Targets: 24,391 / 24,326
• 🟧 Opening Support-Resistance Zone: 24,748 – 24,786
• 🟩 Support Zone: 24,667 – 24,702
• 🟥 Last Intraday Support: 24,592
• 💚 Strong Buyer's Zone: 24,391 – 24,326
✨ Key Rule: Follow the flow — don’t predict it. Let price tell you what it wants to do and then ride the wave.
📢 DISCLAIMER: I am not a SEBI-registered analyst. This plan is shared purely for educational purposes. Please consult a certified financial advisor before making any trading or investment decisions. Trade at your own risk. 💼📉📈

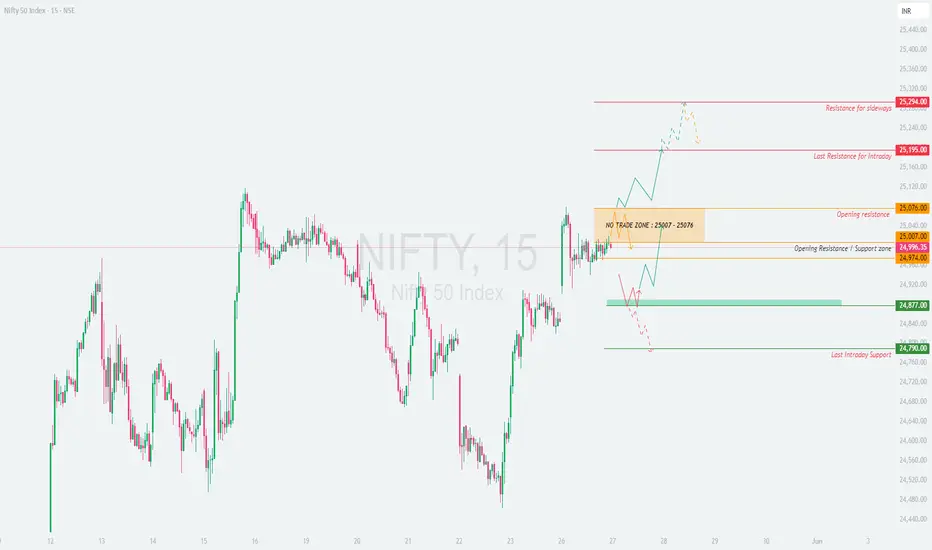
NIFTY : Trading levels and Plan for 27-May-2025📈 Nifty 50 Trading Plan – 27 May 2025
🔍 Chart Structure Analysis with Strategic Plan of Action
GAP-UP Opening (Above 25,076 – 100+ points):
If Nifty opens with a strong gap-up above 25,076 , we are stepping into the Opening Resistance zone , heading towards the Last Intraday Resistance at 25,195 and even towards 25,294 – Resistance for sideways price action .
✅ Plan of Action:
• Avoid early entries in the first 15-30 mins to let volatility settle.
• If price sustains above 25,195 on a 15-min candle close, potential momentum may push it to 25,294+ .
• Option buyers may consider buying CEs with tight SL below 25,076 on a retest for a favorable risk-reward.
• If price shows rejection from 25,195–25,294, watch for reversal patterns to scalp PEs with SL above 25,294 .
🧠 Education Tip: Gaps often trap retailers. Confirmation is key! Avoid aggressive trades at resistance without a proper base.
FLAT Opening (Between 25,007 – 25,076):
A flat start means price is within the NO TRADE ZONE (25,007–25,076). This zone offers low conviction as both bulls and bears wait for direction.
✅ Plan of Action:
• Wait and watch. Don’t force trades here.
• Trade only on clean breakout above 25,076 or breakdown below 25,007 with good volume .
• Avoid options buying here, theta decay will kill premiums.
• Look for directional breakouts post 10:00 AM for clarity.
🧠 Education Tip: No Trade Zone exists to protect your capital. Preserve energy for high-probability setups.
GAP-DOWN Opening (Below 24,877 – 100+ points):
A strong gap-down below 24,877 would take price into a decisive Buyer's Support Zone (24,877 – 24,791) or even to last intraday support at 24,790 .
✅ Plan of Action:
• If price holds above 24,790 – 24,877 zone , intraday pullback likely. Watch for reversal signals to scalp CEs with tight SL below 24,790 .
• Breakdown below 24,790 with volume may trigger further downside. Can aim for lower supports.
• Avoid chasing puts after a gap down—wait for a retest or consolidation before entry.
🧠 Education Tip: Buyer zones often act as magnets for smart money entries. Respect structure before shorting blindly.
💡 Options Trading Risk Management Tips:
• Use stop losses on candle-close basis and avoid mental SLs.
• Never buy options when premiums are inflated post-gap moves without confirmation.
• Use spreads (e.g., Bull Call or Bear Put spreads) on volatile days to reduce premium decay.
• Avoid over-leveraging—stick to 1–2 trades with proper planning.
• Hedge if you’re carrying positions overnight.
📊 Summary & Conclusion:
• 🔸 No Trade Zone: 25,007 – 25,076 (Avoid initiating fresh trades here).
• 🔼 Bullish breakout levels: Above 25,076 → Target 25,195 / 25,294
• 🔽 Bearish breakdown levels: Below 24,790 → Possible downside pressure.
• 💚 Buyer's Zone Support: 24,877 – 24,791
🔔 Remember: The market does not reward speed but precision and patience. Focus on execution based on structure and not emotions.
📌 Disclaimer: I am not a SEBI-registered analyst. The information provided is for educational purposes only. Please do your own analysis or consult your financial advisor before taking any trade. Trade safe and smart! 💼📉📈
Nifty 16th may directionAny kind of gap down
less than 1%, will see a
chance for me to buy and
take it higher
I have been stating 25234 for very long
IT WILL GET HIT

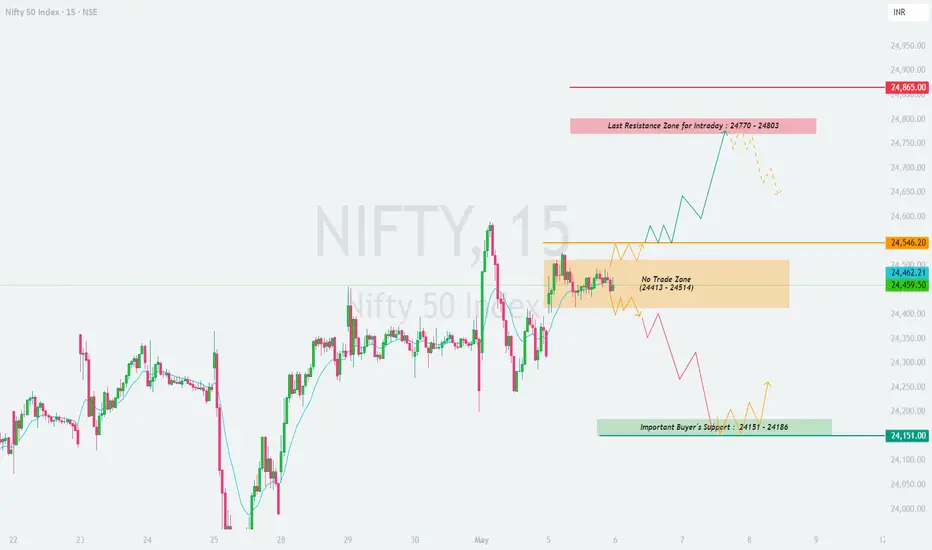
NIFTY : Trading Levels and Plan for 06-May-2025📅 NIFTY 15-Min Trading Plan for 6-May-2025
(Gap Opening Consideration: 100+ Points | Structure-Oriented Plan | For Educational Purpose Only)
📍 Previous Close: 24,459.50
📌 Important Levels to Watch:
🟧 No Trade Zone: 24,413 – 24,514
🟨 Crucial Resistance: 24,546
🟥 Last Resistance Zone for Intraday: 24,770 – 24,803
🟩 Important Buyer's Support: 24,151 – 24,186
🔻 Strong Breakdown Level: Below 24,151
🟩 Scenario 1: Gap-Up Opening (Above 24,546) 🚀
If Nifty opens with a gap-up above 24,546, it would mean the market has bypassed the No Trade Zone and broken out of immediate resistance.
Observe the first 15 minutes. If the price holds above 24,546, we could see a continuation move toward 24,770 – 24,803, which is the Last Resistance Zone for Intraday .
This zone may invite profit booking or supply pressure. If price reaches here too fast and starts rejecting (long upper wicks or bearish engulfing candles), consider booking longs or trailing your stop-loss.
Only a strong 15-min candle close above 24,803 can open gates for a rally toward 24,865 and beyond—though chances are slim unless macro triggers support it.
If price fails to sustain above 24,546 and slips back below it, expect a drop back into the No Trade Zone. Be cautious of false breakouts and whipsaws.
📚 Educational Insight: A gap-up directly into or above resistance needs volume and confirmation to sustain. Patience during the first 15-min bar is essential to avoid being trapped in fake momentum.
🟨 Scenario 2: Flat Opening (Within 24,413 – 24,514) ⚖️
A flat open in this zone means the market is indecisive and in a No Trade Zone . Avoid taking fresh positions unless the price gives a clear breakout or breakdown.
For bullish continuation, price must break and sustain above 24,546 with strong 15-min candle body and volume. Entry above 24,546 with SL below 24,500 may offer 1:2 RR toward 24,770+.
If price breaks down below 24,413, momentum may build on the downside and attract sellers, especially if broader indices turn weak.
A breakdown from this zone can push the price toward the Buyer's Support Zone at 24,151 – 24,186. Watch for bounce signals (e.g., hammer or bullish engulfing) in this area.
If price keeps consolidating between 24,413–24,514, stay out of the market—this is a chop zone. Wait for structure confirmation.
📚 Educational Insight: No Trade Zones are like neutral battlegrounds—wait for one side (bulls/bears) to clearly dominate before committing capital.
🟥 Scenario 3: Gap-Down Opening (Below 24,413) 📉
A gap-down below 24,413 can trigger early selling and bring the index toward the next key demand zone of 24,151 – 24,186.
This Buyer's Support Zone is crucial—look for strong bullish reversal candles in this area to go long with defined stop loss below 24,151.
If this zone fails to hold, and price sustains below 24,151, expect fresh downside selling with increased momentum.
Avoid shorting aggressively into support—wait for retest and rejection before building bearish positions.
Reversals from support zones often provide the best intraday buying opportunities if supported by structure and volume.
📚 Educational Insight: Strong supports can reverse price swiftly. It's better to wait for price to react at these levels before deciding on your position. Don’t chase fear-based trades.
🛡️ Risk Management Tips for Options Traders 📉📈
Avoid trading options within the first 5–15 minutes ; premiums are inflated and often trap traders in wrong momentum.
Focus on structure-based trades rather than emotions. Confirm breakout or breakdown with volume and candle body.
Define your maximum loss per trade (1–2% of capital) and respect it.
Prefer ATM/ITM options for directional trades and use hedged positions (spreads) in volatile sessions.
Always use stop-loss on premium or index level basis , and don’t average into losing trades.
Maintain a trade journal to track your psychology, setups, and performance over time.
📌 Summary & Conclusion:
✅ Gap-Up Above 24,546: Watch for sustained move toward 24,770–24,803. Be alert for resistance at those highs.
✅ Flat Opening in 24,413–24,514: Stay away unless a breakout or breakdown occurs. Wait for structure confirmation.
✅ Gap-Down Below 24,413: Watch for support action at 24,151–24,186 zone. Possible low-risk buying opportunity if reversal confirms.
🎯 Focus on structure, not speculation. Let the chart guide you—not emotions. Manage risk like a pro and avoid overtrading.
⚠️ Disclaimer:
I am not a SEBI-registered analyst. The above content is for educational purposes only. Please consult with your financial advisor before making any trading or investment decisions.