Nifty 50Nifty 50
15m Chart (Intraday Views)
Uptrend seems to be prominent.
RSI is in the overbought range which means we may correct a little to gain balance before continuing with the uptrend
MACD is giving mixed signals to we will ignore it.
Buy on Dips
1h Charts (Short to Medium Term Views)
Immediate support is at 14750 levels
Immediate resistance is at 15000 levels
RSI looks good as it is holding strong above the 50 levels
MACD is strong as well
Trend study shows that a new uptrend has been initiated
Buy on dips (wait for a dip) for 15000+ levels.
Daily Charts (Medium to Long Term Views)
Doji (bullish) followed by a confirmation candle shows strength
MACD shows signs of reversal towards a bullish zone
RSI has crossed the 50 levels yesterday and may confirm a bullish trend by EOD
Targets may be well over 15150 levels soon.
Niftylong

Nifty 50Nifty 50
Daily Charts (Medium to Long Term view)
The current trend is sideways but I am unable to decide if the pattern I see is bearish or bullish. So then we move on to other indicators and my favorite is RSI
RSI has a reversal and is moving upwards. We have to see if it maintains the upmove and crosses the 50 levels to be sure that Nifty 50 may be ready to fly.
The candles are still below the 20 moving average so I wouldn't be very confident yet.
Hourly Charts (Short to Medium Term view)
The purple line shows a double bottom which is a bullish pattern.
RSI resisted the 50 levels but I think that Nifty 50 does have a lot of strength and we'll see RSI cross into the bullish range.
MACD too is showing a reversal.
The current trend is still a downtrend but it can be broken soon.
15m Charts (Intraday views)
An uptrend is seen but not as strong as we'd like. We won't go short but we'll buy on dips.
RSI is taking support on 50 RSI which is a good sign.
MACD indicates weakness.
Buy on dips.

HOW POSITIONAL TRADING CAN BE DONE WITH THIS HELP IN NIFTYHi traders,
In this screenshot, I manifested the move for next week and marked the highly potential points to make your intraday trading and positional trading easy. If you follow the instructions shared in detail through this video. you will definitely earn this week. The link is given below from where you can access this video.
Yogesh Vats


Nifty Preparing For Bullrun (Pure Price Action)Nifty is very close to Weekly as well as Daily Support Zone, Daily candle is also taking support on 50EMA, I Think Bullish now

Nifty 50Daily Charts (Medium to Long Term)
RSI is still below 50
Candles are still below the 20 day moving average and the trenline
Heikin Ashi is giving us some good signals as yesterday was a confirmation candle which indicates that the correction might just be over
Market has been range bound between 14280 levels and 15350 levels since 11th Jan 21 so we cannot have an uptrend unless we break 15350 levels and close above it but this doesn't mean that we have a downtrend either, we are now going sideways
Hourly Charts (Medium to Short Term)
The downtrend line has been broken and confirmation candle was made yesterday
RSI is above 50
MACD is bullish as well
Heikin Ashi has made an upmove again followed by a confirmation candle
This means that even if we open in red, we might just push our way through as this chart shows strength
15m Charts (Intraday)
Again a clear uptrend
RSI holding above 50
but MACD showed a reversal towards the closing
We will buy on dip or as and when we see a reversal happening.

NIFTY Predictions for 24 March 2021NIFTY Predictions for 24 March 2021
Resistance R1 14971 / R2 14893
Support S1 14722 / S2 14630
Disclaimer: I'm not a Financial Advisor this is for educational purposes only, Before investing or trading please consult your financial adviser.

Nifty 50Nifty 50
Daily Charts (Long to Medium Term)
RSI is below 50 levels and it clearly gives us a bearish signal.
Nifty is taking a turn after breaking 2 trendlines which means that the markets may go either way.
I couldn't get proper reading using candlesticks so I shifted to Heikin Ashi. The green candle which means that we may see a bull rally soon has been formed. The candle which will be made today will be considered as a confirmation candle so we can take a final call for BTST by 3pm today.
Hourly Charts (Medium to Short Term)
This gives us a little confidence as we can see RSI pushing its way above the 50 levels.
The last candle closed above the 20 day Moving Average which again is a strong sign.
MACD has green bars and the lines are moving upwards so again a good sign.
I didn't miss Heikin Ashi which has a confirmation candle to indicate an uptrend.
15m Charts (Short Term and Intraday)
Candles are comfortable above the 20 day moving average which is a good sign.
MACD has the lines arranged properly and green bars (buying) is prominent as well so again a good sign.
Downtrend line was broken and the levels are sustained which shows the strength.
RSI too has sustained above the 50 levels.
Making Heikin Ashi a habit, clear upmove is being displayed.
*Everything looks good as of now.
Supports at 14472 levels
Resistance at 14830 levels

Nifty 50Nifty 50
CMP 14604
Daily Chart (Medium to Long Term)
The black line is called the simple trendline. I did not use the parallel trendlines as we already know that the markets are either at the lower support line or below it.
The current scenario is that we have broken the trendline in the lower level but this doesn't mean that the trend has been changed. It means that we have to wait till our charts give us further indications but surely, there is nothing to panic as of now.
Hourly Chart (Short to Medium Term)
I found a minor support at 14495 (the orange line). I call it minor because nothing major has happened on this level but there are small zones where 14495 did act as a resistance or support.
Trend is sideways but we can expect a bounceback as we are very close to the support level but we can only be sure once we crossover and sustain 14760 levels (purple line) as this level has some major action since 21st Jan 21 and this will act as a strong resistance.
RSI too is in a bearish zone i.e. below 50.
15m Chart (Intraday)
I have found a rounded bottom pattern being made. This is a bullish pattern but there is also a possibility of cup and handle which again is a bullish pattern. I am super excited and I think it's time for traders to go long but with a lot of patience. The markets are volatile and you need to wait and hold and have a lot of patience.

NIFTY TRADE SET UP HELLO FRIENDS,
HERE IS NIFTY BUY SET UP FOR LONG IN NIFTY AND BUY AT 14888 WITH STOPLOSS OF 14744 FOR THE TGT OF 15525 IN COMING DAYS .
HAPPY TRADING FRIENDS,

Nifty 50Nifty 50
Hourly Chart (Medium to Short term)
We are very close to a very important support level of 14667. Tomorrow will be a crucial decider whether the downtrend will be broken or are we going towards 14200 levels.
I am not being able to understand any patterns or trends in the current scenario and hence I will maintain my simple call of No Trade.
If you are a trader who can take risk, you can go long on Nifty with Stop below 14660 levels in spot. I feel that we will not break 14600 levels as it has been a very strong level since 12th Jan 21.

Nifty 50Daily Chart (Medium to Long Term)
The trend remains positive but it's just a notch away from breaking the trendline. 14745 is a crutial support if Nifty 50 decides to correct itself.
The candle has closed below 20 VWMA and it needs to fight its way back up and above these levels.
RSI here has taken support at the 50 levels and has tried to make a reversal. Let's hope that we see a strong bounce back today because Nifty 50 is very close to going into a correction mode which may be a big one this time.
MACD shows some big selling happening as well and is flying dangerous close to the border. If it slips we enter the bearish zone as well.
*We are hanging on the edge and I will stay away for today.
Hourly Chart (Medium to Short Term)
This chart signals that Nifty 50 is range bound between 14750 and 15250 levels. A strong breakout and really surprise.
MACD has taken the first step towards entering the bull zone. We will wait and watch to see if it follows up on the new bull zone.
RSI worries me as it has resisted the 50 levels and a reversal was made towards the downside.
15m Charts (Intraday)
The opening may be weak as the charts show us a strong downtrend but we will have to wait for the charts to make new candles inorder to understand the Intraday trend.
RSI too shows us a downtrend and we need to see a very strong reversal for a breakout to happen here.
MACD has just crossed the border here and is about to enter the bearish zone. This can change if we see a strong bounceback.
The entire trade will depend on the momentum that Nifty 50 might show. Also, this is a weekly expiry so we may see a very strong bounceback that we need to see.
It is better not to earn rather than making a loss so my call is No Trade for now!

Nifty FuturesNifty Future
Daily Chart (Overall long-term)
I've 2 trendlines (blue). The first one is cut-off and the second one is the trendline that we are following now. Daily candles are taking support here and we can see a very strong upmove if anything funny doesn't happen.
The black dots are Parabolic SARS. Parabolic SARS is an indicator which if down signals buying and if the dots are up means we may see a down-move. This indicator is giving us a buying signal as of now.
You'll see the the candle is also taking support on the 20 MA. The zone above 20 MA is bullish and viceversa.
The RSI has taken a turn upwards from the 50 levels which is also a signal of strength.
Overall the daily charts don't scare me as of now.
Hourly Chart (Short to Medium term)
The candle will have to make a very strong upmove above the 20 MA to enter the bullish zone which is very much possible. We can see weakness as the candle is currently below the 20 MA.
*20 MA can be treated as a current trendline for beginners.
RSI too needs to bounce back up as it has resisted the 50 levels which again is not a bull zone
Candles didn't give me many signals so I shifted to Heikin Ashi which does show strength though a strong upmove is still needed to be sure.
Overall, the trend doesn't look bearish but it surely indicates laziness on the hourly charts.
15m Chart (Intraday)
Parabolic SARS show a bullish signal
The candles are trading above the 20 MA which again is good
RSI shows a downtrend which again needs to change
My call here will be No Trade till the RSI shows a reversal above 50 levels.

Nifty FuturesClearly an uptrend and a gap-up opening will pull RSI above 50 to confirm a bullish trend. I've been saying that it won't be surprising to see Nifty hit new highs.
Please note that this is not a trading level. It's already high to buy and risky to sell so No Trade today

NiftyNIFTY 50
Daily charts show a clear uptrend. I would like to think that the correction is over now, or is it? RSI supports me here. If you look at the RSI, you'll see that the downtrend seems to have stopped here, just above the 50 levels and a slight, very slight up-move has been made as well.
Hourly charts look messy. The trendline has been respected but there is a pattern which can be seen which is called the Descending Triangle. This is considered to be a bearish pattern but if the prices break the upper trendline, the pattern can be broken as well. A bullish pattern called the Symmetrical Triangle can be seen here as well.
What worries me more is the RSI. If you see, RSI is struggling at the 50 levels and I really hope one big green candle comes our way and helps the RSI to enter the bull trend with strength. This factor is completely depended on the world market tomorrow.
We always use the hourly charts to understand the resistance and support. I've found a good support at 14865 levels and the resistance is seen at 15120 levels. I personally feel that Nifty 50 should break 15200 in this expiry itself but then as I've mentioned earlier, world markets have a big role to play.
Intraday charts or 15m charts show a Descending Triangle as well. Now that is something to worry about if the market don't open in green tomorrow. I am trying really hard to find a strong bullish pattern in the intraday charts but I am unable to do so. The only way we can expect a bull rally tomorrow if the markets open strong and stay strong unlike today where the markets opened strong but couldn't maintain the strength.
Strategy is No Trade but you can also follow the buy on dip strategy as discussed before.


Nifty FuturesNot sure but did Nifty Futures make a double bottom in 15m charts?
I think we can enter with a stop loss of below 14900 for targets of 15100 / 15150 / 15200
CMP 15008

Nifty FuturesNifty Futures
Intraday, 15m charts are quite surely overbought. Check RSI as it is above 80 which means a quick correction may be on its way. No, this doesn't mean that you can go short unless you are just too good a trader. What this means is that we need to wait for the right levels to re-enter in long positions.
Daily charts, as expected don't speak the same language. RSI has just bounced above 50, in the bull area in this time frame. Not only RSI but check Moving Averages. It has just crossed overand the resistance that I see here is at 15450 levels whereas a very strong support is too far at 14765 levels. So, the risk reward ratio doesn't seem good at this point.
The right entry level is at around 15000 and we could add more if Nifty goes down to 14900 levels. The stop loss is clearly below 14750 levels but I don't see that being triggered easily as the daily charts are clearly bullish.
I would also like to mention that 15500 level is strictly for profit booking.

NiftyFirst things first, Nifty is on an uptrend on the daily charts.
As discussed yesterday, Nifty took support on the trend line and bounced back from there. This was a good sign but what needs attention is that the candles have not crossed the decider (middle line) on the upside. We can let our guards down a little once this is done but till then, we have to be cautious.
Hourly charts give us a support at 14750 so you can go long, if you have to with a stop below 14750. Targets can be 15050 and even 15150.
We have already gone long yesterday and we should be looking at profit booking today so I would opt for NOTA (No Trade) today as the end to end risk to reward ratio, 14630 vs 15050 is not favorable.

NiftyGood Morning
Nifty (spot) gives us a gap up opening at 14865 levels as expected. My first target was 14900 in futures which can be considered achieved.
If the world markets support, we can see Nifty making new highs again in March itself.
New support has been made at 14635 levels so there should be nothing to worry about till Nifty breaks and sticks around below this level. Intraday resistance can be seen at 14993 levels. This, I am sure gives us a range for Nifty (Spot).
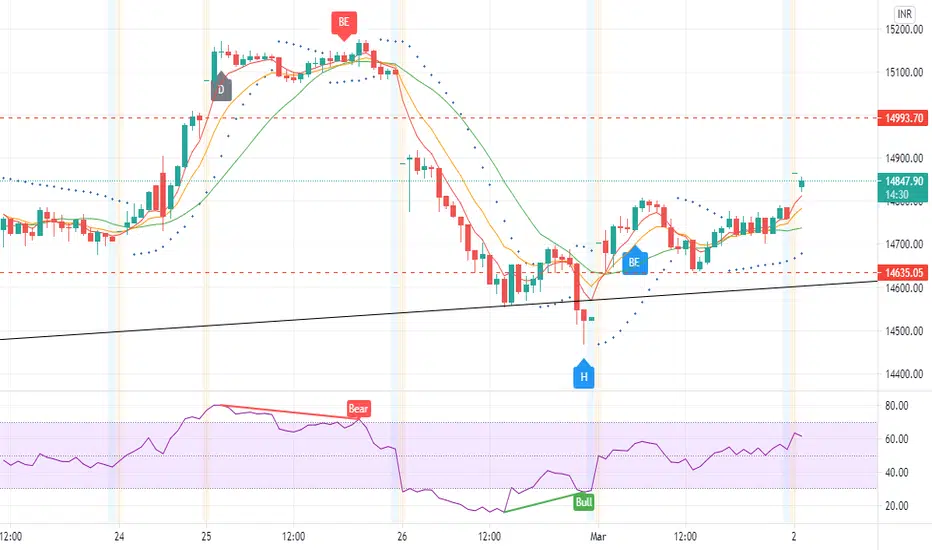
Nifty SpotNifty Spot
There was a Hammer (bullish pattern) in the 15m chart on 26/02/21 at 15:15 hrs.
14635 levels were from where Nifty had to bounce back but it slipped below it and closed at 14529. Nifty had made a high of 14498 on 11/01/21 which can be considered as a strong support now.
RSI has slipped well below 50.
It also shows a bounceback from the trendline levels which gives us a little confidence that the trend has not changed and is still an uptrend.
15000 levels are a very strong resistance so can buy with Stop Loss below 14498 for targets of 15000.
So, expect the global markets, Nifty doesn't show a lot of strength of it's own today but isn't bearish either.

EASY AND SIMPLE WAY TO GET NOTICED OF CHANGE IN TRENDHi Traders,
In this screenshot, You can see how to see the change in trend in an easy and simple way along with next week's plan for trading in nifty. For detail see the complete explanation in the video link given in the below box.
Yogesh Vats

NiftyRunning correction as expected yesterday. What next? Strategy remains the same, 'buy on dips'
Support can be found at 15000 and target can be around 15500.
Let me remind you that today is an expiry so I'd wait for the second half before taking a trade in Nifty.
Daily charts show that Nifty has taken support on 5 MA and have bounced back from there. We have to wait to see if this bounce is going to carry or Nifty needs to correct a little more.
What I understand is that a lot of positions have been exited due to the correction which means that Nifty should rise without a doubt but you never know what's hidden in this market.
