Nifty next one year viewHello viewers,
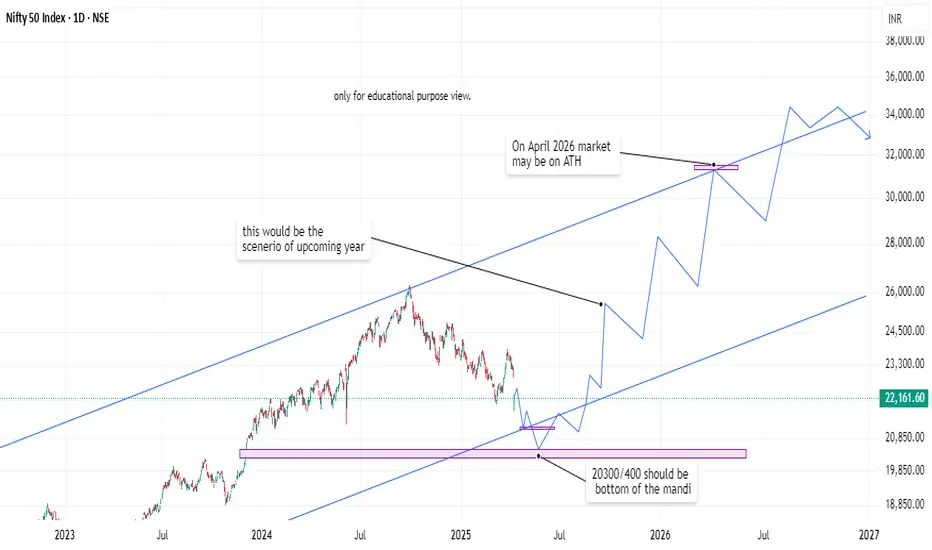
Today i observed elliot wave and gape theory anlaysis on the basis of channel range.
Nifty bottom is around 20400/20500 after that nifty may reverse for ATH al time high by april 2026 which is around 31000++ this is the overall analysis for upcoming year in simple view.
Disclaimer = do own analysis before any trade, this view is only for educational purpose.
Niftylong
NIFTY Prediction for Tomorrow – April 8, 2025What happened on last day:
As we discussed, NIFTY failed to sustain at higher levels and saw a strong rejection from the upper boundary of the falling channel, resulting in a sharp 4% intraday fall.
If we look at the chart now:
The market has decisively respected the resistance of the descending channel (marked in blue) and faced a strong bearish rejection. Price closed near the lower 22,000 zone.
It has fallen below the 13 EMA and 50 EMA , and is now nearing the support zone of 21,800–21,750 , which had previously acted as a bounce zone.
Price is below the 200 EMA and also below VWAP , confirming bearish bias.
RSI = 41 , now heading toward the oversold territory, showing growing weakness.
Volume spiked on the red candle — this shows strength on the downside move.
Support levels: 21,793, 21,162
Resistance levels: 22,200, 22,600, 23,000
If we look at the OI data:
PCR = 0.6 , clearly indicating a bearish stance.
There’s heavy Call writing at 22,000, 22,200, 22,500 and even at 22,600 levels.
Only visible Put OI is at 21,500 and 21,800 — which implies the support has shifted lower.
With INDIAVIX at 20.9 (+7.2 increase) , volatility has spiked, which aligns with today’s sharp move.
We are in the early phase of the April monthly expiry , so OI is still building up, but early bias is clearly negative.
If we look at the news & sentiment:
Global markets saw mild selling pressure due to rising bond yields and risk-off sentiment.
No major positive trigger from domestic macros.
News sentiment turned mildly cautious to negative with today’s fall and spike in volatility.
I am expecting
The market to remain bearish or sideways in the short term. If 21,800 breaks, we may see a move toward 21,160–21,100 zone. Resistance now lies at 22,200 .
Reasons:
❗Price rejected from upper trendline of falling channel
❗Price < EMA(13, 50, 200) confirms bearish momentum
✅ Volume spike on the red candle shows strong sell-off
❗PCR = 0.6 indicates dominant call writing and weak puts
❗INDIA VIX jumped 7.2 points – fear and volatility increasing
Verdict: Bearish or Sideways
Plan of action:
Sell 22,200 CE and 21,800 PE — for a bearish-biased range play.
Watch for breakdown below 21,800 for trend-following trades.

NIFTY STRONG ABOVE 23260 TARGET... 165 POINTS CHANCE UPSIDE NIFTY strong zone above 23260
If 5 min candle close this level 26260 applicable
Wait for active mode
Nifty buy above 23260
Stoploss.......23170......90 points
Target1........23340......80 points
Target2.........23425.....165 points
Disclaimer - This level only for educational purpose . Do ur own analysis

NIFTY : Trading levels and Plan for 01-Apr-2025📌 NIFTY Trading Plan – 01-Apr-2025
📊 Market Overview:
NIFTY closed at 23,179, forming a consolidation base near the Opening Support Zone (23,164 – 23,210). The index has shown sharp volatility in previous sessions, and its next move will depend on how price reacts at key resistance and support levels.
For a disciplined and well-planned approach, let’s analyze all possible opening scenarios and formulate a structured trading plan accordingly.
🔼 Scenario 1: Gap-Up Opening (100+ points above 23,275)
A gap-up above 23,275 suggests bullish momentum, but whether it sustains or reverses will depend on the key resistance zone (23,351 – 23,385).
✅ Plan of Action:
If NIFTY sustains above 23,275, expect a bullish move towards 23,351 → 23,385. If it breaks and holds above 23,385, the rally could extend towards the major resistance at 23,502.
If price faces resistance at 23,351 – 23,385 and starts reversing, expect a pullback toward 23,275 → 23,210. A breakdown below 23,210 could signal further weakness.
Avoid entering long trades directly at 23,351 – 23,385, as this is a potential profit-booking zone. Look for either a clean breakout or a bearish rejection before making a move.
🎯 Pro Tip: If the gap-up starts fading in the first 15-30 minutes, it indicates weak buying pressure, increasing the probability of a sell-off.
⚖ Scenario 2: Flat Opening (Within ±100 points, around 23,179)
A flat opening near 23,179 suggests indecision, where price action will decide the next direction. The critical range to watch is 23,164 – 23,275.
✅ Plan of Action:
Upside case: If NIFTY breaks and sustains above 23,275, it may test 23,351 → 23,385. Monitor price action near these levels before entering fresh longs.
Downside case: If NIFTY breaks below 23,164, it could slide towards 23,067 → 22,907. A breakdown below 22,907 would confirm further downside pressure.
Avoid trading inside the No Trade Zone (23,164 – 23,275), as price might consolidate before a decisive move.
🎯 Pro Tip: In a flat opening, wait for a strong 15-minute candle close above/below key levels before taking any trade.
🔽 Scenario 3: Gap-Down Opening (100+ points below 23,067)
A gap-down below 23,067 could indicate selling pressure, but strong buyers might step in around the 22,907 support zone.
✅ Plan of Action:
If NIFTY sustains below 23,067, expect a decline towards 22,907. A breakdown below 22,907 could extend the fall to 22,800 – 22,750.
If NIFTY finds support at 22,907 and rebounds, expect a recovery towards 23,067 → 23,164. A strong close above 23,164 would signal buyer strength.
Be cautious of bear traps – If the market gaps down but quickly recovers, it could trigger short covering, leading to a sharp upside reversal.
🎯 Pro Tip: If the gap-down occurs near a major support zone, wait for bullish confirmation (e.g., reversal patterns) before going long.
⚠️ Risk Management Tips for Options Traders
🔹 Avoid over-leveraging – Proper position sizing is key to managing risk.
🔹 Theta Decay Awareness – If the market consolidates, option premiums will decay rapidly.
🔹 Use Spreads for Protection – Instead of naked options, use spreads to control risk and improve trade probabilities.
🔹 Trade at Key Levels – Avoid impulsive trades; focus on defined support and resistance zones.
📌 Summary & Conclusion
📍 Key Levels to Watch:
🟥 Resistance: 23,275 → 23,351 → 23,385 → 23,502
🟧 No Trade Zone: 23,164 – 23,275
🟩 Support: 23,067 → 22,907 → 22,800
🔸 Bullish Bias: Above 23,275, targeting 23,351 – 23,502
🔸 Bearish Bias: Below 23,067, expecting a fall towards 22,907 – 22,800
🔸 Neutral/Choppy: Inside 23,164 – 23,275, avoid unnecessary trades
🎯 Final Advice:
Stick to the structured trading plan and execute only at key levels.
Avoid emotional trading—wait for confirmation before entering trades.
The first 15-30 minutes after market open will provide better clarity—observe price action before committing to a trade.
📢 Disclaimer
I am not a SEBI-registered analyst. This trading plan is for educational purposes only. Please conduct your own research or consult a financial advisor before making any trades.

Nifty 50 Index Analysis & Trade Setup (April 1, 2025)1. Current Market Overview
Last Close: 23,495.15
Day’s Range: 23,450.20 (Low) – 23,545.30 (High)
Change: -48.50 (-0.21%) – Minor bearish close
Key Observations:
The index faced resistance near 23,545 and closed slightly lower.
The 15-minute chart shows consolidation between 23,450–23,545.
The 1-hour chart suggests a broader range between 23,200–23,800.
2. Technical Analysis Breakdown
a) Support & Resistance Levels
Immediate Support: 23,450 (Day’s Low)
Strong Support: 23,200–23,400 (Previous swing low & psychological level)
Immediate Resistance: 23,545–23,600 (Day’s High & round number)
Strong Resistance: 23,800 (Key swing high)
b) Price Action & Trend
Bearish Bias: The index closed below the opening price, indicating selling pressure.
Neutral Zone: If 23,450–23,545 holds, expect sideways movement.
Breakout Scenario:
Bullish Break: Above 23,600, target 23,800.
Bearish Break: Below 23,450, target 23,200–23,300.
c) Volume & Momentum
The decline was not extreme, suggesting cautious selling rather than panic.
A retest of 23,500–23,600 could confirm direction.
3. Trade Strategy (Intraday/Swing)
A) Short Trade (Bearish Bias)
Entry Zone: 23,500–23,550 (Retest of resistance)
Stop Loss: 23,600 (Above day’s high)
Target 1: 23,400 (Minor support)
Target 2: 23,200–23,300 (Strong support)
Risk-Reward: ~1:2 (Favorable)
B) Long Trade (Bullish Reversal)
Entry Zone: 23,450–23,400 (Support bounce)
Stop Loss: 23,350 (Below swing low)
Target 1: 23,600 (Resistance)
Target 2: 23,800 (Major resistance)
Risk-Reward: ~1:3 (High reward if breakout occurs)
4. Key Takeaways & Final Thoughts
Bearish until 23,600 breaks – The close below 23,500 suggests weakness.
Watch 23,450 closely – A breakdown could accelerate selling.
Bullish only above 23,600 – Confirmation needed for upside momentum.
Ideal Strategy: Wait for a clear break (either side) before committing.
Final Note: If the market opens near 23,500, watch for rejection (short) or bounce (long). Adjust stops based on volatility.

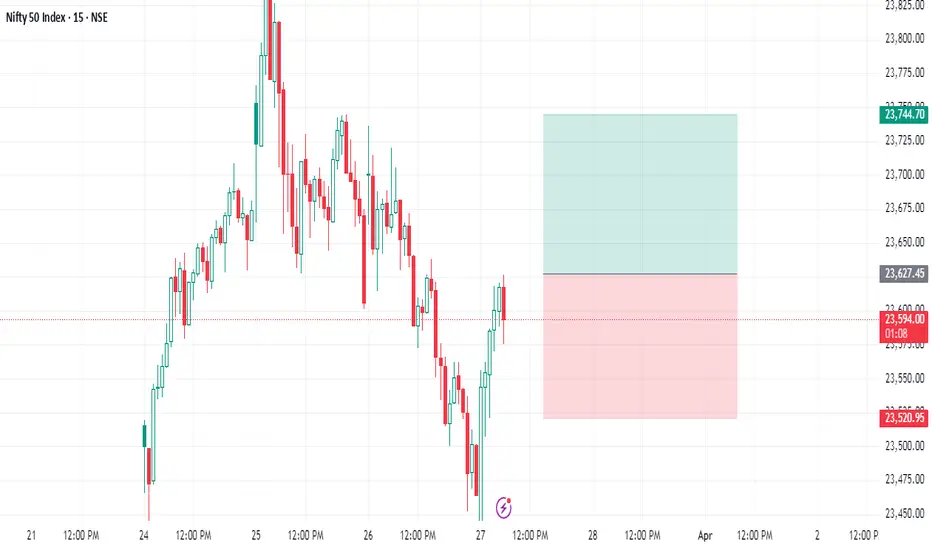
Nifty next Target 23750...112 points..SpikeNifty buy above 23627
Stoploss 23520....107 points
Target ........23740++ 112 points
Wait for active .. If active move oneside direct..check
This level only for education purpose only
Do ur own analysis
NIFTY : Intraday Trading levels and Plan for 26-Mar-2025
📊 Current Market Status:
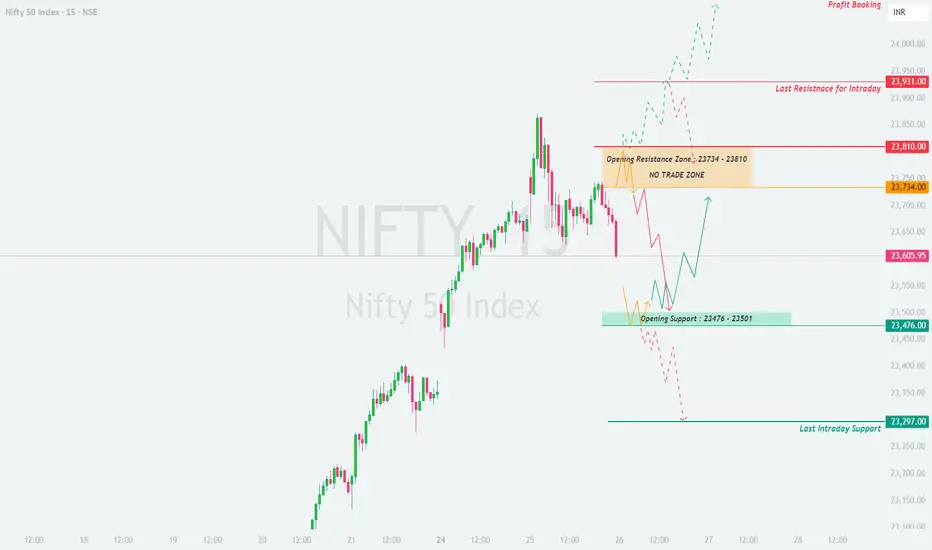
NIFTY closed at 23,605.95, showing a decline from recent highs. The price action suggests that the index is at a crucial juncture, with key resistance and support levels defining tomorrow’s possible movement. Let’s analyze the plan for different opening scenarios.
🔼 Scenario 1: Gap-Up Opening (100+ points)
If NIFTY opens above 23,734, it will enter the Opening Resistance Zone (23,734 – 23,810), which is a crucial level for bulls. A sustained breakout above this zone will determine further upside movement.
✅ Plan of Action:
If NIFTY sustains above 23,810, expect a move towards 23,931 (last intraday resistance). A further breakout above 23,931 could take it towards 24,087 (Profit Booking Zone).
If the index rejects 23,810 and starts reversing, look for short opportunities targeting 23,734 → 23,605.
Avoid trading within the No Trade Zone (23,734 – 23,810) unless a clear breakout or breakdown occurs.
🎯 Pro Tip: A strong gap-up near 23,810 might trigger profit booking, so avoid aggressive longs unless momentum is confirmed.
⚖ Scenario 2: Flat Opening (Within ±100 points)
A flat opening around 23,605 means NIFTY is indecisive, requiring confirmation at key levels before entering trades.
✅ Plan of Action:
Upside case: If NIFTY breaks above 23,734, it could retest 23,810, and a breakout above that can push it towards 23,931 – 24,087.
Downside case: If the index breaks below 23,605, expect selling pressure towards the Opening Support Zone (23,476 – 23,501).
Neutral Approach: Avoid trading within the No Trade Zone (23,734 – 23,810) unless a strong breakout occurs.
🎯 Pro Tip: If volatility is low, options traders can use Iron Condors or Straddle Sells for range-bound strategies.
🔽 Scenario 3: Gap-Down Opening (100+ points)
If NIFTY opens below 23,476, bearish sentiment might take control, and we must assess the strength of support zones.
✅ Plan of Action:
If price sustains below 23,476, expect a decline towards 23,297 (Last Intraday Support).
If price takes support at 23,476 – 23,501 and rebounds, a potential pullback entry can be considered, targeting 23,605 – 23,734.
Watch for trap setups—if NIFTY opens low but quickly reverses above 23,476, it could be a bear trap leading to a short squeeze.
🎯 Pro Tip: In a gap-down scenario, avoid panic selling and wait for a breakdown retest before entering trades.
⚠️ Risk Management Tips for Options Traders
🔹 Avoid over-leveraging – Trade within your risk capacity and manage exposure wisely.
🔹 Theta Decay Awareness – Options traders should be mindful of premium decay, especially near expiry.
🔹 Hedge Your Positions – Use spreads instead of naked options to reduce risk.
🔹 Wait for Confirmation – Never enter trades based on emotions; always wait for price action confirmation.
📌 Summary & Conclusion
📍 Key Levels to Watch:
🟥 Resistance: 23,734 → 23,810 → 23,931 → 24,087
🟧 No Trade Zone: 23,734 – 23,810
🟦 Support: 23,476 – 23,501 → 23,297
🔸 Bullish Bias: Above 23,810 for targets of 23,931 – 24,087
🔸 Bearish Bias: Below 23,476 for a move towards 23,297
🔸 Neutral/Range-Bound: If price remains between 23,734 – 23,810
🎯 Final Advice:
Follow levels with discipline.
Avoid overtrading in No Trade Zones.
Let the first 15-30 minutes settle before making aggressive trades.
📢 Disclaimer
I am not a SEBI-registered analyst. This analysis is for educational purposes only. Please do your research or consult with a financial advisor before making trading decisions.
🚀 Stay updated on live trading levels & setups!
NIFTY : Intraday Trading Levels and Plan for 25-Mar-2025📅 NIFTY 50 Trading Plan – 25th March 2025
⏰ Timeframe: 15-min | 📊 Index Spot Reference: 23,674
🔍 Opening Scenario 1: GAP-UP Opening (100+ points)
If NIFTY opens significantly higher and trades above the 23,750 mark:
Keep a close eye on the Opening Resistance Zone between 23,863–23,931 . This area has historically acted as supply pressure, and price may show signs of rejection or pause here. If price action shows exhaustion in this zone (long upper wicks or bearish reversal candles), it can offer a high-probability short opportunity with tight risk. If a 15-min candle sustains and closes above 23,931 , Nifty may continue its bullish momentum towards the next level around 24,089 – marked as the “Last and Strong Resistance for Intraday.” Avoid aggressive buying near resistance. Instead, look for a pullback entry post-breakout with SL below the breakout candle’s low.
🧠 Tip: Don’t chase price. Let it stabilize before entry. In options, use OTM puts to short with defined SL and strict risk reward of at least 1:2.
🔍 Opening Scenario 2: FLAT Opening (±100 points)
If NIFTY opens near Friday’s close (23,651–23,674):
Wait for the first 15–30 mins to settle volatility. The price is currently in the middle of a decision zone. Watch for directional cues near 23,582–23,651 . Holding above this zone with strength can signal a move towards resistance zones mentioned above. If the index breaks below 23,582 , it may test the next demand zone between 23,507–23,491 . For bullish bias, price must sustain above 23,651 with volume and momentum. Look for bullish reversal candles like Hammer or Bullish Engulfing for confirmation.
🧠 Tip: For flat openings, straddles or strangles can be considered in options, but manage the premiums with strict SL, especially if the index remains range-bound.
🔍 Opening Scenario 3: GAP-DOWN Opening (100+ points)
If NIFTY opens around or below 23,500:
Watch 23,507–23,491 zone for any immediate bounce-back reaction. If buyers step in with volume, a quick pullback to 23,582+ is possible. If price slips below 23,491 , then 23,368 becomes the last support for the day. Breakdown below 23,368 could lead to a sharp fall toward lower psychological supports. Reversal trades should only be taken if there’s a bullish candle confirmation near support zones with increasing volume. If Nifty stabilizes and forms a base near 23,368, short-covering rallies can be sharp and tradeable.
🧠 Tip: Use spreads (bear call or bull put) in high volatility gaps. Avoid naked options with aggressive sizing post gap-down as premiums get inflated.
💡 Risk Management Tips for Options Traders:
Always trade with a fixed capital allocation per setup – ideally 2–5% of total capital. Don’t hold losing positions past your defined stop loss – honor SL with discipline. For intraday option trades, use 5-min/15-min candles to trail SL for locking in profits. Avoid holding zero-value options till expiry unless it's part of a hedge. Focus more on setups with favorable risk-reward, not just option premiums.
📌 Summary & Conclusion:
✅ Upside Zones to Watch: 23,863–23,931 (resistance), 24,089 (extension target)
✅ Support Zones: 23,582 → 23,507 → 23,491 → 23,368
✅ Strategy Focus: Wait for clear price action in respective zones; avoid emotional trades on gap days. Respect the market structure and plan trades only with confirmations.
⚠️ Disclaimer: I am not a SEBI-registered analyst. This plan is shared purely for educational and informational purposes. Please consult with your financial advisor before making any trading decisions.

NIFTY Prediction for Tomorrow – March 25, 2025What happened on last day:
As we discussed, the NIFTY has been in a sideways accumulation phase, and it has now broken to the upside.
If we look at the chart now:
The market is trading just below the 200 EMA (1D-tf) , which is acting as a strong resistance. Price has shown strong bullish momentum and has successfully broken out from the descending PINK trendline , which had held the price for over 10 months.
Structure-wise, NIFTY is forming higher highs and higher lows , suggesting a clear shift in momentum from bearish to bullish.
Price is trading above the 13, 50, and 100 EMAs , but still below the 200 EMA , which remains the immediate level to cross.
RSI = 64 , showing strong bullishness but not yet in the overbought zone — bulls still have strength.
Price is also trading above VWAP , confirming healthy bullish bias on the day.
All important breakout levels, retest zones, and trendlines are clearly marked on the chart.
Support levels: 22,775, 21,987, 21,840
Resistance levels: 23,600, 23,870, 24,790
If we look at the OI data:
PCR = 1.1 , showing a strong bullish structure in the options market.
There is strong Put writing at 23,000, 23,100, and 23,200 levels which are likely to act as near-term supports.
On the upside, significant Call writing is seen at 23,600, 23,700, and 23,800 levels — making them key resistance levels.
We are currently in the last week of the March monthly expiry (27 Mar) , so this OI structure gives strong directional cues.
If we look at the news & sentiment:
INDIA VIX = 12.6 , showing low volatility expectations.
No negative macro or global cues, INR and crude oil are stable.
Sentiment across financial media is cautiously bullish , with attention on whether NIFTY can sustain above the 23,600 zone.
I am expecting
The market to be sideways to bullish unless it breaks above 23,600 decisively, which could lead to further rally toward 23,870 and 24,790 .
Reasons:
✅ Breakout from 10-month falling channel
❗Price > EMA(13, 50, 100) but just below 200 EMA (Bullish but watch for breakout)
✅ Volume spike confirms institutional participation
✅ Clean higher-low structure forming
✅ Above 50 EMA and approaching 200 EMA
Verdict: Sideways or Bullish
Plan of action:
Sell 23,600 CE and 23,600 PE — hold the position within range.
Exit one leg if price breaks on either side with momentum and volume.

NIFTY50 - TRADING NEAR KEY SUPPORT ZONESymbol - NIFTY50
CMP - 22250
The Nifty50 index continues to maintain a negative bias, with the price action suggesting that it remains within bearish trend. This indicates the continuation of the downtrend, though we are currently seeing the index testing key support levels. At the moment, Nifty is trading near the 22200 area, which is a critical support zone. Technical indicators are also hinting at the fact that markets are oversold at current levels. Given the underlying support zone & oversold conditions, there's a high probability of a short-term bounce before the downward momentum resumes.
Looking at the immediate price structure, we are likely to witness a potential retracement towards resistance zones around 22800 and 23000. These levels are in line with the Fibonacci retracement levels, offering opportunities to enter long positions with a favorable risk-reward ratio. Traders can look for a bounce from current support levels and expect a move towards these resistance zones.
we are now at a critical juncture where a potential bounce could provide opportunities for short-term longs.
Given the technical setup, I am taking long positions in Nifty Futures at CMP 22250. I will look to add more positions if the price reaches 22100-22050 range. My SL is set at 21970 to manage risk, ensuring protection in case the price fails to hold the demand zone and continues lower.
Key resistance remains around 23400. A sustained move above this range could suggest a potential shift from a bearish trend to a neutral or even bullish outlook. However, until the index decisively moves above these levels, the preferred strategy remains to sell at resistance and buy at support, capitalizing on any short-term retracements.
In conclusion, while the short-term outlook offers potential for a bounce, the broader trend remains bearish. Therefore, the approach should be to look for long positions at favorable support levels.
Disclaimer: The information provided here should not be construed as a buy or sell recommendation. It reflects my personal analysis and my trading position. Please consider this trading idea for educational purposes only. Thank you!

NIFTY prediction for tomorrow 5th March 25Nifty has been falling continuously for a month. If we look at the structure using price action.
If we look at the chart now:
The market is trading near the support zone. The market might take support at nearly 22,000 levels. Price is trading far away from the EMA, which shows the market is going to take some pullback to the upside. The market is going to be sideways for some time unless it breaks the Pink trendline to the upside.
Support levels: 21840, 21250
Resistance levels: 22775, 23488, 50 EMA, 200 EMA
If we look at the OI data:
PCR = 0.8, which shows a slightly bullish structure in the market. The market has 22100 as max pain. The market has good PE writing at lower levels; 22000 and 21900 have very good PE writing, which will act as good support in this area.
I am expecting
The market is to be sideways unless it breaks the PINK trendline.
Reason:
RSI = 21 shows a bullish structure. (Weak Bearish -> Bulls might start buying, soon)
Price < EMA(13, 50, 200), which indicates a good Bearish structure. (Bearish)
PCR = 0.8 indicates a slightly bullish bias direction in the market.
Price < VWAP shows a good Bearish structure in the market.
Verdict: Sideways
Plan of action:
follow the chart levels. You better go with the bound strategy.

NIFTY - LONGNifty showing Positive Consolidation near 22800 and multiple rejections indication of good base formation.
We might see 23200, 23300 & 23600 in upcoming sessions with Stop Loss below 22900 on CLosing basis.
Disclaimer: Please do your own analysis before investing.

NIFTY50 - A RETRACEMENT IS EXPECTED BEFORE FURTHER FALLSymbol - Nifty50
CMP - 23772
The Nifty50 continues to trade within a falling channel pattern, indicating a bearish technical structure. Currently, the index is testing key support levels near 22800-22700, which were identified as critical support zones in the previous analysis. Given the strong & key support area at these levels, there is a high likelihood of a short-term bounce before the continuation of the downtrend.
As of now, Nifty is encountering support around the 22800-22700 region, and I expect a potential retracement towards the 23170-23200 and 23420 levels before the downtrend continues. These levels are supported by the retracement nature of the fall, providing a good opportunity to enter long positions with favorable risk-reward at current price.
When Nifty was around 23720, I shared my short trade plan on Nifty, anticipating a 700-1000 point fall, with expectations for Nifty to test the 23000 and 22800 areas again. That fall has now played out, and we successfully captured a strong down move. As Nifty is trading at key support levels once again, I am anticipating a bounce from here before the downtrend resumes.
Given the current technical setup, long positions can be initiated around current prices, with additional positions being added towards the 22680-22650 area. A stop-loss should be placed below 22600. I expect a retracement of this fall, which could push Nifty to the 23170-23200 range and then 23420 levels.
The risk-reward at these levels is favorable for long positions. However, my overall outlook remains bearish, and I expect the downtrend to continue after Nifty touches the 23400 zone.
Key resistance levels remain around 23700-23850. Any sustained move above this range could signal a shift from a downtrend to a sideways or even bullish trend. Until then, the preferred strategy will be to sell at resistance zones and buy at key support levels for a retracement.
Disclaimer - Do not consider this as a buy/sell recommendation. I'm sharing my analysis & my trading position. You can track it for educational purposes. Thanks!

Nifty ready to move higher...Hello traders!
The market delivered exactly as we had expected for yesterday's trading. I've mentioned in the video idea what is to be expected for today's trading.
Not financial advice.
GLGT.

NIfty 23200 important Support swing tradeHello,
Nifty Retrace more than 50% of previous swing high and now at trendline support RSI oversold with slow selling volume is not active on sellers side also hidden divergence and oscilators are bullish bullish reversal possibilities with stop loss of 23180

NIFTY 50 is ready for a trending moveNIFTY has been consolidating this whole week. And now that the weekly Expiry is over today, it is ready for a trending move either side - to resume it's upward March towards 25000 OR to retest it's recent swing lows. Although it seems to be trading within a clearly defined Regression channel for now.

Nifty - 26300 or 27135 or 28165Nifty has moved above the inverted head & shoulder neck level indicating further up move and possibly for a Target - 26300 or 27135 or 28165
Hope and wish RBI cut rates or support the markets in some form helping the bulls.
This is positional view and one may expect these targets in 30 to 45 days or more.
Move could be quick in case RBI decisions support the markets.
Once the confidence emerges all the money which went out could enter at higher levels for medium to long term investment opinion.
Price should remain above the neck line. In case of any SL hunting price must move above neck line for bull run to continue.
our markets has turned to be short sellers paradise so option selling is only safer and profitable for positional view.

Nifty Long 24500 | Hourly View | Elliott waves Nifty now in wave C as shown in chart.
Right now wave 3 of c which should go min 24447 then with some halt final move towards 24551 min as of now.
Expecting some pullback and halt near 24500 before giving next move direction. Final destination is 24900-25000 for this move.

Nifty 50 spot 24421.10 by Hourly Chart view - Updated ReviewNifty 50 spot 24421.10 by Hourly Chart view
- Nifty sustaining along Rising Support Trendline
- Nifty Index attempting to breach the Resistance Zone

FIRST TARGET 27,000"Are you ready to elevate your game and dive into this extraordinary level of experience?"

Nifty - Bullish and taking a very major supportNifty after breaking multiple support levels now it seems to be taking major and crucial support. This support indicating a new ATH from here. Already big players has accumulated and even started giving higher level targets and buy targets for major Nifty shares. This level has come only at the cost of weak hands and short selling and not a bigger selling at all. At every dip DIIs has only accumulated the stocks. So Nifty is sure Buy as positional view. Most of the top Nifty shares are sure sure Investment. Its all Gold Mines.

Nifty 50 spot 23532.70 by Daily Chart view Nifty 50 spot 23532.70 by Daily Chart view
- 2 nos of Gap Down Openings are closed between 24350 to 25080 level range
- 2 nos of Gap Down Openings will get closed in next ATH creations process near ATH 26277.35
- Most probable Support Zone likely at 23200 to 23350 to anticipate for upside reversal prospective
- Next fairly strong Support Zone 22500 to 22650 for upside reversal prospective if the above Support Zone is broken
- Huge Downfall of 04th June, 2024 has closed the past 2 nos Gap Up Opening and 2 nos Gap Down Openings

NIFTY Bullish Harmonic Nifty 23520 after corrective wave from 24300 to 23500 there is EMA support, Trendline support, RSI oversold and bullish harmonic pattern can bounce as impulsive till 23750,23940,24100
