TARGET GIVEN ON AUG 21 IN NIFTY ACHIEVED ON AUG 28 SEE YOURSELF!Hi Traders,
1. On 21st August 2020, I wrote in a series of nifty blog about the target achieved yesterday (28/8/2020), is quoting as proof of my manifestation of the current move one week advance with the perfect rhythm of levels marked in the previous fig. by price in point No.1 of trading section " My final target of the previous post was an upper white line where price made a zone with today trading. So that will be achieved in the coming sessions. See the red dotted line where the price is closed today. This line was earlier resistance now it will act as support so if the price in the next session does not take out in both time frames of 15 min and 1 hour then the white solid line and the white dotted line are the first targets." . Here you can see price did not take out the red dotted line downside and mentioned it as support which took price to the white solid line in a few sessions. In the statement, I clearly mentioned " my final target of the previous post" means I was 99/% sure that price is going to achieve that target.
2. Now you can see I marked the price movement in a pink box that is showing that white line taken out condition was not met almost one and a half-day. That was a clear signal that no need to go long till taken out condition gets activated in both time frames. Once activated see yellow solid line target achieved. A pink circle showing a yellow solid line acted as stiff resistance the one whole day. Can anybody explain why in more than 206+ post every support and resistance when I mark only these react price follows my analysis without fail? See the grip of manifestation price never failed my levels. This the power of education. To create it in your analysis then the market is yours, money is yours. I another word I outline the complete movement of price in such a way price never reject. Proving in every analysis. You just need to understand my fig. The rest price will do Setting the previous fig. to compare with the current one.
Trading Plan for next week.
1. Price made micro-zone of yellow dotted line with a red line, It will be tough for the next session to take it out in both time frames for quite some time. Only next session opening if gap up sustains then you will see taken out the condition will fulfil. Otherwise, the price is expected to come to the yellow solid and pink dotted zone.
2. If price takes out the yellow dotted line in both time frames then a pink solid line will be the target. That should be the final target of this uptrend where all positional long should be covered.
3. on the contrary, if yellow solid and pink dotted line is taken out downside in both time frames of 15 min and 1-hour then uptrend will change to the downside. Then all positional long should be covered.
4. For new reader writing about taken out condition which is quite important to obey in my analysis:-
Taken out condition works in the two-time frame combination for daily( 4 hr + 1 day) analysis. Similarly, work for lower time frames is also a two-time frame combination. For intraday trades 1 hr with 15 min. For taken out condition price has to complete in both time frames. Aggressive traders can take that side position in a lower time frame with the stop loss of breached candle low. In both the time frames given line is breached by a candle that candle high is to be breached by next candle and close should be above the previously breached candle. This is how taken out condition is being implemented.
YOGESH VATS
Disclaimer:- All trading positions should be taken from consulting your financial planner. This study is for educational purposes only.
Niftylong

Nifty is holding to it's supportNifty is holding to it's trend line support. As long as it's holding it, I am bullish on it. MACD is also closing in for a long.
So, the target remains 12240 and Stop Loss has been moved to 11390.

nifty shortif u can find the similarity
u will make money 2mrw
blind short if nifty opens lower than today's low

Nifty breakout buy I hope you can now see how NIFTY represents an excellent low risk profit entry setup allowing you to trade in the market.Take positions so that the risk/reward is in your favor.
Knowing why, where & when a strong reversal signal is being generated will be the only way to capitalize on your technical analysis .
Disclaimer: It should not be assumed that the methods, techniques, or indicators presented in these chart will be profitable or that they will not result in losses. There is no assurance that the strategies and methods presented will be successful for you. Past results are not necessarily indicative of future results. You should not trade with money that you cannot afford to lose. Example presented in these chart is for educational purposes only and it should not be assumed that these are indicative of ordinary trades. These setups are not solicitations of any order to buy or sell. The publisher assume no responsibility for your trading results. There is a high degree of risk in trading.

Nifty near supportNifty has as yet maintained it's support level, so I am still bullish on it. It has closed way above it's support of 11400, even it's low was above 11400, well above it's stop loss of 11353. So, I am still Bullish on it, till it breaks it's support trend line.
Target remains 12240, Stop Loss 11350


Nifty is in a Narrow range with spinning topsNifty 50 has spent a month in 11000 range. It's near it's support and resistance. It's in a narrow triangle wedge, preparing itself for a big breakout. The shape of the wedge suggests an upward movement. The 4+ month long rally suggests a correction is due, correction - not crash. So, buy nifty with caution.
If you scratch below the surface, a powerful sector rotation is happening. So, right now trade Nifty with caution and focus on individual shares.

NIFTY 11600 IS ON THE WAYHello Guys,
Hope You All Are Fine And Fit..
Here we are discussing about Nifty Next Trend, As per basic evaluation of chart with volume as well future and option OI, Nifty Can show 11600 Figure next week.. Just Focus on the trend o of Monday, There are huge Positive break out can be visible in coming days..
Hope this short Evaluation can hello you to understand nifty next trend..
Thanks,
-UD Trade

NIFTY50 CRUCIALNIFTY is trading at the crucial area which already tested the CHANNEL SUPPORT LINE on 14th August @ 2:15 PM.
hence expected to break the channel at this time, therefor it is good to close the swing trading for long position.

TWO WEEKS AGO GIVEN TARGETS WITH DIRECTION ALL ACHIEVED SEE HOW Hi Traders,
1. On the 3rd of August 2020, I mentioned in my post of nifty wherein point no. 1 of the trade plan is quoting for your consideration. " I made a blue dotted line, if price opens gap down and takes the support of this line and gives close above the sky blue trendline then one should cover positional shorts. On the contrary, if the price opens gap up and sustains above sky blue line by giving close above it then no more shorting for time being." Here you can see I gave the condition of the gap down which did not happen next day trading session and price moving up. From that day this low was not even tested once and the price remained almost 18 days up. I clearly mentioned on the contrary condition that NO MORE SHORTING and see price did not fall from that blue trendline condition. When I write my conditions all are written with confidence after the activation, with very less chances to fail. More than 205+ post on record. Earlier I used to post every day but now I manifest complete moves in such a way that worked more than two weeks. See how?
2. In the current fig, I marked a green circle showing you resistance taken on the same level where I made resistance. similarly, a white color circle showing you the support of my choice of Ema that you will not get in any book. If you see maximum support on white color Ema and only one support on yellow ema. Both Emas along with support resistance worked so precisely that if anybody followed them properly would have been earners these days. I gave you one white support to see how precisely price took support breaching yellow Ema marked in the red circle. Nobody uses this combination of Ema except me and works well. In the setting chart below of the last post, you can compare all levels with current fig and see yourself how more than two weeks' price behaved around my levels so well.
Trade Plan for next session
1. My final target of the previous post was an upper white line where price made a zone with today trading. So that will be achieved in the coming sessions. See the red dotted line where the price is closed today. This line was earlier resistance now it will act as support so if the price in the next session does not take out in both time frames of 15 min and 1 hour then the white solid line and the white dotted line are the first targets.
2. On the contrary, If price takes out a red dotted line downside in both time frames then support white lines target. If price takes out this support line further down then uptrend will change into a downtrend for the coming days.
3. The yellow solid line will act as resistance if taken out in both time frames then the yellow dotted line will be the target. If the yellow solid line is not taken out then up trend can change to downtrend no more positional longs.
4. For new readers taken out condition is as follows:-
Taken out condition works in the two-time frame combination for daily( 4 hr + 1 day) analysis. Similarly, work for lower time frames is also a two-time frame combination. For intraday trades 1 hr with 15 min. For taken out condition price has to complete in both time frames. Aggressive traders can take that side position in a lower time frame with the stop loss of breached candle low. In both the time frames given line is breached by a candle that candle high is to be breached by next candle and close should be above the previously breached candle. This is how taken out condition is being implemented.
Yogesh Vats
Disclaimer:- All trading positions should be taken from consulting your financial planner. This study is for educational purposes only.

Clear BreakoutToday is a Clear Breakout!
Yesterday close was slightly above Fibonacci retracement level of 11377. Today, @ 15:20 hours, if it closes above yesterday's close - 11386, you can go long. Stop Loss will be at previous close 11386 or slightly below Fibonacci level of 11377, or previous resistance of 11353. Below 11353, sell everything!
Exit possibilities when it hits the above resistance trend lines...
First major resistance is at 12272

NIFTY flag pattern observed!| Bounced from 11400Nifty - Technical Analysis:
-Nifty gapped up today but closed at 11421 below the opening price at 0.2%
-Nifty saw resistance around 11450 but took support at 11400 and bounced back
Market - Driving Factors:
-Zee Entertainment, GAIL, Bharti Airtel, Tech Mahindra and Maruti Suzuki were among major gainers on the Nifty, while losers included Bajaj Auto, Nestle, ONGC, Coal India and Wipro.
-Among sectors, IT, pharma and FMCG ended with in the red, while buying witnessed in the banking & financial, energy and infra sectors
-Indian rupee opened higher at 74.69 per dollar on Wednesday versus previous close of 74.76, amid buying seen in the domestic equity market.
Nifty - Outlook for Thursday, 20th August:
Nifty saw a good gap-up in the morning but erased gains during the final hour. Flag pattern is being observed where NIFTY took support twice around 11400. We could see a good up-move when it breaks out of the flag to 11500.

Nifty is Bullish!Nifty has taken support at the channel trend line. It has made a strong marubozu candle. It has room to move up.
My view for tomorrow is Bullish...

NIFTY IS TRADING AT THE COMPLICATED LEVELIf NIfty shoots upside it can topout at the previous high @ 11341.
if it breaks down 11165 then it can trade below the neck line placed at 10880.
Upside target : 11243, 11300, 11341, final 11377
downside target : 11111, 11055, 10880 , if the neck line is broken then the direct target will be 10580 and 10551 which is 1.618 level
and the STOPLOSS HUNT IS till @10400.

11325 broken will go for longs and my targets were 11510-750 Nifty Making HH & HL continuously showing strength
Now we are at Distribution zone where selling was emerging since 22 July .
after that we see a slight retracment towards 10890 levels
now again we are at top of that distribution zone
yesterday was a gap up which didn't hold -----its weakness as we were in distribution zone
will think of shorts only below 11235 levels

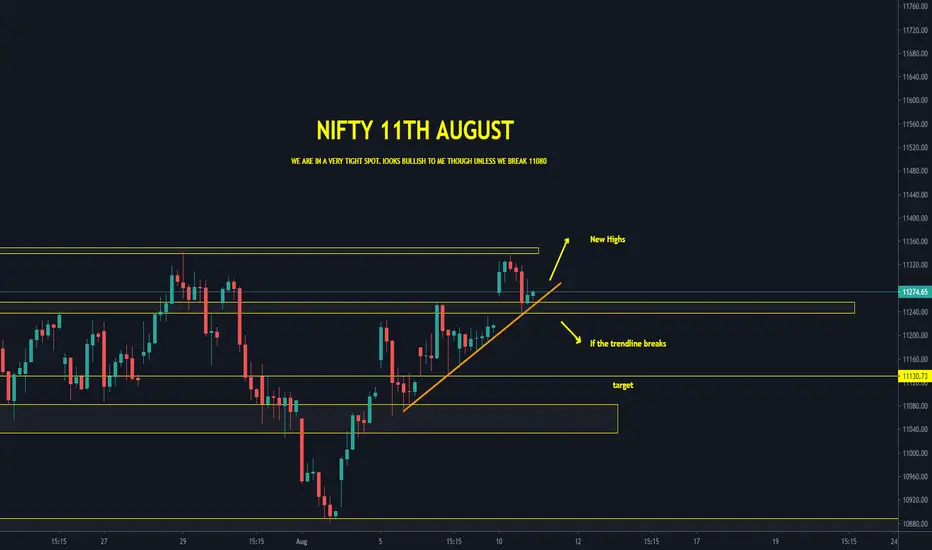
NIFTY LONG ANALYSIS WITH REASONINGAnyone predicting the market would be lying at this point, we can all speculate but things are pretty uncertain with Nifty at the moment. But considering we're in uptrend, either it should touch 11300 and break the new high or touch 11300 and then fall. also, on 1 hour TF there was a triangle pattern which broke in positive end to support this hypothesis. In both the case our target should be achieved. I am not as confident with this trade as I am with most of my trades. ( you can check all the other Ideas most of them went exactly as we planned )

NIFTY Intraday tading ideanifty has the support of 11100-11050, anywhere you find a convincing green candle in this range you can initiate buy call. and if this level gets broken more fall can be seen.
Conversly 11250 is seems to resistance for nifty. same strategy to follow. Means, if you fing a good convincing red candle near this level, SHORT and if broken one can go long.
Happy trading Happy Weekend

Nifty buy on dips :)I hope you can now see how Nifty represents an excellent low risk profit entry setup allowing you to trade in the market.Take positions so that the risk/reward is in your favor.
Knowing why, where & when a strong reversal signal is being generated will be the only way to capitalize on your technical analysis .
Disclaimer: It should not be assumed that the methods, techniques, or indicators presented in these chart will be profitable or that they will not result in losses. There is no assurance that the strategies and methods presented will be successful for you. Past results are not necessarily indicative of future results. You should not trade with money that you cannot afford to lose. Examples presented in these products are for educational purposes only and it should not be assumed that these are indicative of ordinary trades. These setups are not solicitations of any order to buy or sell. The publisher assume no responsibility for your trading results. There is a high degree of risk in trading.

GIVEN TARGET ON 25TH JULY ACHIEVED IN NIFTY TODAY WHAT NEXT ?Hi Traders,
1, On 25th July 2020, I gave the target of the green dotted line is achieved today with such perfection that selling came exactly from that line is quoting as proof of my statement in point no.1 of a trading plan. " the pink dotted line is now next taken outline if it is taken out in both time frames then the green dotted line is next target. Aggressive traders can take a position on the long side when one condition of 15 min is fulfilled but with the stop-loss of 1 hour breached candle. Always put like this for aggressive traders. I prefer to let the position satisfied both times then go on that side." Here you can see what you see today was manifested four days back when the price was in the range. See I circled in red a Doji candle showing you exactly the level achieved and then gave you selling. There are so many supports and resistances in the chart but I give you only that where the price is eager to react tremendously since my first post on this platform. This is a question of thinking?
2. See the perfection of all lines whether pink, white, and green all work so nicely that I am controlling them. The feel is that I made these lines much before the move setting a previous chart for authentication of this sort of price action. I believe in consistency of strike rate, not some times hit, sometimes miss. Proving in every blog. Just to get you all motivated that you also can do this by putting hard work to learn this skill. green circles are showing perfect support and are showing resistance.
3. See the condition was fulfilled in both time frames, as nifty has more strength than BNF, therefore price remains in a trending mode. The result after the condition achieved price hit the target. But in case Bnf condition achieved price do not hit the target immediately as it is in range-bound mode. One should know to trade in both modes. Have been shared in many posts.
4. Let me take an educational query from the comment box this will also enhance you knowledge to understand candle stick many of you are going through the recommended books.
Sir sorry again bothering you during trading hours. Below query is for educational purpose as shared in TG channel as well:
" Dragonfly doji in an uptrend. if high of breached candle breached this candle but close it below its high is a valid pattern and price should move down"
Is this statement valid in Nifty intraday today as this candle we see as hourly not daily.
yvatsji
3 hours ago
@wadhwaamit4, if a dragonfly is closed above-breached candle high then it's valid as taken out condition, prior next candle should not close dragon fly low.
Trade Plan for the next session.
1. I made a pink solid line If price opens gap up and sustain there for 15 min to 30 mins and then come down and breach it by giving closing below it then price can show you more fall. On the contrary, If the price opens gap down and then breaches it upside by giving closing above this line then price can go range-bound for sometimes.
2. If the green dotted line is taken out in both time frames then white upper line is the target.
3. If price takes out the lower pink dotted line in 15 min then uptrend will convert into a downtrend. Rember nifty is more strong than BNF. For new readers writing about taken out condition as follows:-
Taken out condition works in the two-time frame combination for daily( 4 hr + 1 day) analysis. Similarly, work for lower time frames is also a two-time frame combination. For intraday trades 1 hr with 15 min. For taken out condition price has to complete in both time frames. Aggressive traders can take that side position in a lower time frame with the stop loss of breached candle low. In both the time frames given line is breached by a candle that candle high is to be breached by next candle and close should be above the previously breached candle. This is how taken out condition is being implemented. The rest price will decide.
Yogesh Vats
Disclaimer:- All trading positions should be taken from consulting your financial planner. This study is for educational purposes only.

ON JULY 21 CAUTIONED ABOUT RANGE BOUND SAME SEEN WHY?Hi Traders,
1. On the 21st of July 2020, in point no. 2 of the trading plan I clearly wrote the possibility of range-bound trade is quoting as proof of my statement ". If price open gaps up and does not sustain in 15 min come back to the pink line then it means the price is going to range-bound in the coming hours between the pink and red dotted line. " Here you can see price opened gap up and did not sustain come back under pink line and later on in three days remained range-bound yellow line showing this move. Can you imagine nifty remains in this phase three days already manifested four days back? If a trader is having this much information then trade can be easy just by seeing small - small clues price provides.
2. The first clue on July 22, price opened up and could not sustain by making a Range candle many of you are not aware of this concept, this time price gave me the opportunity to discuss with you. To see the effect of this information. I quote one statement of the previous post in point no.1 of trade plan " I made a pink line to move to the green dotted line it has to be taken out in 15 min time frame only. Because the white line is already taken out in a 1-hour time frame. Now the days market is moving with a little different style. That is after taken out condition it goes into range-bound trading." Here this statement clearly shows if the market takes out in 15 min the whole day price did not take out the pink line on July 22, in this time frame. Plus I was talking about a different style of market. i.e after taken out came into range-bound trade by triggering sl. Range bound candle was a clear indication that the pink line is not good for taken out condition. The new resistance is the high of range-bound candle would be used as taken out condition. Had I updated my post the next day, You would have got that information. As you know with my engagements do not find the time .
3. I circled an uptrend in green then market made range candle not taking out the low of this candle even took the support of white line shows price is going into range til high of this candle is taken out. Same seen in price action later on for three days. I saw some comment traders considering still the pink line for taking out. That is because I last four months this type of case was not seen in price action so how could I discussed earlier. Today I showed this classic example in detail. so that this sort comes in future you all candle it.
4. Now discuss the stop loss for the taken-out condition assuming for while that pink line is actual line fit for this. See candle no. 1 breached the pink line then my sl would not be the low of that candle. It would be the candle showing some buying pressure that is the previous candle. And you see price haunted the low of this candle and resumed its an uptrend. So always remember stop loss will not be exact low of that candle you need to provide some buffer of some points. This stop loss should be used by positional traders. Intraday traders once put the stop loss of previous candle low then trail it. I know after discussing in such detail there will be few traders who will not put his efforts to understand it rather will ask some low intelligence questions. Because of putting their own efforts. Setting the previous fig for your better comparison of my statements with the current one.
Trading Plan for the next day.
1. Since I shared how the taken-out condition changes with range candle so the pink dotted line is now next taken outline if it is taken out in both time frames then green dotted line is next target. Aggressive traders can take a position on the long side when one condition of 15 min is fulfilled but with the stop-loss of 1 hour breached candle. Always put like this for aggressive traders. I prefer let the position satisfied both times then go on that side.
2. On the contrary, if white line is taken out on both time frames then red dotted line will be the target. If you get brown color Ema above the red dotted line then it will be the target.
3. If green dotted line is taken out in both time frames then white upper line will be the next target. For new readers, I write taken out condition which is as follows:-
Taken out condition works in the two-time frame combination for daily( 4 hr + 1 day) analysis. Similarly, work for lower time frames is also a two-time frame combination. For intraday trades 1 hr with 15 min. For taken out condition price has to complete in both time frames. Aggressive traders can take that side position in a lower time frame with the stop loss of breached candle low. In both the time frames given line is breached by a candle that candle high is to be breached by next candle and close should be above the previously breached candle. This is how taken out condition is being implemented.
YOGESH VATS
Disclaimer:- All trading positions should be taken from consulting your financial planner. This study is for educational purposes only.

Nifty View [20 July 2020]Nifty likely to resume its uptrends towards 11000 levels and might go till 11200

PINK TARGET ACHIEVED IN NIFTY WHAT NEXT SEE IN ANALYSIS?Hi Traders,
1. On 14th of JULY 2020, I mentioned in point no.1 of trading plan section is quoting as proof of my statement consider the conviction of this point ."One yellow line is made if this is taken out in 15 mins then the price will move to the white-green zone. Otherwise down move will continue to blue dotted line downside." Here you can see generally I mention two condition for taken out concept but this time I wrote only one condition of 15 min. And priced reached white green zone on July 15 . See the level of perfection could not take out price beyond that zone almost 2 hous after reaching that level. On same level in last hour you saw big bearish candle. Why in every chart the levels I provide you react so accurately react, is matter of your thinking.
2. Next day July 16 , Since starting of session till end this shared zone three days back was not taken out . On July 17 price opened gap open and took rally from same zone. This is the level of manifestation of moves three days back. On 3rd hour of this day price taken out this zone and gave you rally to pink zone. For your consideration setting July 14 fig where pink line was alredy marked and you can see that level was acheived on third dayof trading. All levels shared and complete trade was manifested in well advance of these moves. Experienced analyst can not predict consistently all moves of market but here you get regular performance of this level. That is why I say BASIC KNOWLEDGE + MY ANALYSIS = PROFIT
3. There are good educational replies in every post comment box genuine seekers should see all of them. Setting last fig . to better understand compare with current fig. below.
Trading Plan Of Next Session.
1. The pink line condition of 1 hour is not satisfied by price so I will wait to see this condition activated only then I will go long with target of the blue dotted zone.
2. In any case If price open gap up near blue dotted line then see price action price, can come back to pink line. So I will not try to trade near blue dotted line till I get clarity.
3. If the market once completed taken out condition at pink line and reached to the blue dotted line and comes back to pink line and takes it out on 15 min time frame then I will leave my longs. The red arrow shows that condition. Green arrow shows the condition of taking out for pink line and target.
4. In any case, price takes out blue dotted line in both time frames then white line is my target. For new readers I write taken out condition so that they can understand what is meant by it as follows:-
Taken out condition works in the two-time frame combination for daily( 4 hr + 1 day) analysis. Similarly, work for lower time frames is also a two-time frame combination. For intraday trades 1 hr with 15 min. For taken out condition price has to complete in both time frames. Aggressive traders can take that side position in a lower time frame with the stop loss of breached candle low. In both the time frames given line is breached by a candle that candle high is to be breached by next candle and close should be above the previously breached candle. This is how taken out condition is being implemented.
The rest market will decide. But like to maintain my strike rate every time with great great confidence.
YOGESH VATS
Disclaimer:- All trading positions should be taken from consulting your financial planner. This study is for educational purposes only.
