NIFTY KEY LEVELS FOR 22.12.2025NIFTY KEY LEVELS FOR 22.12.2025
Timeframe: 3 Minutes
Sorry for the delayed post.
If the candle stays above the pivot point, it is considered a bullish bias; if it remains below, it indicates a bearish bias. Price may reverse near Resistance 1 or Support 1. If it moves further, the next potential reversal zone is near Resistance 2 or Support 2. If these levels are also broken, we can expect the trend.
When a support or resistance level is broken, it often reverses its role; a broken resistance becomes the new support, and a broken support becomes the new resistance.
If the range(R2-S2) is narrow, the market may become volatile or trend strongly. If the range is wide, the market is more likely to remain sideways
please like and share my idea if you find it helpful
📢 Disclaimer
I am not a SEBI-registered financial adviser.
The information, views, and ideas shared here are purely for educational and informational purposes only. They are not intended as investment advice or a recommendation to buy, sell, or hold any financial instruments.
Please consult with your SEBI-registered financial advisor before making any trading or investment decisions.
Trading and investing in the stock market involves risk, and you should do your own research and analysis. You are solely responsible for any decisions made based on this research
Niftynse

ACC | On the Verge of a Breakdown? | Daily Chart | Bearish Bias
📉 Summary
ACC has been compressing into a descending structure, forming Lower Highs since 24 April 2025, while holding Equal Lows near ₹1770 since 03 March 2025.
Repeated tests (4+ times) of the same support zone have reduced its strength, hinting at a potential breakdown setup.
Price action suggests sellers are absorbing demand every time the stock revisits this level — a classic bearish continuation structure.
📌 Structure Breakdown
1. Lower Highs (24/04/2025 onward)
- Each rally has been weaker than the previous one - Shows sustained supply and lack of aggressive buyers.
2. Equal Lows at ₹1770 (03/03/2025 onward)
- Multiple tests → Support weakening.
Hammer-type candles here indicate buying attempts, not strength — repeated hammers near support often show demand exhaustion, not reversal.
3. No Recent Swing Lows
- Due to tight compression, reference swings are taken from the 2023 structure, which aligns well with projected breakdown targets.
📉 Trade View: Bearish (Daily Time Frame)
🔻 Breakdown Conditions (Mandatory)
Enter ONLY IF:
✔ Price closes below ₹1770
✔ Breakdown candle is a Thick Red Marubozu
✔ Volume is higher than the 20-day average
✔ Close is below support, not just an intraday wick violation
This ensures you avoid a fake breakdown and enter only on momentum.
🎯 Bearish Targets (Based on 2023 swing levels)
1️⃣ ₹1730 – Initial target
2️⃣ ₹1680 – Next demand zone
3️⃣ ₹1570 – Major swing support from 2023; final target
Targets align with earlier swing reaction zones where price historically paused or reversed.
🛑 Stop Loss
Stop Loss:
High of the Breakdown Candle
(not the previous swing high — too far, reduces R:R)
This keeps the trade logical, tight, and rule-based.
📉 Final Thoughts
- ACC is nearing a classic descending compression pattern.
A decisive break below ₹1770 could open a clean downside move toward the mentioned targets.
But no breakdown → no trade.
Wait for confirmation — momentum + volume + structure alignment.
📝 Disclaimer
This analysis is created purely for educational and informational purposes and reflects my personal view based on simple price-action rules.
It is NOT investment advice.
Please do your own research or consult a registered financial advisor before taking any trade.
Trading and investing in the stock market involve risk. Manage your position size and follow strict stop losses.
📢 Support the Idea
If you found this analysis helpful:
👍 Boost the idea
⭐ Follow me on TradingView for more price-action based setups
💬 Comment below and suggest any stock you want me to analyse next — I’ll pick the best requests for upcoming ideas!

NIFTY : Trading levels and Plan for 21-Nov-2025📊 NIFTY TRADING PLAN — 21 NOV 2025
(Reference: 15m chart structure & mapped zones)
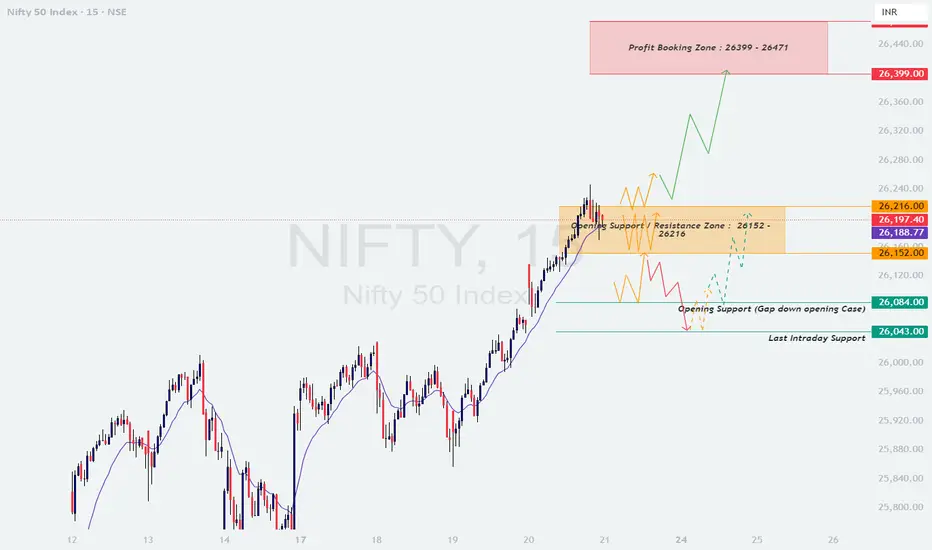
Nifty closed around 26,197, right inside the Opening Support / Resistance Zone (26,152 – 26,216).
Price is consolidating after a strong uptrend, and the market is testing a critical decision zone before attempting either a breakout toward 26,300+ or a pullback toward intraday supports.
Here are the major actionable zones for 21 Nov 2025:
🟧 Opening Support / Resistance Zone: 26,152 – 26,216
🟥 Profit Booking Zone: 26,399 – 26,471
🟩 Opening Support (Gap-down case): 26,084
🟩 Last Intraday Support: 26,043
🟢 SCENARIO 1 — GAP-UP OPENING (100+ Points)
If Nifty opens around 26,260–26,320, price opens above the decision zone and heads closer to resistance.
If price sustains above 26,216 with strong volume →
🎯 Targets → 26,260 → 26,310 → 26,399
Once price enters the Profit Booking Zone (26,399 – 26,471), expect volatility & selling pressure.
💡 Safe to book profits in this region.
If gap-up gets rejected from 26,260–26,300, expect:
➡️ Pullback to 26,216 → 26,180
A bullish reversal at 26,180–26,216 gives a safe continuation long.
📘 Educational Note:
Gap-ups near major resistance can trap buyers. Always wait for confirmation (higher low or retest breakout) before entering.
🟧 SCENARIO 2 — FLAT OPENING (Near 26,150–26,210)
A flat opening places Nifty directly in the Opening Support / Resistance Zone (26,152–26,216) — a “no-direction” zone.
A breakout above 26,216 →
Targets → 26,260 → 26,310
A breakdown below 26,152 →
Targets → 26,120 → 26,084
Avoid trading between 26,152–26,216 until clear breakout or breakdown occurs.
Best trades will be:
✔️ Breakout → Retest → Long
✔️ Breakdown → Retest → Short
💡 Educational Tip:
Flat opens require patience — the first 15-minute candle usually sets the trend for the day.
🔻 SCENARIO 3 — GAP-DOWN OPENING (100+ Points)
A gap-down below 26,120 pushes Nifty toward the Opening Support (26,084) or lower.
If 26,084 holds with a wick-rejection →
Upside targets → 26,150 → 26,180 → 26,216
If price breaks below 26,084, next support:
➡️ 26,043 (Last Intraday Support)
A strong bounce from 26,043 can give an excellent low-risk long entry.
If 26,043 fails, next downside targets expand to:
➡️ 25,990 → 25,950
📘 Educational Note:
Gap-downs into support can reverse sharply — but only when confirmation (reversal candle + volume) is present.
💼 RISK MANAGEMENT TIPS FOR OPTION TRADERS 💡
Avoid trading the first 5–10 minutes if volatility is high.
Prefer ATM or slight ITM options for directional moves.
Always place SL based on structure — not based on emotional comfort.
Don’t average losing positions — trend can continue longer than expected.
Scalp profits quickly during sideways markets.
In high VIX environments → prefer spreads or hedged strategies.
Trail stop-loss if momentum breakout happens.
⚠️ Golden Rule:
Protecting capital > Catching every move. Consistency beats aggression.
📌 SUMMARY
Bullish above → 26,216
🎯 Targets → 26,260 → 26,310 → 26,399 → 26,471
Bearish below → 26,152**
🎯 Targets → 26,120 → 26,084 → 26,043
Key No-Trade Area:
— 26,152–26,216 (opening chop zone)
🧾 CONCLUSION
Nifty is at a decision zone, and the move away from the 26,152–26,216 range will guide the day’s trend.
The safest opportunities will occur from:
✔️ Breakout above 26,216 → Retest → Long
✔️ Reversal from 26,399–26,471 (for intraday short)
✔️ Bounce from 26,084 or 26,043 in gap-down scenarios
Stay patient at the open, trade with confirmation, and avoid the noisy zones.
⚠️ DISCLAIMER
I am not a SEBI-registered analyst.
This analysis is purely for educational purposes.
Please consult your financial advisor before taking any trades.
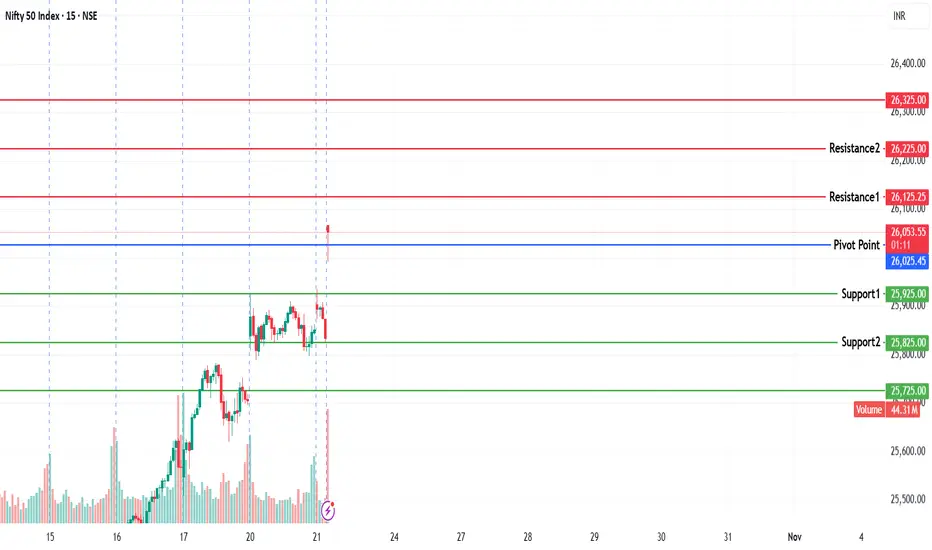
NIFTY KEY LEVELS FOR 27.10.2025NIFTY KEY LEVELS FOR 27.10.2025
Timeframe: 3 Minutes
If the candle stays above the pivot point, it is considered a bullish bias; if it remains below, it indicates a bearish bias. Price may reverse near Resistance 1 or Support 1. If it moves further, the next potential reversal zone is near Resistance 2 or Support 2. If these levels are also broken, we can expect the trend.
When a support or resistance level is broken, it often reverses its role; a broken resistance becomes the new support, and a broken support becomes the new resistance.
If the range(R2-S2) is narrow, the market may become volatile or trend strongly. If the range is wide, the market is more likely to remain sideways
please like and share my idea if you find it helpful
📢 Disclaimer
I am not a SEBI-registered financial adviser.
The information, views, and ideas shared here are purely for educational and informational purposes only. They are not intended as investment advice or a recommendation to buy, sell, or hold any financial instruments.
Please consult with your SEBI-registered financial advisor before making any trading or investment decisions.
Trading and investing in the stock market involves risk, and you should do your own research and analysis. You are solely responsible for any decisions made based on this research.

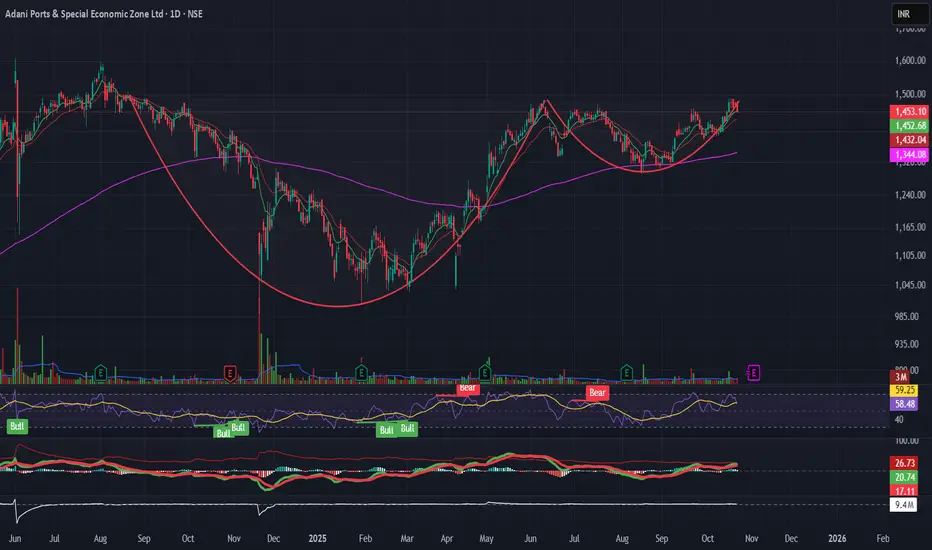
Adani Ports (ADANIPORTS)Pattern: Cup & Handle
Breakout Zone: Above ₹1,490
Structure: Price forming a large rounding base; EMAs aligned positively; RSI > 60 confirming momentum
Volume: Gradually increasing – accumulation visible
Plan:
Buy Trigger: Close above ₹1,490
Stoploss: ATR-based (~₹1,445)
Targets: ₹1,600 → ₹1,680 (based on Fib extensions)
View: Bullish continuation, strong structure supported by momentum and sector strength (Infrastructure + Ports theme)
NIFTY KEY LEVELS FOR 23.10.2025NIFTY KEY LEVELS FOR 23.10.2025
Timeframe: 3 Minutes
If the candle stays above the pivot point, it is considered a bullish bias; if it remains below, it indicates a bearish bias. Price may reverse near Resistance 1 or Support 1. If it moves further, the next potential reversal zone is near Resistance 2 or Support 2. If these levels are also broken, we can expect the trend.
When a support or resistance level is broken, it often reverses its role; a broken resistance becomes the new support, and a broken support becomes the new resistance.
If the range(R2-S2) is narrow, the market may become volatile or trend strongly. If the range is wide, the market is more likely to remain sideways
please like and share my idea if you find it helpful
📢 Disclaimer
I am not a SEBI-registered financial adviser.
The information, views, and ideas shared here are purely for educational and informational purposes only. They are not intended as investment advice or a recommendation to buy, sell, or hold any financial instruments.
Please consult with your SEBI-registered financial advisor before making any trading or investment decisions.
Trading and investing in the stock market involves risk, and you should do your own research and analysis. You are solely responsible for any decisions made based on this research.
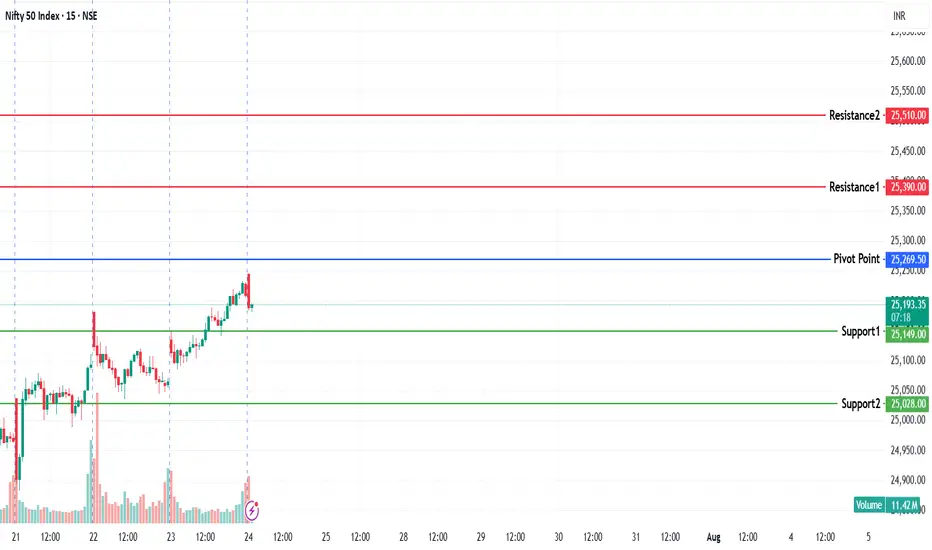
NIFTY KEY LEVELS FOR 24.07.2025NIFTY KEY LEVELS FOR 24.07.2025
If the candle stays above the pivot point, it is considered a bullish bias; if it remains below, it indicates a bearish bias. Price may reverse near Resistance 1 or Support 1. If it moves further, the next potential reversal zone is near Resistance 2 or Support 2. If these levels are also broken, we can expect the trend.
If the range is narrow, the market may become volatile or trend strongly. If the range is wide, the market is more likely to remain sideways
📢 Disclaimer
I am not a SEBI-registered financial adviser.
The information, views, and ideas shared here are purely for educational and informational purposes only. They are not intended as investment advice or a recommendation to buy, sell, or hold any financial instruments.
Please consult with your SEBI-registered financial advisor before making any trading or investment decisions.
Trading and investing in the stock market involves risk, and you should do your own research and analysis. You are solely responsible for any decisions made based on this research.

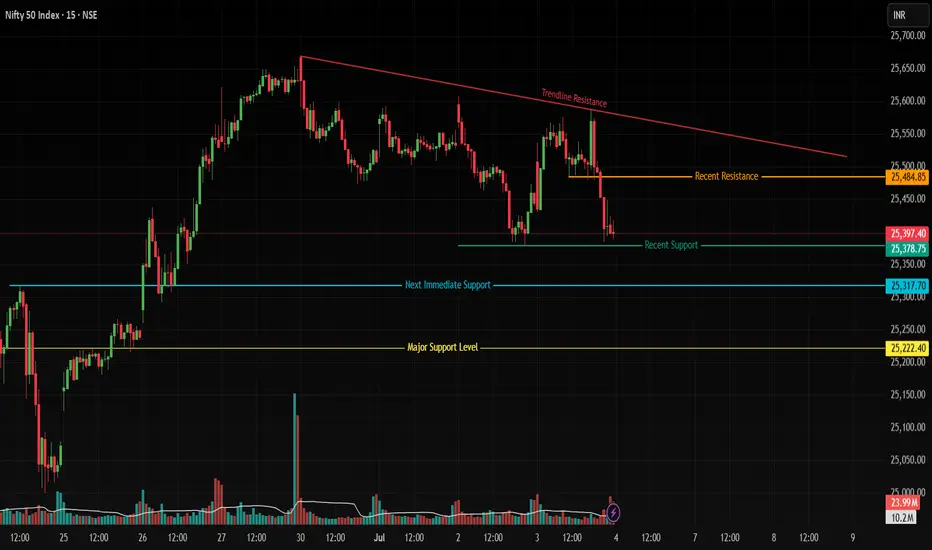
Nifty50 Analysis for 04/07/2025: 25,400 Key Intraday LevelCurrent Context: Nifty50 trading near 25,400, a tested support zone. Market structure suggests two potential scenarios based on price reaction at this level.
🔍 Key Levels to Monitor
Immediate Support: 25,400 (recent price anchor)
Next Supports: 25,300 (minor swing low) → 25,220 (major historical base)
Near-Term Resistance: 25,480 (recent swing high)
Trendline Resistance: 25,575 (drawn from June 30 highs)
📈 Bullish Scenario Framework
Observation Criteria: A robust green candle closing above 25,400.
Potential Structure:
Break above 25,480, Recent Resistance (Orange line) may signal momentum toward 25,575 trendline resistance.
Note: Volume confirmation could strengthen validity.
📉 Bearish Scenario Framework
Observation Criteria: Strong red candle closing below 25,400.
Potential Structure:
Sustained move below 25,400 opens 25,300 zone (Blue Line) as next interest area.
25,220 becomes focal point if 25,300 fails to hold.
🔎 Why This Matters
25,400 Significance: Acts as a hinge between recent consolidation (bullish) and distribution (bearish).
Volume & Candles: Strength/weakness in breakouts may be validated by volume spikes.
Trendline Context: 25,575 aligns with a 4-session descending trendline (tested twice).
⚠️ Disclaimer
This idea highlights observed market structure levels and is not trading advice. It does not constitute a recommendation to buy/sell securities or any financial instrument. Market conditions change rapidly; always conduct independent analysis and consider your risk tolerance before trading. Past performance is not indicative of future results.
Nifty - At Crucial PointNifty current area from 22640 to 22910 becomes a very crucial zone now
If tries to sustain n takes support then expect nifty to hover near support for few days before going back up again near 23600
But if the pressure continues and nifty successfully breaks and closes below 22640 in the daily TF
Then expect the same area (22640 - 22910) to act as a resistance and also Nifty can go to touch downside target of 21880

Nifty - Possible end of bears controlFrom the ATH of 26151 Nifty is almost reaching its 10% correction value @ 22635
Area of 22650 to 750 also happens to be the last strongest support point
At this level it can be make or break situation for nifty
Will be good to take a bullish bet with 22600 as ultimate SL(Closing basis) as the PE premiums are soaring high
It may be a risky call but Risk to Reward is excellent
Will wait for the index to show some clarity in lower time frames (15 / 30/ 60 m)

Nifty key levels for 15.01.2025Nifty key levels for 15.01.2025
If Nifty breaks the upper or lower range, we can expect momentum. The consolidation zone will be favorable for option sellers, while a breakout on either side will benefit option buyers.
Disclaimer:
These views are purely educational in nature. You are solely responsible for any decisions made based on this research.

Nifty key levels for 08.01.2025Nifty key levels for 08.01.2025
If Nifty breaks the upper or lower range, we can expect momentum. The consolidation zone will be favorable for option sellers, while a breakout on either side will benefit option buyers.
Disclaimer:
These views are purely educational in nature. You are solely responsible for any decisions made based on this research.

Technical Insights: CROMPTONCurrent Price Action
Crompton Greaves (CROMPTC) is trading at ₹393.55, experiencing a slight correction of -2.72% for the day. The stock has been oscillating within well-defined trendlines, showcasing pivotal support and resistance levels.
Key Technical Levels
Resistance Zones:
₹440.35: A significant resistance level from recent highs.
₹479.15: A long-term resistance that aligns with historical peaks.
Support Zones:
₹384.25: Immediate support, currently being tested.
₹362.35 & ₹348.80: Critical levels to watch if the stock breaks below the ascending trendline.
Trendlines:
Long-Term Support: The yellow upward-sloping trendline has held since early 2023, reflecting steady bullish accumulation.
Descending Resistance: The downward sloping line from 2021 highs signifies major resistance. The stock's ability to break and sustain above this line will confirm a trend reversal.
Market Structure
The broader structure indicates that the stock is at a decisive juncture:
Bullish View: Sustained price action above ₹400 could lead to a breakout rally toward ₹440 and higher.
Bearish View: A breakdown below ₹384 could accelerate the fall to ₹362 or ₹348 levels.
Trading Outlook
Buyers: Look for a breakout above ₹400 with strong volume as confirmation of bullish momentum.
Sellers: Consider short opportunities if the price slips below ₹384 with significant volume.

Nifty Possible PlayNfty after strong bull run finally ready to stuck and spend some time in the zone
Possible resistance in the coming days 24535 - 600 - 650 zones up to 700
Possible support zones 24330 - 300 - 270 up to 200
nifty possible to remain in the above mentioned area until any other surprise factor arises
Good opportunity for range base trading

NIFTY is bearish below 23263 - Nifty Bearish Level (Important)Nifty has found support at 23263 - please be aware to exit or reduce your positions if the suggested level is broken,
you can also think of shorting the markets with a timeline of trade for 3 Months (that means, atleast stay in shorts for three months if as long as markets is below 23263).
I strongly suggest you to save this post or remember the level which can prove to be very important opportunity for taking a trade.
Please Like, Share & Boost if you think this post was helpful to you
Thank you

Nifty staring at 21500 unless it can recover 24550Nifty has formed a second head and shoulder pattern and closed below the neckline today
The target for this pattern is 21500, assuming it doesn't recover to 24550

NIFTY Bearish Trend EMA50 Testing Weekly corrected 2400 points Posted Chart on 29th september that Nifty Near to Channel Resistance with RSI overbought and small negative Divergence, Price is 2000/4000 point away from EMA 20/50__after every trending move price is reverse to its ema line(MEAN reversion)+ also if making of flag then sideways to small correction can expect_____
Now after Retest Of EMA20 on weekly Nifty Still facing selling Pressure from higher levels now previous swing low is broken EMA50 is nearby 23300 and channel support at nearby 22700.
'
USDINR at lifetime high @84.40 overall negative momentum.

Nifty 50 Near-Term ForecastCurrent Price and Resistance:
The Nifty 50 index is currently trading around 24,492.
There's a notable resistance level around 25,065, where previous price action struggled to move higher. This level acts as a potential cap for upward movement.
Support Levels:
A significant support line is marked around 23,996, below the current trading level.
If the price breaches this level, it could suggest a further downside, with a possible drop toward lower support zones.
Projected Downtrend:
The orange line indicates a possible downward movement from the current levels if resistance at 25,065 holds.
This downtrend projection suggests that the Nifty 50 could move lower, potentially testing the support near 23,996.
If the index falls below this support, the next projected move takes it further down toward the 22,000 level, indicating a deeper correction.
Possible Reversal:
After reaching a lower level near 22,000, there’s a projected rebound shown with an upward arrow.
This suggests a potential reversal or bounce-back from these lower levels, which could present a buying opportunity.

Nifty Bank Nifty Intermarket Bulish DiveergenceNSE:NIFTY and NSE:BANKNIFTY
showing Intraday Divergence
Nifty made higher low compared to Bank nifty
Breaking channel now.
Wave 3 Rally shall resume now


Nifty for the week 16th sep to 20 sep 2024.Nifty is in uptrend as long as it above 24250.
Buy above 25435 or
if Nifty falls then wait for retracement or green candle above 24250 in one hour time frame and buy above the high of the green candle
Sell below the low of the candle which closes below 24250 in one hour time frame.
Disclaimer.
I am not a SEBI registered analyst. The above is only for Educational Purpose.

Nifty Levels 04 Sep 24Upside move - Nifty sustains abobe 25333 then only upside move possible.
Down side move - Nifty sustains below 25250 then 25167 , 25083 levels are possible
Storng support is 25000
Storng resistance is 25300
NSE:NIFTY
