NIFTY : Detailed Trading plan for 09-Feb-2026📘 NIFTY Trading Plan – 9 Feb 2026
(Timeframe: 15-Min | Instrument: NIFTY 50 | Educational Purpose Only)
🔑 Key Intraday Levels (From Chart)
🟢 26,161 – Higher Timeframe Resistance
🟢 25,858 – 25,906 – Last Resistance Zone
🟠 25,616 – 25,694 – Opening Support / Resistance (No-Trade Zone)
🟢 25,747 – Opening Resistance
🟢 25,616 – 25,747 – Immediate Decision Band
🟢 25,533 – Last Intraday Support
🧠 Market Structure & Price Psychology
NIFTY has shown a recovery bounce after recent weakness, but price is currently trapped near a decision supply zone.
This indicates balance between short covering & fresh selling.
👉 Direction on 9 Feb will depend on acceptance above resistance or breakdown below support, not prediction.
🚀 Scenario 1: GAP UP Opening (100+ Points)
(Opening near / above 25,780)
🧠 Psychology
Gap up reflects overnight bullish sentiment, but sellers often defend prior resistance zones.
🟢 Bullish Plan
🔵 Sustaining above 25,747 (15-min close)
🔵 Upside opens towards 25,858 – 25,906
🔵 Break & hold above zone → Expansion towards 26,161
🔴 Rejection Plan
🔴 Failure near 25,858 – 25,906
🔴 Pullback towards 25,747 → 25,694
📌 Why this works
Breakouts succeed only when price is accepted above supply, not just gap-driven spikes.
➖ Scenario 2: FLAT Opening
(Opening between 25,620 – 25,720)
🧠 Psychology
Flat opening inside consolidation shows indecision & liquidity absorption.
🟠 No-Trade Zone
🔸 25,616 – 25,694
🔸 Expect whipsaws & fake breakouts
🟢 Upside Plan
🔵 Break & hold above 25,747
🔵 Targets: 25,858 → 26,161
🔴 Downside Plan
🔴 Breakdown below 25,616
🔴 Weakness towards 25,533
📌 Why this works
Ranges expand after consolidation — patience gives better entries.
🔻 Scenario 3: GAP DOWN Opening (100+ Points)
(Opening near / below 25,616)
🧠 Psychology
Gap down indicates profit booking or fear-based selling, but demand zones can trigger relief rallies.
🟢 Bounce Setup
🔵 If 25,616 holds on 15-min basis
🔵 Expect bounce towards 25,694 → 25,747
🔴 Breakdown Setup
🔴 Clean break below 25,533
🔴 Downside momentum may accelerate
📌 Why this works
Strong supports either create sharp reversals or fast continuation moves.
🛡️ Risk Management Tips (Options Traders)
🟢 Trade only after first 15-min candle confirmation
🟢 Prefer defined-risk spreads in volatile markets
🟢 Avoid trading inside No-Trade Zones ❌
🟢 Risk maximum 1–2% capital per trade
🟢 Book partial profits at next levels
🟢 Discipline > Prediction 📌
🧾 Summary & Conclusion
📌 NIFTY is in decision consolidation near resistance
📌 25,747 & 25,616 are key intraday triggers
📌 Break above 25,906 confirms bullish continuation
📌 Trade price reaction, not bias 📈
⚠️ Disclaimer
This analysis is strictly for educational purposes only.
I am not a SEBI registered analyst.
Please consult your financial advisor before taking any trades.
Market investments are subject to risk.
Niftyoptions

NIFTY : Trading levels and Plan for 06-Feb-2026📘 NIFTY Trading Plan – 6 Feb 2026
(Timeframe: 15-Min | Instrument: NIFTY 50 | Educational Purpose Only)
🔑 Key Intraday Levels (From Chart)
🟢 26,171 – Higher Timeframe Resistance
🟢 25,985 – 25,950 – Last Intraday Resistance Zone
🟠 25,569 – 25,696 – Opening Support / Resistance (Consolidation Zone)
🟢 25,452 – 25,309 – Last Intraday Support Zone
🟢 25,021 – 24,948 – Lower Demand / Breakdown Zone
🧠 Market Structure & Price Psychology
NIFTY has shifted from a sharp recovery phase into consolidation, indicating exhaustion of short-covering and absence of aggressive fresh buying.
Price is currently oscillating inside a wide decision zone, where acceptance or rejection will define the next trending move.
👉 For 6 Feb, opening behavior around the consolidation zone will be the key trigger.
🚀 Scenario 1: GAP UP Opening (200+ Points)
(Opening near / above 25,850)
🧠 Psychology
A big gap up after consolidation often reflects overnight optimism, but higher supply zones attract institutional profit booking.
🟢 Bullish Plan
🔵 If price sustains above 25,985 on a 15-min closing basis
🔵 Upside opens towards 26,171
🔵 Momentum continuation only after clear acceptance above resistance
🔴 Rejection Plan
🔴 Failure to hold above 25,985 – 25,950
🔴 Expect pullback towards 25,696 – 25,569
📌 Why this works
Breakouts succeed only when price is accepted at higher value, not when driven by emotional gap-up buying.
➖ Scenario 2: FLAT Opening
(Opening between 25,550 – 25,700)
🧠 Psychology
Flat opening inside consolidation shows balance between buyers and sellers. Market usually expands after liquidity is absorbed.
🟢 Upside Plan
🔵 Sustaining above 25,696
🔵 Gradual move towards 25,985
🔴 Downside Plan
🔴 Failure to hold 25,569
🔴 Drift towards 25,452 – 25,309
📌 Important Note
🟠 25,569 – 25,696 is a high-chop consolidation zone
🟠 Avoid over-trading until a clean breakout or breakdown
🔻 Scenario 3: GAP DOWN Opening (200+ Points)
(Opening near / below 25,309)
🧠 Psychology
Gap down after consolidation indicates profit booking or fresh short initiation.
🟢 Bounce Setup
🔵 If 25,452 – 25,309 holds on a 15-min basis
🔵 Expect technical bounce towards 25,569 – 25,696
🔴 Breakdown Setup
🔴 Clean break below 25,309
🔴 Downside opens till 25,021 – 24,948
📌 Why this works
Strong demand zones either produce sharp relief rallies or fast breakdown continuation.
🛡️ Risk Management Tips (Options Traders)
🟢 Trade only after first 15-min candle confirmation
🟢 Prefer defined-risk option spreads in gap markets
🟢 Avoid aggressive buying near resistance ❌
🟢 Risk maximum 1–2% capital per trade
🟢 Book partial profits at next support/resistance
🟢 Discipline > Prediction 📌
🧾 Summary & Conclusion
📌 NIFTY is in post-recovery consolidation
📌 25,696 & 25,309 are the most important intraday decision levels
📌 Break above 25,985 needed for bullish continuation
📌 Trade price reaction, not expectations 📈
⚠️ Disclaimer
This analysis is strictly for educational purposes only.
I am not a SEBI registered analyst.
Please consult your financial advisor before taking any trades.
Market investments are subject to risk.

NIFTY : Trading levels and plan for 03-Feb-2026📘 NIFTY Trading Plan – 3 Feb 2026
(Timeframe: 15-Min | Instrument: NIFTY 50 | Educational Use Only)
🔑 Key Intraday Levels (From Chart)
🟢 25,985 – Higher Timeframe Resistance
🟢 25,569 – 25,696 – Last Intraday Resistance / Consolidation Zone
🟢 25,266 – Opening Resistance (Flat Opening Case)
🟢 24,901 – Opening Support (Gap-Down Opening Case)
🟢 25,081 – Current Reference Price Area
🧠 Market Structure & Price Psychology
NIFTY witnessed a sharp intraday breakdown followed by a recovery bounce, indicating short-covering from lower levels.
However, price is still trading below major resistance zones, meaning trend reversal is not confirmed yet.
👉 Tomorrow’s direction depends on acceptance or rejection near opening levels, not assumptions.
🚀 Scenario 1: GAP UP Opening (100+ Points)
(Opening near / above 25,180–25,220)
🧠 Psychology
A gap up after a sharp fall is usually driven by short covering, but higher zones still carry strong selling pressure.
🟢 Bullish Plan
🔵 If price sustains above 25,266 on a 15-min closing basis
🔵 Expect upside towards 25,569 – 25,696
🔵 Break & acceptance above this zone can open path towards 25,985
🔴 Rejection Plan
🔴 Failure near 25,569 – 25,696
🔴 Expect consolidation or pullback towards 25,266
📌 Why this works
Only acceptance above resistance confirms fresh buying, not emotional gap-up trades.
➖ Scenario 2: FLAT Opening
(Opening between 25,050 – 25,150)
🧠 Psychology
Flat openings indicate balance between buyers and sellers. Market usually expands after testing resistance.
🟢 Upside Plan
🔵 Hold above 25,266
🔵 Targets: 25,569 → 25,696
🔴 Downside Plan
🔴 Failure to cross 25,266
🔴 Price may retest 24,901
📌 Key Note
🟠 Expect range-bound moves until breakout confirmation.
🔻 Scenario 3: GAP DOWN Opening (100+ Points)
(Opening near / below 24,901)
🧠 Psychology
Gap down reflects renewed fear, but strong supports often trigger short covering rallies.
🟢 Bounce Setup
🔵 If 24,901 holds on 15-min basis
🔵 Expect pullback towards 25,081 → 25,266
🔴 Breakdown Setup
🔴 Clean break below 24,901
🔴 Downside momentum can extend rapidly (no nearby support)
📌 Why this works
Supports either produce fast bounces or accelerated breakdowns—confirmation is critical.
🛡️ Risk Management Tips (Options Traders)
🟢 Trade only after first 15-min candle confirmation
🟢 Prefer option spreads near resistance zones
🟢 Avoid aggressive buying in gap-up opens ❌
🟢 Risk maximum 1–2% of capital per trade
🟢 Book partial profits at pre-defined levels
🟢 Discipline > Prediction 📌
🧾 Summary & Conclusion
📌 Market remains volatile and reactive
📌 25,266 & 24,901 are the most important intraday levels
📌 Break above 25,696 needed for bullish continuation
📌 Trade price reaction, not market noise 📈
⚠️ Disclaimer
This analysis is strictly for educational purposes only.
I am not a SEBI registered analyst.
Please consult your financial advisor before taking any trades.
Market investments are subject to risk.

NiftyNifty has attempted multiple recoveries after the fall, consistently taking support near the 25100 level. If the index opens with a gap down below 25100 and forms a strong bearish candle, a further downside move towards 24750 can be expected. A bullish move is likely only after a decisive break above 25400. Until then price action remain sideways within the 25300-25100 range.
NIFTY : Trading levels and Plan for 21-Jan-2025📘 NIFTY Trading Plan – 21 Jan 2026
Timeframe: 15-minute
Gap Considered: 100+ points
Market Context: Strong sell-off followed by base formation; market trading near a decision / no-trade zone after sharp momentum move
🔼 SCENARIO 1: GAP UP OPENING (100+ points) 🚀
If NIFTY opens above 25,316, it indicates short-covering after the recent decline.
Immediate hurdle lies at 25,388 – 25,415 (Opening / Last Intraday Resistance).
Sustained 15-min close above 25,415 is required for bullish continuation.
Upside targets to watch:
• 25,485
• 25,540+ (only if momentum expands)
Any rejection from resistance with weak candles = profit-booking zone.
Avoid aggressive long entries exactly at resistance; wait for pullback & hold.
📌 Options Thought (Gap Up):
• Prefer Bull Call Spread instead of naked CE
• Book partial profits near resistance zones
• Trail SL aggressively 📈
➡️ SCENARIO 2: FLAT / RANGE OPENING ⚖️
If NIFTY opens inside 25,227 – 25,316, market is likely to remain range-bound initially.
This entire zone acts as a NO TRADE / Balance Zone.
Expect whipsaws and false breakouts.
Upside trade triggers only above 25,415.
Downside pressure resumes below 25,227.
Patience is key — let price show intent first.
📌 Options Thought (Flat Market):
• Ideal environment for Theta-based strategies ⏳
• Short strangle / Iron Condor only with strict SL
• Avoid overtrading inside the range
🔽 SCENARIO 3: GAP DOWN OPENING (100+ points) 📉
If NIFTY opens below 25,227, bears remain in control.
First important support lies at 25,043 (Last Intraday Support).
A bounce is possible, but trend remains weak below 25,316.
Breakdown below 25,043 opens downside toward:
• 24,900 – 24,890 (Major Buyer / Trend Reversal Zone)
Avoid bottom-fishing unless strong reversal structure forms.
📌 Options Thought (Gap Down):
• Prefer Bear Put Spread or directional PE with tight SL
• Avoid selling PE in trending markets
• Focus on quick scalps & disciplined exits 📉
🧠 Risk Management Tips for Options Trading 🛡️
Risk only 1–2% capital per trade.
Avoid revenge trading after SL.
Expiry proximity = faster decay & sharper moves.
Use spreads to control volatility risk.
No confirmation = no trade.
📌 Summary & Conclusion ✨
NIFTY is currently trading near a key balance zone after a sharp fall.
📍 25,227 – 25,316 remains the critical decision area.
📍 Strength only above 25,415 with acceptance.
📍 Weakness continues below 25,227, with eyes on 25,043 → 24,900.
Trade light, respect levels, and let the market confirm direction.
⚠️ Disclaimer
This analysis is for educational purposes only.
I am not a SEBI registered analyst.
Markets are uncertain and I may be wrong.
Please consult your financial advisor before trading.

NIFTY : Trading levels and Plan for 19-Jan-2026📘 NIFTY Trading Plan – 19 Jan 2026
Timeframe: 15-minute
Gap Consideration: 100+ points
Market Context: Range expansion attempt after corrective swings, key balance area in focus
🔼 SCENARIO 1: GAP UP OPENING (100+ points) 🚀
If NIFTY opens above 25,780, it indicates bullish intent with short-covering.
Immediate hurdle lies at 25,915–25,945 (Last Intraday Resistance zone).
Sustained 15-min close above 25,945 can trigger upside extension.
Next upside projection comes near 26,044.
Expect volatility and profit booking near resistance zones.
Fresh longs only on pullback + hold above resistance.
📌 Options Strategy (Gap Up):
• Bull Call Spread (ATM Buy + OTM Sell)
• Avoid aggressive naked CE near resistance
• Trail profits aggressively 📈
➡️ SCENARIO 2: FLAT / RANGE OPENING ⚖️
If NIFTY opens within 25,660–25,738, expect a no-trade / chop zone.
This zone is marked as Opening Support–Resistance.
Market likely to trap both buyers and sellers initially.
Upside trade only above 25,780 with confirmation.
Downside bias activates below 25,560.
Best suited for option sellers if IV permits.
📌 Options Strategy (Flat Market):
• Short Strangle / Iron Fly (experienced traders only)
• Focus on theta decay ⏳
• Avoid directional bias inside range
🔽 SCENARIO 3: GAP DOWN OPENING (100+ points) 📉
If NIFTY opens below 25,560, selling pressure may resume.
First support zone is 25,530–25,567 (Opening / Last Intraday Support).
Minor bounce possible, but trend remains weak below resistance.
Breakdown below 25,530 opens downside towards:
• 25,423
Avoid bottom fishing without confirmation candle.
📌 Options Strategy (Gap Down):
• Bear Put Spread preferred
• Avoid selling PE in trending downside
• Quick scalps only, book fast 📉
🧠 Risk Management Tips for Options Trading 🛡️
Risk only 1–2% of capital per trade.
Expiry proximity = faster decay & sharper moves.
Prefer spreads over naked buying.
One trade = one idea. No revenge trading.
Always wait for 15-min structure confirmation.
📌 Summary & Conclusion ✨
NIFTY is trading near a critical balance zone.
📍 25,660–25,738 remains the decision-making range.
📍 Break above 25,945 may revive bullish momentum.
📍 Below 25,530, downside risk increases sharply.
Trade light, respect levels, and let the market confirm direction.
⚠️ Disclaimer
This content is for educational purposes only.
I am not a SEBI registered analyst.
Markets are uncertain, and I can be wrong.
Please consult your financial advisor before trading.

NIFTY : Trading plan for 07-Jan-2026
(Timeframe: 15-min | Gap consideration: 100+ points)
Key Levels to Track (from chart)
Upper Resistance / Extension: 26,392
Last Intraday Resistance: 26,320
Opening Resistance (Gap-up case): 26,250
Opening Support / Resistance (Pivot): 26,183 – 26,175
Opening Support (Gap-down case): 26,042 – 26,080
Last Intraday Support: 25,983
Lower Extreme Support: 25,839
🧠 Context: After a strong prior up-move, price corrected and is now hovering near a pivot band (26,183–26,175). Expect whipsaws early; clean direction needs acceptance above/below the pivot.
🟢 1. GAP-UP OPENING (100+ Points)
If NIFTY opens above 26,250, the market signals bullish intent but immediately faces overhead supply.
🎓 Educational Explanation:
Gap-ups near resistance often see early profit booking. Sustainable upside requires price acceptance (holding above levels on a 15-min close), not just a spike.
Plan of Action:
Avoid the first 10–15 mins; let volatility settle.
Sustain above 26,250 → test 26,320 (last intraday resistance).
Acceptance above 26,320 opens path toward 26,392.
Repeated rejection near 26,320 → expect pullback toward 26,250 → 26,183.
Options idea: Bull Call Spread (ATM buy + OTM sell) to reduce theta risk near resistance.
🟡 2. FLAT OPENING
If NIFTY opens inside 26,175–26,250, expect a range-bound start.
🎓 Educational Explanation:
Flat opens inside a pivot zone reflect indecision. Direction emerges only after a range expansion with volume.
Plan of Action:
Above 26,250 → bullish bias toward 26,320.
Failure at 26,250 keeps price rotating within 26,183–26,175.
Break & hold below 26,175 shifts bias toward 26,080 → 26,042.
Wait for 15-min close + volume before committing.
Options idea: Iron Fly / Narrow Strangle (light size) if range persists.
🔴 3. GAP-DOWN OPENING (100+ Points)
If NIFTY opens below 26,175, sentiment turns cautious.
🎓 Educational Explanation:
Gap-downs into support can trigger panic selling, followed by either short covering or continuation. Confirmation matters.
Plan of Action:
First watch zone: 26,080–26,042.
Sustain below 26,042 → downside toward 25,983.
Break of 25,983 increases probability of 25,839.
Strong bullish rejection from 26,080–26,042 may offer intraday bounce longs.
Options idea: Bear Put Spread (avoid naked puts near supports).
⚙️ Risk Management Tips for Options Trading 🛡️
Risk only 1–2% of capital per trade.
Prefer spreads near major levels to manage theta & IV.
Use time-based exits if premium stalls for 15–20 mins.
Book partials early; trail the rest.
No revenge trades after SL.
🧾 Summary & Conclusion
Above 26,250: Bulls active; hurdles at 26,320 → 26,392
26,175–26,250: Choppy pivot → patience pays
Below 26,175: Weakness toward 26,080 → 26,042 → 25,983
Trade reaction at levels, not predictions 🚦
⚠️ Disclaimer
I am not a SEBI-registered analyst. This content is for educational purposes only. Markets involve risk—consult your financial advisor before trading.

NIFTY : Trading levels and Plan for 06-Jan-2026📘 NIFTY Trading Plan for 6-Jan-2026
(Timeframe: 15-min | Gap consideration: 100+ points)
Key Levels to Track (from chart)
Upper Resistance / Extension: 26,483
Last Intraday Resistance Zone: 26,386 – 26,412
Opening Resistance: 26,316
Opening Support / Resistance Zone: 26,202 – 26,244
Lower Support: 26,041
🧠 Market Context: NIFTY has recently shown strong upside momentum, but price is now reacting near a major supply zone. Expect volatility, false breakouts, and profit booking unless levels are clearly accepted.
🟢 1. GAP-UP OPENING (100+ Points)
If NIFTY opens above 26,316, it indicates bullish intent but inside a heavy resistance cluster.
🎓 Educational Explanation:
Gap-ups near resistance often attract smart money selling. True continuation happens only if price accepts above resistance, not just spikes.
Plan of Action:
Avoid trades in the first 10–15 minutes; let volatility settle.
Sustaining above 26,316 keeps price biased toward 26,386–26,412.
Acceptance above 26,412 opens path toward 26,483.
Repeated rejection from 26,386–26,412 signals profit booking / pullback.
Options traders: Prefer Bull Call Spread or ATM Call with trailing SL near resistance.
🟡 2. FLAT OPENING
If NIFTY opens around 26,202–26,316, expect a range-bound and tricky session initially.
🎓 Educational Explanation:
Flat opens inside a broad zone reflect indecision. Direction emerges only after a range expansion.
Plan of Action:
Above 26,316 → bullish bias toward 26,386–26,412.
Failure near 26,316 keeps market sideways.
Break below 26,202 shifts bias toward 26,041.
Wait for 15-min candle close + volume confirmation before entering.
Options traders: Iron Fly / Short Strangle (light quantity) works well if range persists.
🔴 3. GAP-DOWN OPENING (100+ Points)
If NIFTY opens below 26,202, sentiment turns cautious.
🎓 Educational Explanation:
Gap-downs into support often cause panic selling early, followed by either short covering or continuation. Confirmation is key.
Plan of Action:
First level to watch: 26,202–26,244 zone.
Sustaining below 26,202 increases downside probability toward 26,041.
Strong bullish reaction near 26,041 may give intraday bounce trades.
Avoid aggressive shorts near support without confirmation.
Options traders: Prefer Bear Put Spread over naked puts to manage risk.
⚙️ Risk Management Tips for Options Trading 🛡️
Limit risk to 1–2% of capital per trade.
Avoid over-trading near major resistance zones.
Use time-based exits if premium stops moving for 15–20 mins.
Book partial profits early; trail the remainder.
Prefer ATM options or spreads in volatile sessions.
No revenge trades after SL hit.
🧾 Summary & Conclusion
Above 26,316: Bulls active, but expect resistance near 26,386–26,412
Between 26,202–26,316: Choppy zone → patience required
Below 26,202: Weakness toward 26,041 possible
Trade price reaction, not prediction 🚦
Discipline > aggression in resistance-heavy markets.
⚠️ Disclaimer
I am not a SEBI-registered analyst. This analysis is for educational purposes only. Markets involve risk; please consult your financial advisor before taking any trade.

NIFTY : Trading levels and Plan for 05-Jan-2026📘 NIFTY Trading Plan for 5-Jan-2026
(Timeframe: 15-min | Gap consideration: 100+ points)
Key Levels to Track (from chart)
Upper Target / Extension: 26,658
Last Intraday Resistance / Profit Booking Zone: 26,467 – 26,483
Opening Resistance Zone: 26,335 – 26,296
Opening Support: 26,289
Last Intraday Support: 26,237
Lower Support (Extreme): 26,162
🧠 Context: NIFTY is in a strong bullish structure, trading above key supports. However, price is approaching profit-booking zones, so reactions at resistance will decide continuation vs pullback.
🟢 1. GAP-UP OPENING (100+ Points)
If NIFTY opens above 26,335, it signals continuation strength.
🎓 Educational Explanation:
Gap-up openings after a rally often attract early profit booking. True strength is confirmed only if price accepts above resistance and holds.
Plan of Action:
Avoid trading the first 10–15 minutes; let volatility settle.
Holding above 26,335–26,296 keeps bullish momentum intact.
Sustained move above 26,483 opens path toward 26,658.
Sharp rejection from 26,467–26,483 → expect intraday pullback.
Options traders: Prefer ATM / ITM Call buying on retest-and-hold or use Bull Call Spread near resistance.
🟡 2. FLAT OPENING
If NIFTY opens around 26,289–26,335, market enters a decision zone.
🎓 Educational Explanation:
Flat opens indicate temporary balance. Direction emerges only after a range break, otherwise price may chop and decay option premiums.
Plan of Action:
Above 26,335 → bullish bias toward 26,467–26,483.
Failure near 26,335 may lead to sideways movement.
Break below 26,289 increases probability of test toward 26,237.
Trade only on clear breakout or rejection with volume confirmation.
Options traders: Consider non-directional strategies (Iron Fly / Short Strangle) if range persists.
🔴 3. GAP-DOWN OPENING (100+ Points)
If NIFTY opens below 26,289, expect cautious sentiment initially.
🎓 Educational Explanation:
Gap-downs into strong supports often trigger short covering or dip buying. Aggressive shorts near support are risky without confirmation.
Plan of Action:
First support to watch: 26,289.
Acceptance below 26,237 → downside toward 26,162.
Strong bullish candles near 26,237–26,162 may give bounce trades.
Only short if price fails to reclaim supports with weak structure.
Options traders: Prefer Put spreads instead of naked puts to manage risk.
⚙️ Risk Management Tips for Options Trading 🛡️
Risk only 1–2% of total capital per trade.
Avoid chasing breakouts near profit-booking zones.
Use time-based exits if premium stalls for 15–20 minutes.
Book partial profits early; trail the rest.
Avoid over-trading during sideways phases.
Prefer ATM options or spreads over far OTM buying.
🧾 Summary & Conclusion
Above 26,335: Bulls remain in control toward 26,483 → 26,658
Between 26,289–26,335: Market in balance → wait for clarity
Below 26,289: Pullback possible toward 26,237 → 26,162
Focus on price behavior at levels, not excitement 🚦
Discipline and patience will protect profits in a trending market.
⚠️ Disclaimer
I am not a SEBI-registered analyst. This analysis is for educational purposes only. Markets involve risk; please consult your financial advisor before taking any trade.

NIFTY Buy-on-Dips | 26,000 CE Opportunity for Jan 6NIFTY continues to show bullish strength, and the broader structure favors a buy-on-dips approach for today, 2nd January 2026.
📌 Trade Setup (Options):
Instrument: NIFTY 26,000 CE (6th Jan Expiry)
Buy Zone: ₹180 – ₹170
Target: ₹240
Risk Level: ₹140 (must hold on closing basis)
As long as ₹140 remains intact, the bullish momentum stays valid. A dip into the mentioned buy zone could offer a low-risk, high-reward opportunity aligned with the current trend.
⚠️ Trade with strict risk management and adjust position sizing accordingly.
📌 Disclaimer:
This analysis is for educational purposes only and is not financial advice. Always manage risk and follow your trading plan.
Your feedback drives our content and keeps everyone trading smarter. Let’s make those pips together! 🚀
Happy Trading,
– The InvestPro Team

NIFTY : Trading levels and Plan for 02-Jan-2026(Timeframe: 15-min | Gap consideration: 100+ points)
Key Levels to Track (from chart)
Major Resistance Zone (Daily / ATH area): 26,336 – 26,386
Last Intraday Resistance: 26,288
Opening Resistance Zone: 26,160 – 26,182
Opening Support Zone: 26,089 – 26,098
Last Intraday Support: 26,023
Lower Support (Extreme): 25,945
🧠 Context: NIFTY is trading near an important daily resistance for potential new lifetime highs, hence reactions around resistance zones will be crucial. Expect volatility + traps.
🟢 1. GAP-UP OPENING (100+ Points)
If NIFTY opens above 26,182, it indicates bullish continuation attempt.
🎓 Educational Explanation:
Gap-up opens near higher-timeframe resistance often test buyer strength vs profit booking. Only sustained acceptance above resistance confirms continuation.
Plan of Action:
Avoid trading in first 10–15 minutes to let volatility settle.
Sustaining above 26,160–26,182 → bullish bias remains intact.
Fresh buying confirmation above 26,288 can push price toward 26,336–26,386.
Sharp rejection from 26,336+ zone may trigger intraday pullback.
Options traders: Prefer ATM / ITM Call buying or Bull Call Spread after retest & hold.
🟡 2. FLAT OPENING
If NIFTY opens between 26,100 – 26,160, market enters a balance / decision zone.
🎓 Educational Explanation:
Flat opens usually indicate indecision. Direction is confirmed only after range expansion. Patience is key to avoid whipsaws.
Plan of Action:
Holding above 26,160 keeps upside open toward 26,288.
Failure to cross 26,160–26,182 may result in sideways or pullback.
Breakdown below 26,089 increases probability of move toward 26,023.
Trade only after clear breakout / rejection with volume.
Options traders: Prefer non-directional strategies (Iron Fly / Short Strangle) if range persists.
🔴 3. GAP-DOWN OPENING (100+ Points)
If NIFTY opens below 26,089, early sentiment turns cautious.
🎓 Educational Explanation:
Gap-downs into support zones often see short covering or dip buying. Selling blindly near support increases reversal risk.
Plan of Action:
First support to watch: 26,089–26,098.
Break & acceptance below 26,089 → downside toward 26,023.
Failure to hold 26,023 may drag index to 25,945.
Strong bullish candles near supports may offer bounce trades.
Options traders: Prefer Put spreads instead of naked puts to control risk.
⚙️ Risk Management Tips for Options Trading 🛡️
Risk only 1–2% of capital per trade.
Avoid over-leveraging near all-time-high resistance zones.
Use time-based exits if premium stops moving for 15–20 minutes.
Book partial profits at resistance; don’t aim for extremes.
Avoid revenge trading on false breakouts.
Prefer ATM options or spreads over far OTM buying.
🧾 Summary & Conclusion
Above 26,182: Bulls stay active toward 26,288 → 26,336–26,386
Between 26,089–26,160: Market in balance → wait for confirmation
Below 26,089: Sellers gain control toward 26,023 → 25,945
Trade price reaction at levels, not emotions or headlines 🎯
Patience + discipline will matter more than aggression on such levels.
⚠️ Disclaimer
I am not a SEBI-registered analyst. This analysis is strictly for educational purposes only. Trading in markets involves risk. Please consult your financial advisor before taking any trade.

NIFTY : Trading levels and Plan for 01-Jan-2026📘 NIFTY Trading Plan for 1-Jan-2026
(Timeframe: 15-min | Gap consideration: 100+ points)
Key Levels from Chart
Last Intraday Resistance Zone: 26,336 – 26,386
Opening Resistance Zone: 26,160 – 26,182
Opening Support Zone: 26,057 – 26,083
Last Intraday Support: 26,019
Lower Support (Extreme): 25,944
🔍 Note: Price is approaching an important daily resistance area, so reactions near upper zones are critical for trend continuation.
🟢 1. GAP-UP OPENING (100+ Points)
If NIFTY opens above 26,160, it signals strength carrying forward from the previous session.
🎓 Educational Explanation:
Gap-up openings near higher-timeframe resistance often test buyer conviction. Acceptance above resistance confirms continuation, while rejection usually leads to healthy pullbacks.
Plan of Action:
Avoid trading in the first 10–15 minutes; let volatility settle.
Sustaining above 26,160–26,182 → bullish continuation likely.
Fresh buying confirmation above 26,182 can push price toward 26,336–26,386.
Rejection from 26,336+ may trigger intraday profit booking.
Options traders: Prefer ATM / ITM Calls after retest & hold; avoid chasing far OTM calls.
🟡 2. FLAT OPENING
A flat open around 26,100–26,150 places price inside a decision zone.
🎓 Educational Explanation:
Flat opens reflect temporary balance. The market usually gives one clean directional move after breaking either side of the opening range. Patience avoids whipsaws.
Plan of Action:
Holding above 26,160 keeps bullish bias active.
Failure near 26,160–26,182 may lead to consolidation or pullback.
Breakdown below 26,083 increases downside probability toward 26,019.
Only trade after a clear breakout or rejection with volume support.
🔴 3. GAP-DOWN OPENING (100+ Points)
If NIFTY opens below 26,083, early sentiment turns cautious.
🎓 Educational Explanation:
Gap-downs into support zones often attract short covering or value buying. Selling without confirmation near support increases reversal risk.
Plan of Action:
First support to watch: 26,057–26,083.
Breakdown and acceptance below 26,057 opens downside toward 26,019.
If 26,019 fails, next support lies near 25,944.
Strong bullish candles near supports can give intraday bounce trades.
⚙️ Risk Management Tips for Options Trading 🛡️
Avoid overtrading on the first trading day of the year.
Risk only 1–2% capital per trade.
Use time-based SL (15–20 mins) if premium stops moving.
Prefer ATM options or spreads near resistance zones.
Book partial profits at predefined levels; don’t wait for extremes.
Avoid emotional trades near all-time-high resistance areas.
🧾 Summary & Conclusion
Above 26,182: Bulls stay in control toward 26,336–26,386.
Between 26,083–26,160: Market in balance; wait for confirmation.
Below 26,083: Sellers gain control unless buyers defend 26,019.
Trade reaction at levels, not excitement around new-year moves 🎯.
Discipline + patience = consistency.
⚠️ Disclaimer
I am not a SEBI-registered analyst. This analysis is for educational purposes only. Markets involve risk; please consult your financial advisor before trading.

NIFTY : Trading levels and Plan for 31-Dec-2025NIFTY Trading Plan for 31-Dec-2025
(Timeframe: 15-min | Gap criteria considered: 100+ points)
Key Levels to Track (from chart)
Last Intraday Resistance: 26,159
Opening Resistance: 26,056
Opening Resistance / Support (Pivot Zone): 25,970 – 25,933
Opening Support (Gap-down case): 25,835
Lower Support (Extreme): 25,661
🟢 1. GAP-UP OPENING (100+ Points)
If NIFTY opens above 25,970, price starts above the pivot zone with scope for continuation.
🎓 Educational Explanation:
Gap-up opens show overnight strength, but continuation only comes with acceptance above key resistance. Many gap-ups initially retrace before choosing direction. Patience in the first few minutes improves risk-reward.
Plan of Action:
Avoid the first 10–15 minutes; observe price behaviour above 25,970.
Sustaining above 25,970–26,056 → bullish bias remains intact.
Break and acceptance above 26,056 opens upside toward 26,159.
Rejection near 26,056–26,159 may cause a pullback toward 25,970.
Options traders: Prefer ATM / ITM Calls only after confirmation; avoid chasing spikes.
🟡 2. FLAT OPENING
A flat open around 25,930–25,980 places NIFTY inside the pivot / balance zone.
🎓 Educational Explanation:
Flat openings indicate temporary balance between buyers and sellers. Direction usually emerges after a clear breakout or breakdown of the opening range. Trading inside the zone often leads to whipsaws and premium decay.
Plan of Action:
Sustaining above 25,970 keeps bullish bias toward 26,056 → 26,159.
Failure to cross 25,970 keeps price range-bound.
Breakdown below 25,933 signals weakness toward 25,835.
Look for bullish rejection candles near 25,933–25,970 for bounce trades.
🔴 3. GAP-DOWN OPENING (100+ Points)
If NIFTY opens below 25,933, early sentiment turns cautious to bearish.
🎓 Educational Explanation:
Gap-downs are often emotion-driven. Strong support zones can attract short-covering and value buying, so selling blindly into support increases reversal risk.
Plan of Action:
First support to watch is 25,835 — observe volume and candle structure.
Breakdown and acceptance below 25,835 opens downside toward 25,661.
Strong bullish reversal near 25,661 can lead to a sharp intraday bounce.
Any pullback toward 25,933 after breakdown can be used as sell-on-rise.
⚙️ Risk Management Tips for Options Trading 🛡️
Avoid trading the first 5–10 minutes on gap days.
Don’t buy options at resistance or sell at support without confirmation.
Use a time-based stop-loss (15–20 minutes) if premium stalls.
Risk only 1–2% of total capital per trade.
Prefer ATM options or defined-risk spreads to control theta decay.
Book partial profits near marked resistance/support levels.
🧾 Summary & Conclusion
Above 25,970: Bulls remain active; targets 26,056 → 26,159.
Between 25,933–25,970: Market stays balanced; patience is key.
Below 25,933: Sellers gain control unless buyers defend 25,835 / 25,661.
Trade price behaviour at levels, not predictions or emotions.
Consistency comes from discipline, confirmation, and risk control.
⚠️ Disclaimer
I am not a SEBI-registered analyst. This trading plan is for educational purposes only and should not be considered financial or investment advice. Please consult your financial advisor before taking any trades.

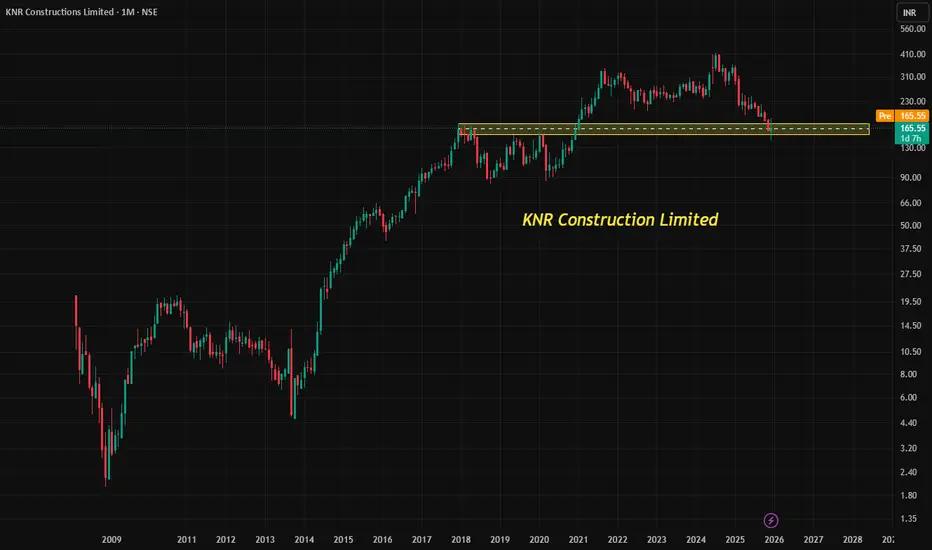
Understanding Resistance Turned Support & Doji Candle Patterns📈 Understanding Resistance Turned Support & Doji Candle Patterns: A Case Study on KNR Construction Limited
🔹 1. Resistance Turned Support Levels/Zone
Resistance is a price level where selling pressure historically outweighs buying, causing the stock to struggle moving higher.
When price breaks above resistance, that level often becomes a support zone. This is because traders who missed buying earlier now see it as a favorable entry point, while previous sellers may re-enter as buyers.
This phenomenon is called “role reversal” in technical analysis: resistance becomes support, and vice versa.
👉 In KNR Construction Limited, the price has approached such a resistance-turned-support zone around ₹167, making it a critical level to watch.
🔹 2. Doji Candle Pattern at Support Levels
A Doji candle forms when the opening and closing prices are nearly equal, reflecting indecision between buyers and sellers.
At support levels, a Doji can signal:
Sellers are losing strength.
Buyers may step in to defend the level.
A potential trend reversal or consolidation.
The reliability of a Doji increases when it appears at key support zones, especially after a downtrend or correction.
👉 KNR Construction’s monthly chart shows a Doji at support, hinting at possible stabilization and a chance for buyers to regain control.
🔹 3. Current Opportunity in KNR Construction Limited
With price at ₹167 near its support zone, the stock presents a potential buying opportunity for swing or positional traders.
The Doji pattern adds weight to the idea that the level could hold, offering a low-risk entry point.
🔹 4. Risk Management: Stop Loss Strategy
No trade is complete without risk management. Here’s how traders can approach it:
Entry Zone: Around ₹167 (current support).
Stop Loss: Place below the support zone, to protect against breakdowns.
Target Levels: If support holds, price could retest higher resistance zones
Risk-Reward Ratio: Aim for at least 1:2, meaning potential reward should be atleast twice the risk.
📊 Key Takeaways
Resistance turned support is a powerful concept in technical analysis, often marking strong zones for entry.
A Doji candle at support signals indecision but can precede reversals when combined with strong levels.
KNR Construction Limited’s chart setup offers a textbook example of these principles, but disciplined stop loss placement is essential to manage risk.
INFY | Weekly Bullish Options Setup | 30 Dec ExpiryTrade Structure:
• Sell 1640 PE
• Buy 1600 PE
• Defined-risk bull put spread
Why this setup works for NSE:INFY
INFY is showing a clear recovery from the lower band with improving momentum. RSI has turned up from the mid-zone and ROC is trending higher, suggesting strength is building rather than fading.
Price holding above the 1620–1640 support zone keeps downside limited, while steady IV makes short-premium structures efficient for the week.
View
Moderately bullish — expecting INFY to hold above support and grind higher.
This video is for education only. It’s not financial advice or a recommendation to trade.
#INFY #NiftyIT #WeeklyOptions #OptionsTrading #IndiaFNO #BullPutSpread #OptionSeller #PriceAction #NSEStocks #MarketAnalysis

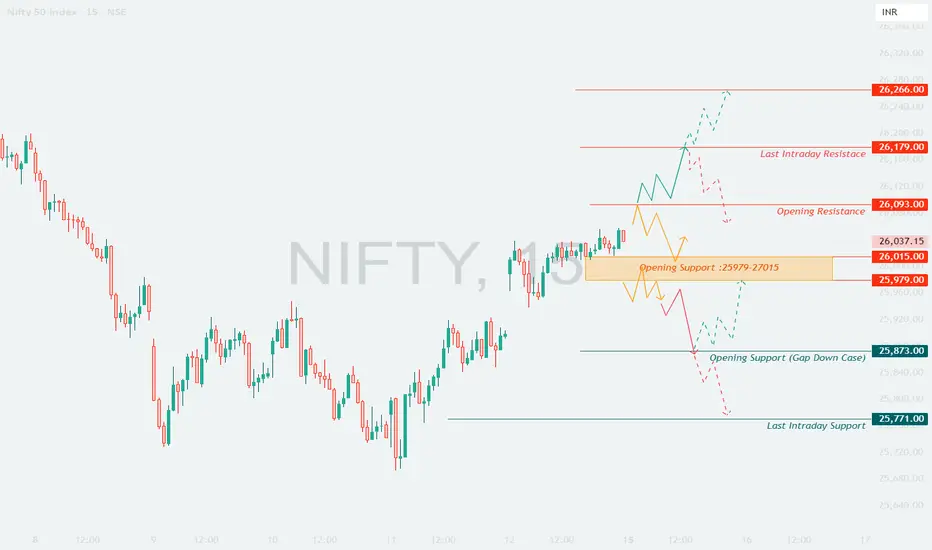
NIFTY : Trading levels and Plan for 15-Dec-2025📊 NIFTY – TRADING PLAN FOR 15 DEC 2025
Nifty closed near 26,037, just above a key support band (Opening Support: 25,979–26,015) and below a series of overhead resistances.
The session will heavily depend on how price reacts at:
Opening Support Zone: 25,979 – 26,015
Opening Resistance: 26,093
Last Intraday Resistance: 26,179
Major Upside Target: 26,266
Opening Support (Gap-down case): 25,873
Last Intraday Support: 25,771
Let’s break down every opening scenario.
🚀 1. GAP–UP OPENING (100+ points)
A gap-up above 26,130–26,150 shows strong bullish intent.
1. If Nifty opens above 26,093 but below 26,179
• Market opens directly inside resistance.
• Do NOT chase long immediately.
• Wait for either:
– Breakout above 26,179, followed by retest → Long toward 26,266.
– Rejection at 26,179, falling back under 26,093 → Short toward 26,015.
2. If Nifty opens above 26,179
• Strong bullish continuation.
• On a retest of 26,179, a long becomes high-probability.
• Targets: 26,220 → 26,266.
• Book partial profits in the final target zone.
3. If gap-up is between 26,015–26,093
• Price opens slightly above support and may retest the zone.
• If 26,015–25,979 holds → Long toward 26,093 → 26,179.
• If 26,015 breaks with momentum, move to caution; market becomes vulnerable to deeper pullbacks.
⚖ 2. FLAT OPENING (near 25,980–26,030)
A flat open near support allows clearer early structure.
1. If 25,979–26,015 holds as strong support
• Watch for bullish rejection candles or higher lows.
• Long setups valid toward 26,093 → 26,179.
2. Break above 26,093 with a retest
• Confirms directional strength.
• Target becomes 26,179 → 26,266.
3. If price rejects 26,093 early and falls back
• Sideways consolidation may form inside the orange zone.
• Only short when 25,979 breaks convincingly.
• Downside targets: 25,873 → 25,771.
📉 3. GAP–DOWN OPENING (100+ points)
Expected gap-down region: 25,930–25,850.
1. If opening is near 25,873 (Gap-down Support)
• Avoid shorting blindly; it’s a strong demand zone.
• Look for reversal patterns (wick rejections, CHoCH).
• If confirmed → Long toward 25,979 → 26,015.
2. If opening falls below 25,873
• Market enters weak territory.
• Next support is 25,771 (Last Intraday Support).
• A retest of 25,873 after breakdown → Short toward 25,771.
3. If 25,771 also breaks
• Trend turns bearish for the session.
• Expect extended downside movement; avoid bottom fishing.
• Trail SL aggressively if short.
🛡 RISK MANAGEMENT GUIDELINES FOR OPTIONS TRADERS
1. Avoid trading first 3–5 minutes, especially on gap days (IV distortion).
2. Keep SL based on spot levels, not premium fluctuation alone.
3. Prefer ATM/ITM options for directional trades — better risk control.
4. Do NOT average losing positions — cut losers quickly.
5. Avoid deep OTM options unless using them for hedging.
6. Book partial profits at intermediate levels to lock in gains.
7. If VIX rises sharply → favor option selling with hedges.
8. Maximum daily loss limit = 1–2% of capital. Stop trading once hit.
📌 SUMMARY & CONCLUSION
• Bullish bias only above 26,093, with confirmation above 26,179.
• Upside target zone: up to 26,266.
• Neutral/choppy zone: 25,979–26,093. Confirm structure before entering.
• Downside risk: Below 25,979, real weakness begins.
• Major supports for reversal: 25,873 and 25,771.
Stay patient, avoid emotional trades, and trade only on confirmation.
⚠ DISCLAIMER
I am not a SEBI-registered analyst.
This trading plan is for educational purposes only and should not be treated as investment advice.
Always conduct your own analysis and follow strict risk management.
NIFTY 50 – Price Action & Market Structure AnalysisCurrent Price: ~26,050
Market Context: Post-rally consolidation near ATH supply
🔹 Higher Timeframe (Weekly) Structure
NIFTY remains in a primary bullish market structure on the weekly timeframe.
The index has consistently respected Higher Highs (HH) and Higher Lows (HL) since the March reversal.
Price is currently consolidating below a clearly defined weekly supply zone near 26,300–26,500, indicating distribution rather than reversal.
No weekly Break of Structure (BOS) to the downside has occurred yet — bullish structure remains intact.
Key Weekly Levels
Weekly Supply / Resistance: 26,300 – 26,500
Weekly Demand / Support: 25,200 – 25,000
Major HTF Demand: 24,400 – 24,000
🔹 Daily Timeframe – Internal Structure
After the strong impulsive leg up, price entered a range-bound corrective phase.
A Minor Market Structure Shift (MSS) occurred on the daily chart, confirming short-term weakness, not a trend reversal.
Price is trading inside a premium zone, suggesting limited upside without deeper consolidation.
Multiple Fair Value Gaps (FVGs) below remain unmitigated — increasing probability of a pullback.
Daily Levels of Interest
Immediate Resistance: 26,200 – 26,350
Range Support: 25,750 – 25,600
Daily Demand Zone: 25,400 – 25,200
Invalidation Level (Bullish): Daily close below 25,200
🔹 Market Scenarios
Scenario 1 – Healthy Bullish Continuation
Price retraces into 25,400–25,200 demand
Liquidity sweep + bullish displacement
Continuation toward 26,600+
Scenario 2 – Extended Consolidation
Range persists between 25,600–26,300
Ideal environment for mean-reversion & intraday trading
Scenario 3 – Deeper Correction (Low Probability)
Weekly close below 25,000
Opens path toward 24,400 HTF demand
🔹 Trading Bias
Bias: Bullish on dips, cautious near highs
Environment: Distribution / consolidation
Strategy Preference: Buy at HTF demand, avoid chasing highs
📌 Conclusion
NIFTY is not bearish, but overextended in the short term. The current price action suggests smart money digestion, not distribution breakdown. Patience is required for high-probability entries at discounted levels.

HINDUNILVR | 30 Dec ExpiryTrade Idea
• Sell 2260 CE @ 35.00
• Buy 2300 CE @ 17.60
• Quantity: 300 each
• Defined-risk bear call spread
NSE:HINDUNILVR
Analysis -
Price has rolled over from the upper band with momentum weakening. RSI is slipping below the mid-zone and ROC has turned negative, suggesting limited upside in the near term.
IVs are modest and evenly placed across strikes, keeping the call spread efficient. The 2300 zone sits well above recent rejection, favouring a sideways-to-down bias for the week.
This post is for education only. It’s not financial advice or a recommendation to trade.

NIFTY : Trading levels and Plan for 12-Dec-2025📊 NIFTY TRADING PLAN — 12 DEC 2025
Nifty closed around 25,898, trading between the Opening Support (25,851.80) and the Opening Resistance / Support Zone (25,979–26,015).
The chart shows a clear structure: clean upside potential above 26,015 and downside continuation below 25,812.
Key Levels from Chart:
• Opening Support: 25,851.80
• Last Intraday Support: 25,812
• Opening Resistance / Support Zone: 25,979 – 26,015
• Last Intraday Resistance: 26,093
• Major Resistance / Target: 26,179
• Lower Support: 25,741
Tomorrow’s opening direction relative to 25,979–26,015 will define the day’s trend.
🚀 1. GAP-UP OPENING (100+ points)
A gap-up above 25,980–26,020 places Nifty directly inside or above the resistance zone.
1. If opening is inside 25,979–26,015 (Resistance/Support Zone)
• Do NOT buy immediately — this is a supply zone.
• Wait for a clear breakout above 26,015 and then a retest.
• When retest holds → Long entry becomes high probability.
• Targets: 26,093 → 26,179 (major upside level).
• Partial profit booking recommended near 26,093.
2. If opening is above 26,015
• Momentum is already bullish.
• Wait for a small retracement → If price holds 26,015 → Long toward:
→ 26,093 → 26,140 → 26,179
3. If opening is directly near 26,093 (Last Intraday Resistance)
• Avoid fresh longs — sellers may react.
• If rejection occurs + price drops below 26,015, shorts become valid.
• Downside targets: 25,979 → 25,930.
📌 Educational Note:
Gap-ups into resistance zones often trap aggressive buyers. Always demand a breakout + retest to confirm genuine strength.
⚖ 2. FLAT OPENING (around 25,870–25,910)
When the market opens flat, price action around the nearest levels becomes the deciding factor.
1. If price breaks above 25,979 and holds
• A bullish shift begins.
• Long setups activate on retest of 25,979–26,015 zone.
• Targets: 26,093 → 26,179.
2. If price rejects 25,979–26,015
• A short-term pullback is likely.
• Short entries valid toward 25,851 → 25,812.
3. If price remains between 25,851–25,979
• Expect sideways, indecisive movement.
• Avoid trading in this segment until direction becomes clear.
📌 Educational Note:
Flat opens give the highest probability trend days because early structure (higher-low or lower-high) defines bias clearly.
📉 3. GAP-DOWN OPENING (100+ points)
A gap-down near 25,800–25,750 brings price toward strong support levels.
1. If price opens at or near 25,851 (Opening Support)
• Avoid shorting immediately.
• Wait for confirmation — if support holds, a reversal long is possible.
• Targets: 25,930 → 25,979.
2. If price opens near 25,812 (Last Intraday Support)
• Very strong reversal zone.
• Look for bullish wick rejection / CHoCH.
• If confirmed → Long toward 25,851 → 25,930 → 25,979.
3. If price opens near 25,741 or breaks below 25,812 with momentum
• Downside continuation likely.
• Short setups activate on retest of 25,812 from below.
• Targets: 25,760 → 25,741 → 25,700.
📌 Educational Note:
Gap-downs often attempt to sweep liquidity at support before reversal. Confirmation is more important than prediction.
🛡 RISK MANAGEMENT TIPS FOR OPTIONS TRADERS
1. Avoid first 5 minutes after gap opens — premium swings are unpredictable.
2. Avoid buying far OTM options — IV crush and theta decay work against you.
3. Use price-action-based stop-loss, not premium-based.
4. Limit risk per trade to 1–2% of capital.
5. High IV → Favour option selling;
Low IV → Option buying becomes more effective.
6. Always book partial profits at key levels:
25,979 / 26,015 / 26,093 / 26,179
7. Avoid revenge trading — protect capital first.
📌 SUMMARY & CONCLUSION
• Bullish bias only above 25,979–26,015, with targets at 26,093 → 26,179.
• Sideways zone between 25,851–25,979 — avoid trades unless a breakout occurs.
• Strong downside support zones:
– 25,851
– 25,812
– 25,741
• Breakout + retest is the safest and most reliable setup.
• Follow strict risk control to avoid losses in volatile conditions.
⚠ DISCLAIMER
I am not a SEBI-registered analyst.
This report is for educational purposes only and should not be considered investment advice.
Market conditions can change rapidly — always use your own discretion and risk management.

NIFTY : Trading levels and Plan for 09-Dec-2025📊 NIFTY TRADING PLAN — 09 DEC 2025
Nifty closed around 25,933, sitting just below Opening Resistance/Support (25,958).
Price remains in a corrective structure but is approaching major intraday support below.
Key Levels from the chart:
• Opening Resistance / Support: 25,958
• Last Intraday Resistance: 26,082
• Major Resistance: 26,136
• Last & Important Support Zone: 25,770 – 25,812
• Deeper Support: 25,732
Market sentiment is still fragile, and tomorrow’s opening will determine short-term direction.
🚀 1. GAP-UP OPENING (100+ points)
A gap-up above 26,020–26,050 places price close to the last intraday resistance cluster.
1. If price opens above 25,958 and retests it successfully
• Do NOT chase the opening candle.
• Wait for a retest of 25,958 showing bullish confirmation (wick rejection or CHoCH).
• Long entry activates → Targets: 26,082 → 26,136.
• Book partial profits near 26,082 as sellers previously reacted there.
2. If gap-up opens inside the resistance band (26,082–26,136)
• Avoid fresh longs — this zone is historically a rejection area.
• Look for bearish signs → If rejection occurs → Short only after price falls under 25,958.
• Downside targets: 25,900 → 25,850.
3. If price breaks and sustains above 26,136
• Strong bullish momentum.
• Next targets: 26,200 → 26,240.
• Trail stop-loss to protect profits.
📌 Educational Note:
Gap-ups typically require validation — breakouts without retests often fail. Always wait for a confirmation candle.
⚖ 2. FLAT OPENING (around 25,900–25,950)
Flat opens allow clean level-by-level trading and reduce whipsaw risk.
1. If price reclaims 25,958 and sustains
• Bulls gain early strength.
• Long trades activate on breakout + retest.
• Targets: 26,020 → 26,082 → 26,136.
2. If price rejects 25,958
• Lower-high formation indicates weakness.
• Short trades become valid toward 25,880 → 25,812.
3. If price trades between 25,900–25,958 initially
• Expect range-bound movement.
• Buy only near the lower range boundary with support confirmation.
• Sell only at the upper boundary with resistance confirmation.
📌 Educational Note:
Flat openings expose the true intention of the first 15–30 mins. Structural clarity matters more than speed.
📉 3. GAP-DOWN OPENING (100+ points)
A gap-down into 25,850–25,780 brings price directly into the strongest demand region on the chart.
1. If price opens inside 25,770–25,812 (Last & Important Support Zone)
• Absolutely avoid shorting this zone — strong buying expected.
• Wait for reversal candle patterns (hammer, engulfing, CHoCH).
• If reversal confirmed → Long toward 25,900 → 25,958.
2. If price opens near 25,732
• This is deeper support.
• Look for absorption of selling → If reversal appears → Long with targets:
→ 25,812 → 25,900.
3. If 25,732 breaks decisively
• Avoid catching a falling knife.
• Wait for a retest of 25,732.
• If retest rejects → Short continuation toward 25,670 → 25,620.
📌 Educational Note:
Gap-downs sweep liquidity. Smart money accumulates at support before trend reversals. Patience is key.
🛡 RISK MANAGEMENT TIPS FOR OPTIONS TRADERS
1. Do NOT trade the first 5 minutes after a gap opening.
Premiums fluctuate wildly.
2. Avoid buying far OTM options after a big gap.
IV crush + theta decay = quick capital loss.
3. Use strict stop-loss based on price levels, not premium.
4. Never risk more than 1–2% of your capital on a single trade.
5. High IV → Option selling strategies (credit spreads) work better.
Low IV → Option buying becomes more effective.
6. Book partial profits near key reaction levels:
25,958 / 26,082 / 26,136.
7. Avoid revenge trading — protect capital first.
📌 SUMMARY & CONCLUSION
• Bullish bias above 25,958, with targets toward 26,082 → 26,136.
• Choppy or neutral zone between 25,900–25,958 until breakout.
• Strong bullish reversal zones:
– 25,770–25,812
– 25,732
• Always trade with confirmation — retest entries provide the highest reliability.
• Strict risk management is essential in volatile conditions.
⚠ DISCLAIMER
I am not a SEBI-registered analyst.
This trading plan is purely for educational purposes and should not be considered investment advice.
Market conditions can change rapidly — always use your own judgment and proper risk controls.

NIFTY : Trading levels and Plan for 08-Dec-2025📊 NIFTY TRADING PLAN — 08 DEC 2025
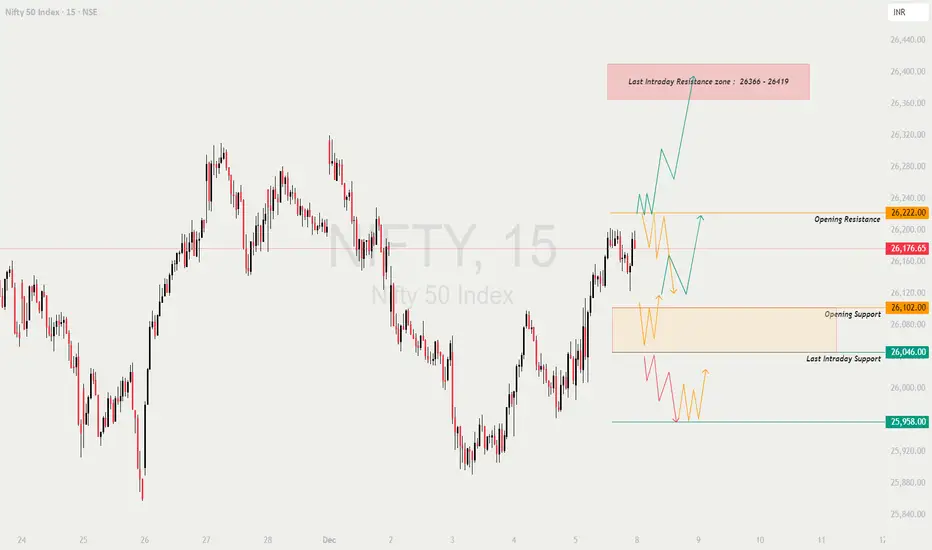
NIFTY closed around 26,176, sitting just between the Opening Resistance (26,222) and the Opening Support zone (26,102).
Tomorrow’s opening reaction at these levels will decide whether Nifty continues upward into the major resistance zone or retraces back into support.
Levels from the chart:
• Opening Resistance: 26,222
• Opening Support: 26,102
• Last Intraday Support: 26,046
• Major Buyer’s Support: 25,958
• Last Intraday Resistance Zone: 26,366 – 26,419
A clear directional move will come only after Nifty exits the Opening Support–Opening Resistance region.
🚀 1. GAP-UP OPENING (100+ points)
A gap-up above 26,260+ puts Nifty near or above the Opening Resistance and may trigger trend continuation.
1. If price opens above 26,222 and retests it
• Avoid jumping in at the open.
• Wait for price to retest 26,222 and show bullish structure (wick rejections, CHoCH).
• Once confirmed → Long entry toward 26,300 → 26,366 → 26,419 (resistance zone).
• Book partial profits inside the resistance zone.
2. If price opens directly inside 26,366–26,419 (Last Intraday Resistance Zone)
• Avoid fresh longs here — high probability of intraday rejection.
• Look for bearish wick rejections → Short opportunity back toward 26,300 → 26,222.
3. If price gives a strong breakout above 26,419
• This indicates momentum expansion.
• Upside targets open toward 26,480–26,520.
• Trail your stop-loss below the breakout candle.
📌 Educational Note:
Gap-ups must be traded with confirmation and retests, not emotions. Institutions test breakout zones before continuing trend.
⚖ 2. FLAT OPENING (around 26,160–26,190)
A flat open near the middle of the chart’s structure gives excellent clarity for level-by-level trading.
1. Sustained move above 26,222
• Break + retest above this level activates longs.
• Targets: 26,300 → 26,366 → 26,419.
2. If price rejects 26,222
• Look for bearish rejection or CHoCH.
• Short trade valid toward 26,102.
• Break below 26,102 extends move to 26,046.
3. If price trades inside 26,102–26,222 zone
• Expect consolidation / whipsaws.
• Trade only extremes:
– Long only near 26,102 with confirmation.
– Short only near 26,222 with confirmation.
📌 Educational Note:
Flat opens allow structure to form naturally. Higher-lows = bullish. Lower-highs = bearish. Avoid guessing—react to levels.
📉 3. GAP-DOWN OPENING (100+ points)
A gap-down toward 26,000 → 25,960 puts NIFTY directly into major supports.
1. If price opens near 26,046 (Last Intraday Support)
• This is a strong reaction zone.
• Do NOT short blindly here.
• Look for reversal candles → If confirmed → Long toward 26,102 → 26,176.
2. If price opens inside 25,958 (Major Buyer’s Support)
• Expect buyers to defend this level aggressively.
• Ideal place for a reversal trade.
• Once reversal confirmed → Target 26,046 → 26,102.
3. If price breaks below 25,958 decisively
• Avoid catching falling knives.
• Wait for a retest of 25,958 zone.
• If retest rejects → Short continuation target becomes 25,900–25,870.
📌 Educational Note:
Gap-downs often create liquidity sweeps. Smart money accumulates positions at support before pushing price higher. Always trade reaction, not prediction.
🛡 RISK MANAGEMENT TIPS FOR OPTIONS TRADERS
1. Avoid trading first 5 minutes during gap openings.
High volatility = premium traps.
2. Do NOT buy far OTM calls/puts after big gaps.
IV crush + theta → Fast losses.
3. Always use price-action-based stop losses, not premium-based ones.
4. Never risk more than 1–2% of capital per trade.
5. High IV → Prefer option selling (credit spreads).
Low IV → Option buying becomes favourable.
6. Take partial profits at important levels such as:
26,102 / 26,222 / 26,366 / 26,419.
7. Avoid revenge trading — protect capital at all costs.
📌 SUMMARY & CONCLUSION
• Bullish bias above 26,222, with targets: 26,300 → 26,366 → 26,419.
• Range-bound structure likely between 26,102–26,222 until breakout.
• Strong reversal zones:
– 26,046
– 25,958
• Gap openings must be handled with retest-based entries only.
• Trade level-to-level with strict risk management.
⚠ DISCLAIMER
I am not a SEBI-registered analyst.
This trading plan is strictly for educational purposes and not investment advice.
Market behaviour can change quickly—always use your own judgment and risk controls.
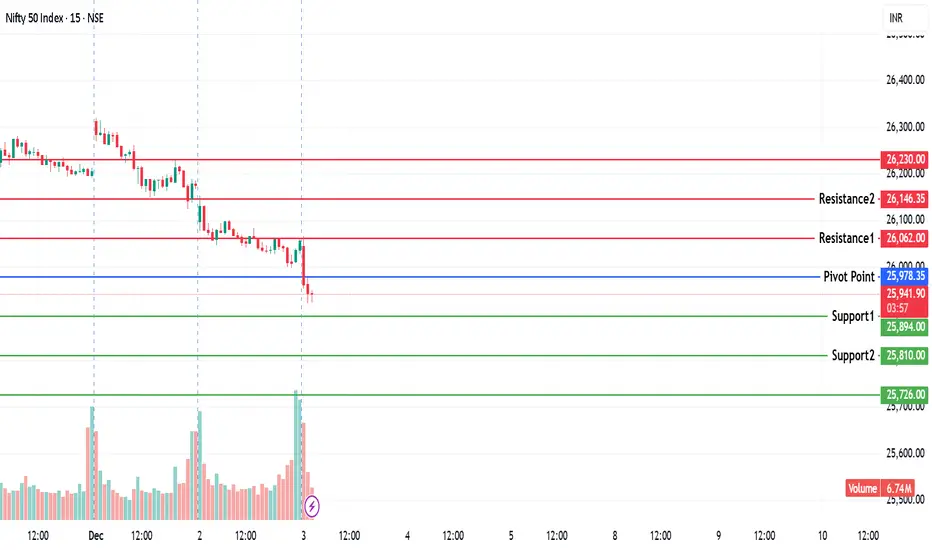
NIFTY KEY LEVELS FOR 03.12.2025NIFTY KEY LEVELS FOR 03.12.2025
Timeframe: 3 Minutes
If the candle stays above the pivot point, it is considered a bullish bias; if it remains below, it indicates a bearish bias. Price may reverse near Resistance 1 or Support 1. If it moves further, the next potential reversal zone is near Resistance 2 or Support 2. If these levels are also broken, we can expect the trend.
When a support or resistance level is broken, it often reverses its role; a broken resistance becomes the new support, and a broken support becomes the new resistance.
If the range(R2-S2) is narrow, the market may become volatile or trend strongly. If the range is wide, the market is more likely to remain sideways
please like and share my idea if you find it helpful
📢 Disclaimer
I am not a SEBI-registered financial adviser.
The information, views, and ideas shared here are purely for educational and informational purposes only. They are not intended as investment advice or a recommendation to buy, sell, or hold any financial instruments.
Please consult with your SEBI-registered financial advisor before making any trading or investment decisions.
Trading and investing in the stock market involves risk, and you should do your own research and analysis. You are solely responsible for any decisions made based on this research
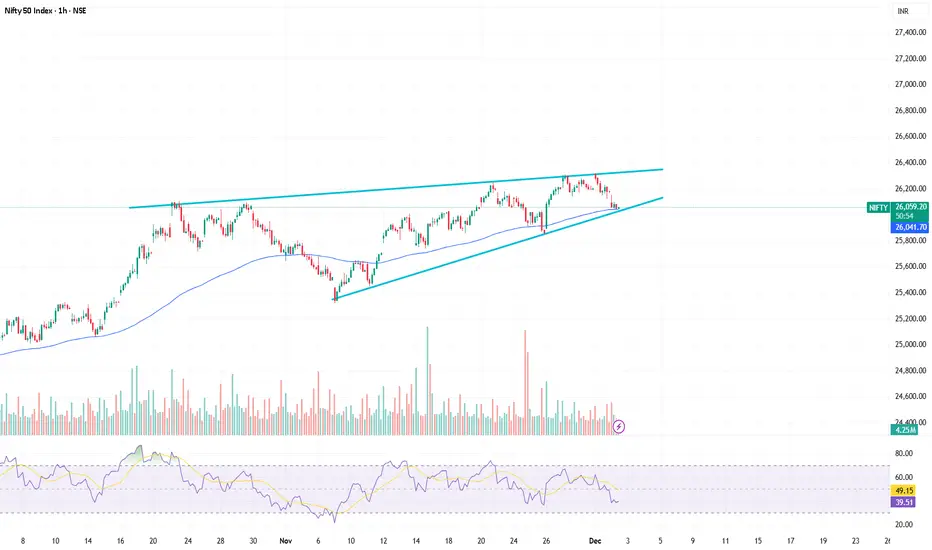
NIfty Hourly Strong SupportHello Friends,
Nifty Spot at 26050-60 having support of EMA100 along with trendline support and RSI oversold in hourly ......Overall Momentum is Bullish this is good DIP expceting 26400,26500,26700+ in coming few sessions