NIFTY : Trading levels and Plan for 01-Sep-2025📊 NIFTY TRADING PLAN – 01-Sep-2025
📌 Key Levels to Watch :
Opening Resistance / Support: 24,510
Last Intraday Resistance: 24,639
Profit Booking Zone: 24,744 – 24,785
Opening Support Zone: 24,327 – 24,367
Last Intraday Support: 24,236
These zones act as the pivot areas where buyers and sellers will actively fight for control.
🔼 1. Gap-Up Opening (100+ points above 24,510)
If Nifty opens with a sharp gap-up above 24,510, momentum will likely favor the bulls.
📌 Plan of Action :
Sustaining above 24,639 (last intraday resistance) will keep upward momentum intact.
Targets to watch on the upside are 24,744 – 24,785 (profit booking zone), where sellers may emerge.
If rejection happens at 24,639, expect consolidation or a mild pullback towards 24,510.
👉 Educational Note: Gap-up openings often see initial profit booking. Traders should avoid chasing prices immediately—wait for a retracement and confirmation before entering.
➖ 2. Flat Opening (Around 24,430 – 24,510)
If Nifty opens flat near its current levels, price action around 24,510 will be critical.
📌 Plan of Action :
Holding above 24,510 can lead to a move towards 24,639, followed by 24,744 – 24,785.
If the index fails to sustain 24,510, it may retest the 24,327 – 24,367 opening support zone.
A breakdown below 24,327 could invite further selling pressure.
👉 Educational Note: Flat openings often provide the cleanest trading opportunities since markets test both support and resistance before choosing direction.
🔽 3. Gap-Down Opening (100+ points below 24,327)
If Nifty opens below the 24,327 – 24,367 support zone, bearish sentiment may dominate.
📌 Plan of Action :
Immediate downside target becomes 24,236 (last intraday support).
If 24,236 breaks decisively, deeper selling pressure may emerge, leading to extended weakness.
Reversal signs near 24,236 (like bullish wicks or volume spikes) may present intraday buying opportunities for quick scalps.
👉 Educational Note: Gap-downs usually trigger panic selling at open. Avoid shorting at extreme lows—wait for a pullback before entry.
🛡️ Risk Management Tips for Options Traders
Stick to defined stop-losses , preferably based on hourly closes.
Risk only 1–2% of your capital per trade.
Consider spreads (Bull Call / Bear Put) to control premium decay.
Book profits in parts—don’t wait for exact targets.
Avoid overtrading during volatile swings; wait for price to respect levels.
📌 Summary & Conclusion
🟢 Above 24,639 → Bullish momentum towards 24,744 – 24,785 .
🟧 Flat opening → Watch 24,510 as pivot; above bullish, below cautious .
🔴 Below 24,327 → Weakness towards 24,236 (critical support) .
🎯 Key battle zones: 24,510 (pivot) & 24,327 (support).
⚠️ Disclaimer: I am not a SEBI-registered analyst. This analysis is shared only for educational purposes and should not be considered investment advice. Please consult your financial advisor before trading.
Niftyoptions

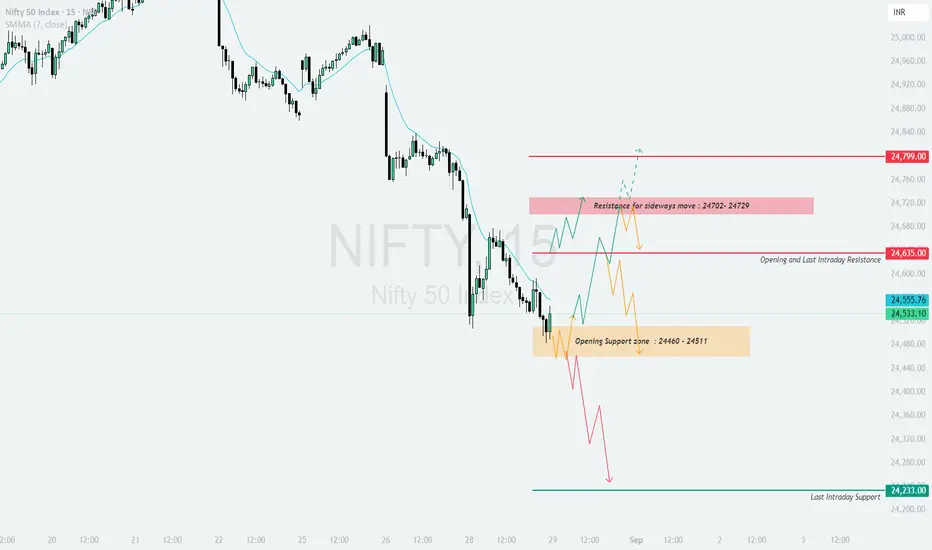
NIFTY : Trading levels and plan for 29-Aug-2025📊 NIFTY TRADING PLAN – 29-Aug-2025
📌 Key Levels to Watch :
Opening & Last Intraday Resistance: 24,635
Resistance Zone for Sideways Move: 24,702 – 24,729
Major Resistance Above: 24,799
Opening Support Zone: 24,460 – 24,511
Last Intraday Support: 24,233
These levels highlight the battlefield where intraday buyers and sellers are likely to show their strength.
🔼 1. Gap-Up Opening (100+ points above 24,635)
If Nifty opens with a strong gap above 24,635, bullish momentum can extend.
📌 Plan of Action :
Sustaining above 24,702–24,729 (sideways resistance) can lift the index towards 24,799.
This zone is ideal for partial profit booking as supply pressure may emerge.
If the index fails to sustain above 24,702, expect sideways consolidation between 24,635–24,729 before any decisive move.
👉 Educational Note: On large gap-ups, avoid chasing momentum in the first 15 minutes. Wait for a pullback towards support for better risk-reward trades.
➖ 2. Flat Opening (Around 24,533 ± 50 points)
If Nifty opens flat near its current levels, the market will test supports and resistances for direction.
📌 Plan of Action :
Holding above 24,511 will keep momentum intact for a test of 24,635.
A breakout above 24,635 may lead to a rally towards 24,702–24,729.
On the other hand, slipping below 24,460 may invite selling pressure, opening the path to 24,233.
👉 Educational Note: Flat openings often lead to choppy sessions. Patience is crucial—wait for clear candle closes around levels before making a move.
🔽 3. Gap-Down Opening (100+ points below 24,460)
If Nifty opens sharply below 24,460, sellers will maintain an upper hand.
📌 Plan of Action :
Below 24,460, weakness can accelerate towards 24,233 (last intraday support).
Strong demand may emerge near 24,233; watch for long wicks or bullish reversal candles for intraday buying opportunities.
If 24,233 breaks decisively, the next phase of downside may trigger a deeper sell-off.
👉 Educational Note: Gap-downs often cause panic. Stick to your trading levels and avoid counter-trend entries unless there’s strong confirmation.
🛡️ Risk Management Tips for Options Traders
Limit risk to 1–2% of capital per trade .
Use hourly close stop-losses for confirmation.
Consider spreads (Bull Call / Bear Put) to reduce time decay impact.
Book profits in parts—don’t wait for exact top or bottom.
Track India VIX closely, as volatility affects option premiums.
📌 Summary & Conclusion
🟢 Above 24,635 → Rally towards 24,702–24,729 → 24,799 possible .
🟧 Flat near 24,533 → Watch 24,511 (support) and 24,635 (resistance) for breakout .
🔴 Below 24,460 → Weakness towards 24,233 (critical support zone) .
🎯 The tug-of-war lies between 24,460–24,635—whichever side breaks first will decide intraday trend.
⚠️ Disclaimer: I am not a SEBI-registered analyst. This trading plan is purely for educational purposes and should not be considered investment advice. Please do your own research or consult a financial advisor before trading.
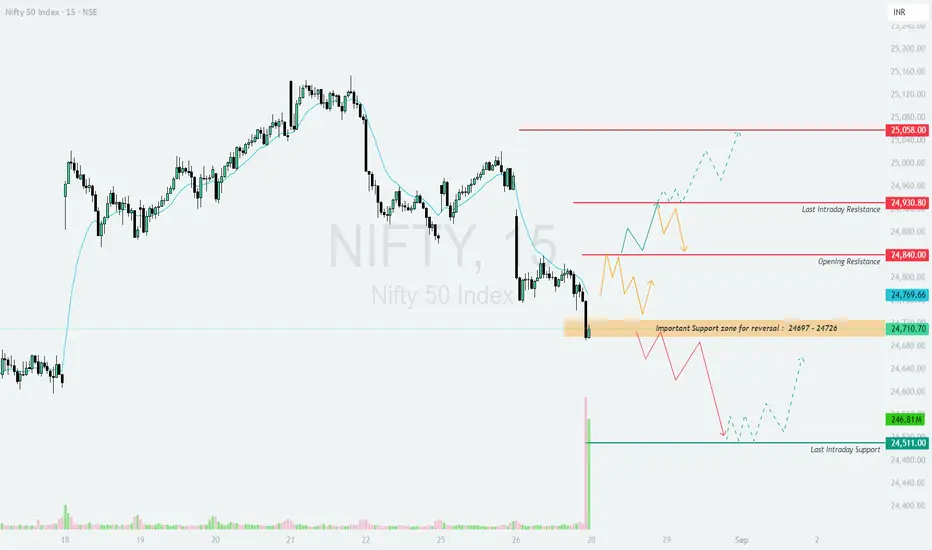
NIFTY : Trading levels and plan for 28-Aug-2025📊 NIFTY TRADING PLAN – 28-Aug-2025
📌 Key Levels to Watch :
Opening Resistance: 24,840
Last Intraday Resistance: 24,930
Major Resistance Above: 25,058
Important Support Zone for Reversal: 24,697 – 24,726
Last Intraday Support: 24,511
These levels will guide our decision-making depending on the type of opening.
🔼 1. Gap-Up Opening (100+ points above 24,840)
If Nifty opens above 24,840, bullish momentum will be active.
📌 Plan of Action :
Sustaining above 24,930 will likely attract buyers towards 25,058, which is the major resistance zone.
If Nifty fails to hold above 24,930, profit booking may drag it back to 24,840 support zone.
A breakout above 25,058 can extend the rally further, but this should be traded cautiously, as upside may face profit booking.
👉 Educational Note: Gap-ups often trigger early volatility due to overnight positions. Avoid chasing at the open; wait for confirmation candles before entering.
➖ 2. Flat Opening (Around 24,710 – 24,769)
A flat start around the immediate support/resistance range will decide short-term direction.
📌 Plan of Action :
If Nifty sustains above 24,769, it may gradually climb towards 24,840 → 24,930.
If it breaks below 24,697–24,726 (Reversal Zone), weakness may drag it down towards 24,511 (Last Intraday Support).
In flat openings, allow the first 30 minutes to define direction before committing capital.
👉 Educational Note: Flat openings are best suited for range traders in the first half, later moving into breakout mode once levels are breached.
🔽 3. Gap-Down Opening (100+ points below 24,697)
If Nifty opens below 24,697, it will show clear bearish pressure.
📌 Plan of Action :
Below 24,697, the index can slip quickly towards 24,511 (Last Intraday Support).
Any bounce from this zone should be treated as an opportunity to re-test resistances, not fresh bullish entry, unless sustained.
If 24,511 is broken with volume, a deeper fall may continue with more downside levels opening up.
👉 Educational Note: On gap-down days, follow the trend instead of trying to catch falling knives. Look for retests of broken supports before initiating shorts.
🛡️ Risk Management Tips for Options Traders
Risk only 1–2% of capital per trade.
Use hourly closing basis stop-loss for directional trades.
On gap-up/gap-down days, avoid naked options; prefer spreads to manage risk.
Do not overtrade if levels remain choppy between 24,769 – 24,840 (no-trade zone).
Track India VIX ; high VIX = wider stop-loss needed, low VIX = tight stop-loss.
📌 Summary & Conclusion
🟢 Above 24,930 → Possible upside to 25,058 .
🟧 Flat near 24,769 → Wait for breakout/breakdown .
🔴 Below 24,697 → Downside towards 24,511 .
🎯 Key Zone: 24,697 – 24,726 (Reversal Zone) will act as a pivot for the day.
⚠️ Disclaimer: I am not a SEBI-registered analyst. This analysis is purely for educational purposes and should not be considered financial advice. Please consult your financial advisor before making trading/investment decisions.
August Iron Condor Setup on Nifty – Premium Eating Strategy!Hello Traders!
Just like we nailed the July Iron Condor, here comes the fresh setup for August expiry.
Nifty is trading around 24680 and we are seeing tight range movement with no clear trend for now. In such times, Iron Condor becomes a powerful income-generating strategy for option sellers, especially if the market stays within a defined range.
So here's the plan:
Strategy Type:
Bullish Iron Condor on Nifty (28th August 2025 expiry)
Position Details:
Sell 2x 24300 PE @ 130.05
Buy 2x 23800 PE @ 53.75
Sell 2x 25000 CE @ 172.50
Buy 2x 25500 CE @ 49.30
Strategy payoff graph:
Strategy Rationale:
We’ve created a wide range between 24101 to 25199 as our breakeven zone. As long as Nifty stays in this range by expiry, we collect full premium and enjoy time decay.
Why We Call It Bullish Iron Condor:
We’ve kept the Put side tighter and Call side slightly wider, meaning we have a bullish bias but still want to benefit from a range-bound expiry.
Rahul Tip:
Don’t go for iron condors blindly, always check for major events, news, or breakout signals. A sudden breakout or breakdown can flip your setup. Adjust or exit if market moves out of your defined zone.
Disclaimer:
This strategy is for educational purposes only. Please do your own risk management and position sizing. Avoid taking full quantity at once — better to scale in once the range confirms.
NIFTY : Trading levels and Plan for 26-Aug-2025📊 NIFTY TRADING PLAN – 26-Aug-2025
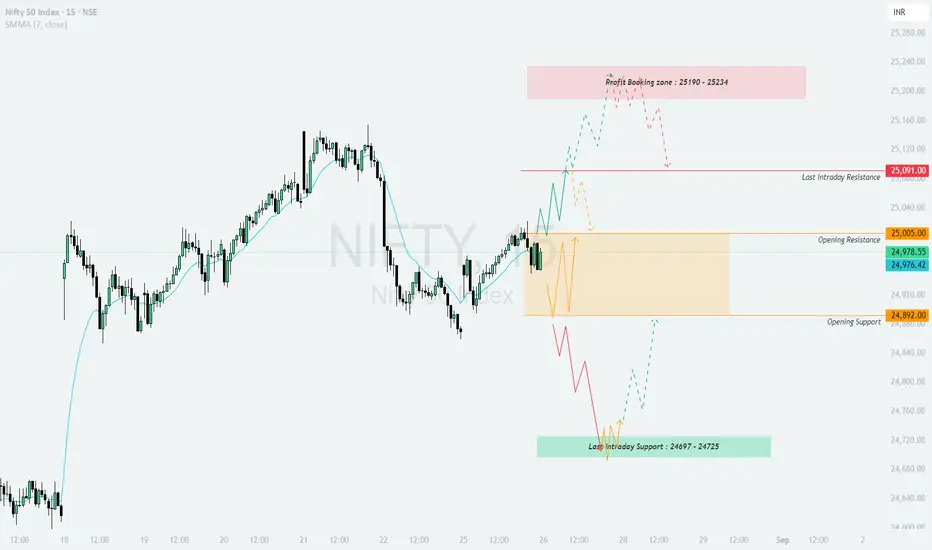
On 25-Aug-2025, Nifty closed at 24,978, positioned between critical levels. The key support and resistance zones for tomorrow are:
Opening Support: 24,892
Opening Resistance: 25,005
Last Intraday Resistance: 25,091
Profit Booking Zone: 25,190 – 25,234
Last Intraday Support: 24,697 – 24,725
Now let’s go through possible scenarios.
🔼 1. Gap-Up Opening (100+ points above 25,091)
If Nifty opens above 25,091, it directly enters the bullish zone.
📌 Plan of Action:
Watch for sustainability above 25,091 in the first 15–30 minutes. If sustained, the index can march towards the Profit Booking Zone 25,190 – 25,234.
In this zone, expect some consolidation or profit booking. Fresh long positions should be cautious here.
If 25,234 is taken out convincingly, it may lead to another strong rally, but chasing at higher levels 🚫 is risky.
Failure to sustain above 25,091 may result in a pullback toward the 25,005 – 24,892 zone.
👉 Tip: On gap-ups, avoid aggressive buying at open. Wait for retracements near support to enter for better risk–reward.
➖ 2. Flat Opening (Around 24,892 – 25,005)
A flat start around the opening support–resistance zone will be a deciding factor for intraday trend.
📌 Plan of Action:
If Nifty sustains above 25,005, it will likely attempt a breakout towards 25,091 → 25,190–25,234 zone.
Failure to hold 24,892 will open downside towards 24,725 – 24,697 (Last Intraday Support).
In flat openings, the first 30 minutes are crucial. Let the index pick direction before entering.
👉 Tip: For options traders, flat openings are best for straddle/strangle adjustments. Capture volatility once direction confirms.
🔽 3. Gap-Down Opening (100+ points below 24,892)
If Nifty opens below 24,892, it will show bearish pressure right from the start.
📌 Plan of Action:
Below 24,892, the index can test the Last Intraday Support Zone: 24,725 – 24,697.
Buyers may attempt to defend this support, so expect a bounce opportunity here (good for scalpers).
If 24,697 is broken with volume, further downside continuation may occur.
Avoid panic shorts at the open — wait for a retest of resistance before entering for safer trades.
👉 Tip: After a gap-down, use put spreads instead of naked puts to manage risk in case of sharp reversals.
🛡️ Risk Management Tips for Options Traders
Risk only 1–2% of your capital per trade.
Always trade with a defined stop-loss . Do not average losing positions.
Avoid over-leveraging, especially in weekly expiry sessions ⚡.
Prefer spreads (Bull Call, Bear Put, Iron Condors) to reduce premium decay impact.
Track India VIX 📉 before entering — high VIX means bigger moves, low VIX means range-bound.
📌 Summary & Conclusion
🟢 Above 25,091 → 25,190–25,234 (Profit Booking Zone) .
🟧 Flat around 24,892–25,005 = Wait for breakout/breakdown confirmation .
🔴 Below 24,892 → 24,725–24,697 (Buyer’s defense zone) .
Key Pivot: 24,892 – 25,005 zone for intraday trend.
⚠️ Disclaimer: I am not a SEBI-registered analyst. This analysis is purely for educational purposes and should not be considered financial advice. Please consult a financial advisor before making trading/investment decisions.
NIFTY : Trading level and plan for 25-Aug-2025Nifty Trading Plan for 25-Aug-2025
Key Levels from Chart:
Opening Resistance → 24,940
Opening Support → 24,809
Last Intraday Resistance → 25,021
Major Resistance Zone → 25,097
Last Intraday Support Zone → 24,703 – 24,729
Previous Close → 24,869.45
🚀 Scenario 1: Gap Up Opening (100+ points above previous close)
If Nifty opens above 24,970–25,000, bullish momentum may dominate the early session.
Immediate hurdle will be 25,021 (Last Intraday Resistance). If sustained, price can extend toward 25,097 zone where sellers are likely to emerge.
A rejection near 25,021–25,097 could bring the index back to retest 24,940 (Opening Resistance turned support).
Sustaining above 25,097 would be a strong bullish breakout, but the risk-reward for fresh longs reduces beyond this point.
💡 Plan of Action : Look for long entries above 25,021 with strict SL below 24,940. Target 25,097. If gap-up fails to hold and price slips below 24,940, consider cautious shorts for a move back to 24,809.
📊 Scenario 2: Flat Opening (within ±50–80 points of 24,870)
Flat openings often lead to consolidation before a breakout.
Price between 24,809 – 24,940 is a tight trading range, and whipsaws are common here.
Breakout above 24,940 can open upside toward 25,021 – 25,097.
Breakdown below 24,809 signals weakness, leading toward 24,729 zone (last intraday support).
💡 Plan of Action : Avoid aggressive trading inside 24,809–24,940. Take positions only after breakout above 24,940 (longs) or breakdown below 24,809 (shorts). Patience will protect you from false moves in a range.
⚠️ Scenario 3: Gap Down Opening (100+ points below previous close)
If Nifty opens near 24,750 or below, sellers will control the session.
First key level is 24,729–24,703 support zone. If held, expect a bounce toward 24,809–24,940 for intraday recovery.
If this support zone breaks decisively, downside opens further, and panic selling may take the index lower.
Failure to sustain below 24,703 can trap shorts, leading to sharp reversals upward.
💡 Plan of Action : Go short only if 24,703 breaks with strong volume, targeting lower levels. For scalpers, a bounce from 24,703–24,729 can be used for quick longs with a strict SL below 24,700.
📌 Risk Management Tips for Options Traders 💡
On gap openings, avoid chasing inflated premiums . Wait for price stabilization before entering.
Prefer spreads (bull call/bear put) over naked options to reduce theta decay risk.
Always set stop-loss on option positions — market can reverse quickly.
Keep intraday position sizing small (2–3% of capital per trade).
Use time-based exits (e.g., exit 30–45 mins before market close) if levels are not reached.
📝 Summary & Conclusion
Above 24,940, bullish bias can push Nifty toward 25,021 – 25,097 🚀.
Between 24,809 – 24,940, the market may consolidate ⚖️, avoid overtrading.
Below 24,809, weakness likely toward 24,703 – 24,729 ⚠️.
Below 24,703, strong downside risk opens.
👉 Key message: Stay disciplined, trade only on breakouts/breakdowns, and manage risk strictly.
⚠️ Disclaimer
I am not a SEBI registered analyst. This analysis is purely for educational purposes . Please consult your financial advisor before making any trading or investment decisions.

NIFTY : Trading levels and plan for 22_Aug-2025📌 Nifty Trading Plan for 22-Aug-2025
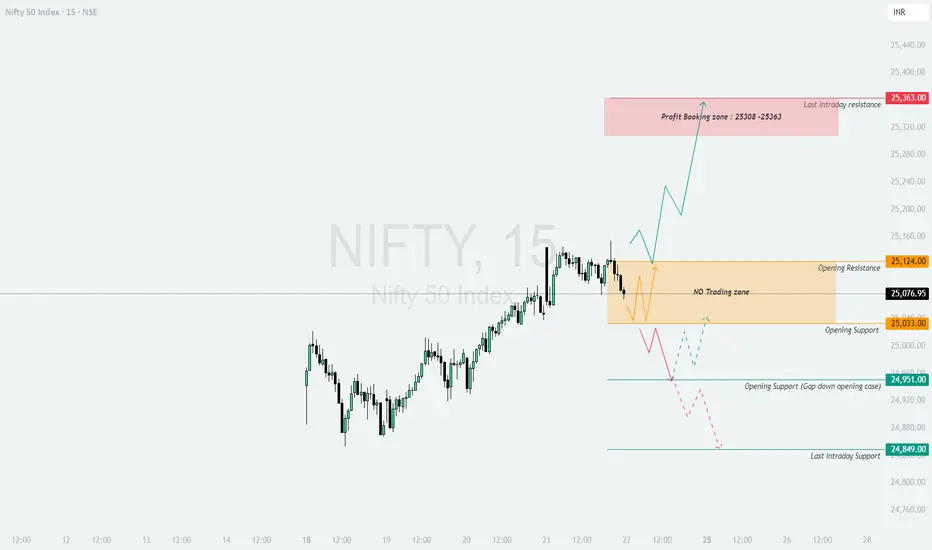
Key Levels from Chart:
Opening Resistance → 25,124
Opening Support → 25,033
Profit Booking Zone (Last Intraday Resistance) → 25,308 – 25,363
Opening Support in Gap Down Case → 24,951
Last Intraday Support → 24,849
Previous Close → 25,076.95
🚀 Scenario 1: Gap Up Opening (100+ points above previous close)
If Nifty opens above 25,175+, bullish sentiment will dominate the early session.
Immediate hurdle is 25,308 – 25,363 (Profit Booking Zone). Traders should expect selling pressure here as short-term players may book gains.
Sustaining above 25,363 can extend momentum further, but risk-reward weakens for fresh longs.
If rejection happens from 25,308–25,363, index could retest 25,124 support.
💡 Plan of Action : Look for long trades above 25,124 with confirmation, targeting 25,308–25,363. Trail stop-loss below 25,033. Book partials at resistance and avoid fresh longs if market looks tired near highs.
📊 Scenario 2: Flat Opening (within ±50–80 points of 25,077)
Flat openings often cause range-bound moves until a breakout.
Price between 25,033 – 25,124 is a No Trading Zone . Avoid entering inside this range to prevent whipsaws.
Breakout above 25,124 can trigger a rally toward 25,308 – 25,363 zone.
Breakdown below 25,033 opens weakness toward 24,951.
💡 Plan of Action : Stay patient. Go long only above 25,124 or short below 25,033. Inside range, avoid overtrading and save capital for directional clarity.
⚠️ Scenario 3: Gap Down Opening (100+ points below previous close)
If Nifty opens near 24,950 or below, sellers will dominate.
Support at 24,951 may attract intraday buying or short-covering bounce toward 25,033.
If 24,951 breaks decisively, expect further downside toward 24,849 (Last Intraday Support).
Failure to sustain below 24,951 can trap shorts, leading to a recovery back to 25,124 resistance zone.
💡 Plan of Action : Go short only if 24,951 breaks with volume, keeping stop-loss above 25,033. For scalpers, a bounce from 24,951 can be used for quick longs with strict SL.
📌 Risk Management Tips for Options Traders 💡
Never chase option premiums after a big gap — premiums are inflated, wait for retracements.
Stick to defined-risk strategies (spreads, butterflies) instead of naked buying.
Always use stop-loss on options since time decay works against buyers.
Avoid over-leveraging — allocate not more than 2–3% capital per trade.
Book partial profits near key levels 🎯 and trail the rest.
📝 Summary & Conclusion
Above 25,124, momentum can extend toward 25,308 – 25,363, where profit booking is expected 🚀.
Between 25,033 – 25,124, market is in a No Trading Zone ⚖️. Avoid traps.
Below 25,033, weakness toward 24,951, and if broken → 24,849 ⚠️.
👉 The day will be highly level-driven, and patience is key. Trade only at breakouts/breakdowns for clear setups.
⚠️ Disclaimer
I am not a SEBI registered analyst. This analysis is purely for educational purposes . Please consult your financial advisor before making any trading or investment decision.
14 Aug 2025 - Change of stance on Nifty at 24500 levelsNifty Stance Bullish 🐂
Nifty changed its stance from bearish to bullish on 12th August, Tuesday. If you are following me on Trading view, you would have got the email once this EMA crossover happened. Interestingly, Nifty made this reversal after a decent trend of 473 points.
Even though the reversal came, Nifty is still unable to break out from the resistance level of 24620. We are still hovering around 40 points away from the last crossover signal at 24580.
US markets, which are hitting a new high every day, compare this to our markets, which are tired and lacking momentum. We might need fresh triggers to escape from these levels and the US-India trade deal could be a big reason.
A possible trigger could be either a monetary policy relaxation (reduction of repo rates) or a fiscal policy relaxation (decrease in taxes) to boost production/consumption. We cannot reduce our repo rates, as the current 5.5% rate is only 1% higher than the US Fed rate of 4.5%. If we reduce our repo further, our debt and money market will crash, which points us to the only option of a tax cut.

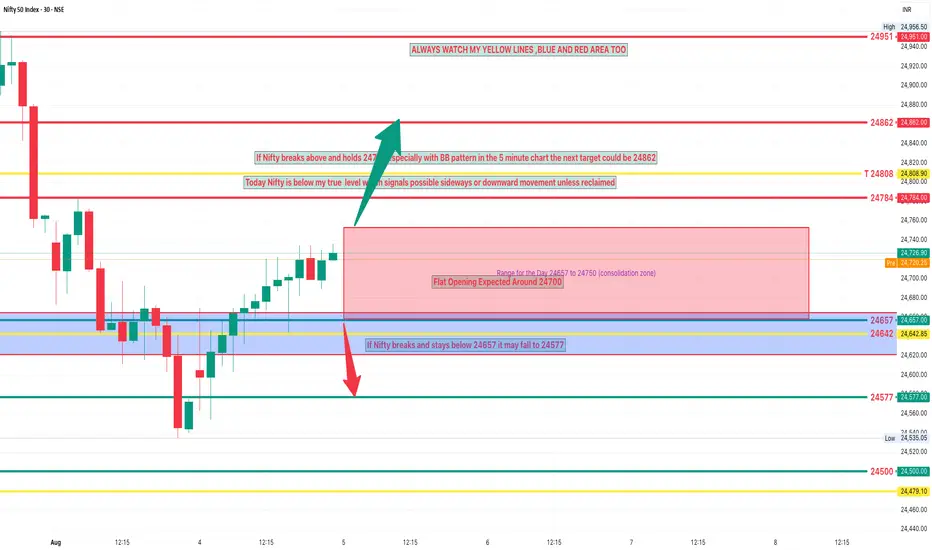
NIFTY Analysis 5 AUGUEST, 2025 ,Morning update at 9 amProfit booking and consolidation in a narrow range
Technical Pattern Indicates weakness above resistance and price struggling to break higher levels
Observe whether Nifty closed below or above the derived my levels
Today Nifty is below my true level which signals possible sideways or downward movement unless reclaimed
Expected Price Action Today
Flat Opening Expected Around 24700
Range for the Day 24657 to 24751 (consolidation zone)
Upside Trigger: If Nifty breaks above and holds 24751 especially with bb pattern in the 5 minute chart the next target could be 24862
Downside Trigger If Nifty breaks and stays below 24657 it may fall to 24577
Support 24657 ,24577 , 24500
Resistance 24784 ,24862 , 24951
if you have any problem too undestanding my levels or in trading msg me.
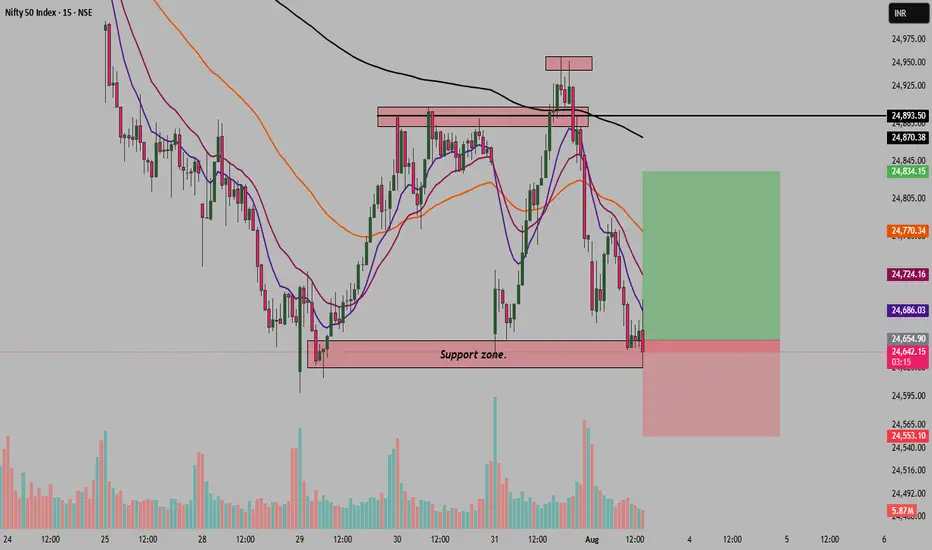
Nifty Trading near to support zone, reversal setup in nifty!Hello Traders!
After opening weak and testing previous support zones, Nifty is now showing signs of intraday recovery. The zone around 24,660–24,620 has acted as demand earlier, and once again buyers seem to be stepping in from the same level.
If this recovery sustains, there’s a good opportunity on the call side.
Here’s the exact trade setup I’m following today.
Trade Setup:
Instrument: Nifty 24600 CE – 7th August Expiry
Current Price: 175
Add More: Around 150–155
Stop Loss: 130
Targets: 200 / 228 / 260++
Risk Management Notes:
Position Sizing: Avoid large positions, this is an intraday recovery trade
SL Discipline: Follow stop loss strictly if price fails to hold
Disclaimer:
This is not a buy or sell recommendation. Trade shared for educational purpose only. Please follow your own analysis and risk management before taking any trade.
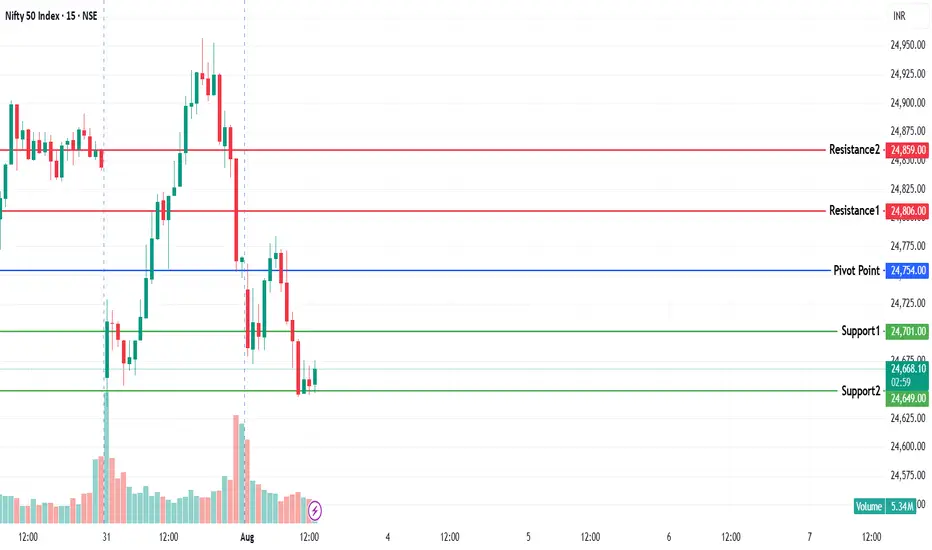
NIFTY KEY LEVELS FOR 01.08.2025NIFTY KEY LEVELS FOR 01.08.2025
If the candle stays above the pivot point, it is considered a bullish bias; if it remains below, it indicates a bearish bias. Price may reverse near Resistance 1 or Support 1. If it moves further, the next potential reversal zone is near Resistance 2 or Support 2. If these levels are also broken, we can expect the trend.
If the range(R2-S2) is narrow, the market may become volatile or trend strongly. If the range is wide, the market is more likely to remain sideways
📢 Disclaimer
I am not a SEBI-registered financial adviser.
The information, views, and ideas shared here are purely for educational and informational purposes only. They are not intended as investment advice or a recommendation to buy, sell, or hold any financial instruments.
Please consult with your SEBI-registered financial advisor before making any trading or investment decisions.
Trading and investing in the stock market involves risk, and you should do your own research and analysis. You are solely responsible for any decisions made based on this research.
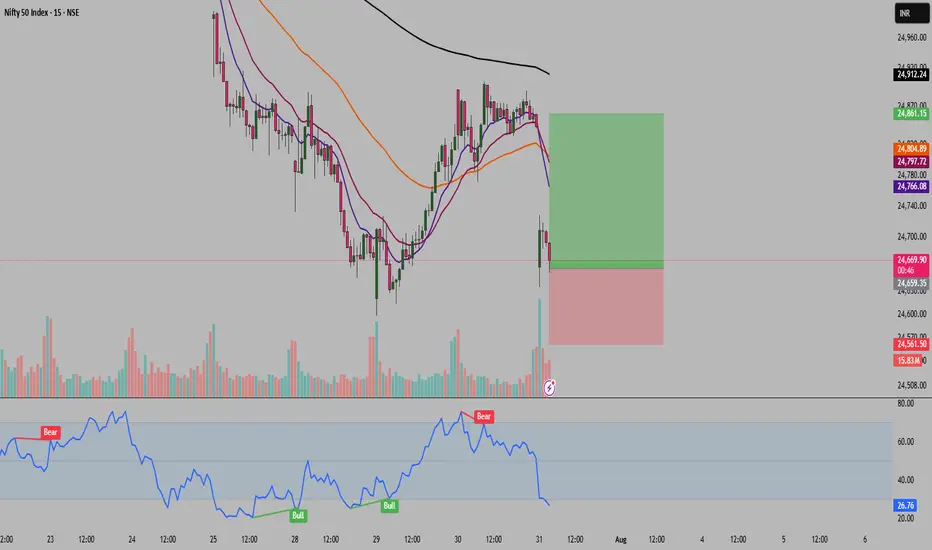
Trading the Dip: My Nifty Options Setup for This Gap Down MarketHello Traders!
Hope you all are doing good.
Today Nifty opened with a significant gap down. The reason? Fresh news about the US under Donald Trump’s policy imposing a 25% tariff on Indian goods. This triggered panic among investors, and we saw aggressive selling at the open.
But I believe this reaction could be short-lived. Local DIIs have been showing strong buying interest every single day, and I expect them to support the market again today. That’s why I’m looking for a potential intraday recovery from lower levels.
So instead of joining the panic, I’m planning a contra trade on Nifty.
Trade Setup: Buying naked Ce with stop loss
Buy Nifty 7th August 24650 CE, now at 180
Add 1 More lot around 155-160 levels if price dropss
Keep stop loss around 120
Targets will be 210/246/290++
Another Trade Setup: Options writing(selling) with hedging strategy
Bullish Iron Condor Setup (Neutral-to-Bullish View):
For traders who prefer risk-defined strategies, I’ve also deployed a bullish iron condor with a limited risk, targeting consolidation or moderate recovery by expiry.
Sell: 2x 25050 CE @ 44.45
Buy: 2x 25300 CE @ 17.30
Buy: 2x 24550 PE @ 103.60
Sell: 2x 24800 PE @ 217.95
Note:- All Strike from 7th Aug expiry
Key Metrics:
Max Profit: 21,225
Max Loss: 16,275
Breakeven Range: 24659 to 25191
Max RR Ratio: 1:1.3
Margin Required: ~2 lakhs Rs.
The idea here is to stay profitable if Nifty consolidates or mildly recovers over the next few sessions. If there’s no deep fall or sharp rally, this setup will benefit from theta decay and defined movement.
Risk Management Notes:
Strict stop loss is a must. Do not hold beyond SL under any condition
This is a contra trade, so avoid heavy positions
Recommended quantity: 1 or 3 lots only
Rahul Tip:
Market reacts fast to global headlines, but strong hands don’t panic. If your view is backed by logic and risk is managed, sometimes going against the crowd gives the best opportunities.
Conclusion:
The dip was sharp, but the reaction might be overdone. Let’s watch for signs of intraday strength. If buyers step in, this call option trade can work out well. Trade light, and trade with discipline.
Disclaimer: This idea is for educational purposes only. Do your own research before taking any trade.
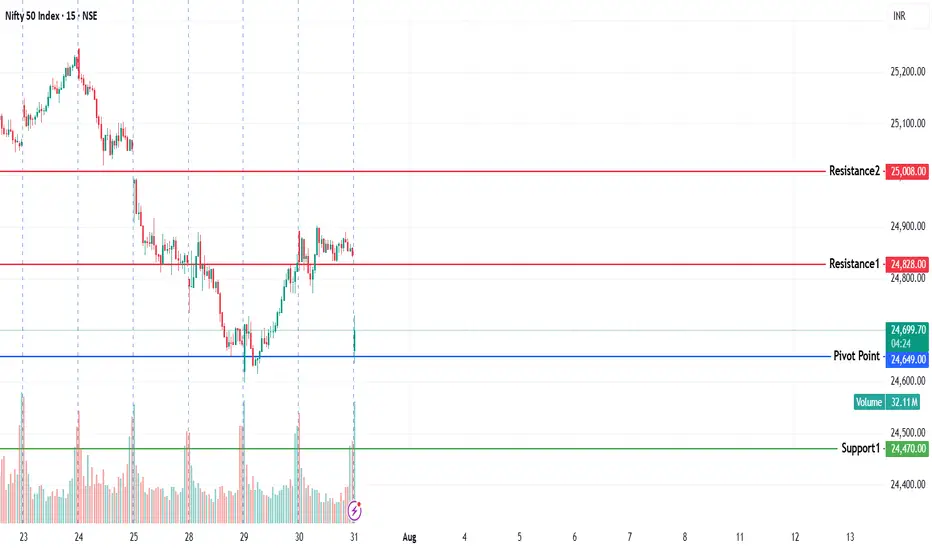
NIFTY KEY LEVELS FOR 31.07.2025NIFTY KEY LEVELS FOR 31.07.2025
If the candle stays above the pivot point, it is considered a bullish bias; if it remains below, it indicates a bearish bias. Price may reverse near Resistance 1 or Support 1. If it moves further, the next potential reversal zone is near Resistance 2 or Support 2. If these levels are also broken, we can expect the trend.
If the range(R2-S2) is narrow, the market may become volatile or trend strongly. If the range is wide, the market is more likely to remain sideways
📢 Disclaimer
I am not a SEBI-registered financial adviser.
The information, views, and ideas shared here are purely for educational and informational purposes only. They are not intended as investment advice or a recommendation to buy, sell, or hold any financial instruments.
Please consult with your SEBI-registered financial advisor before making any trading or investment decisions.
Trading and investing in the stock market involves risk, and you should do your own research and analysis. You are solely responsible for any decisions made based on this research.
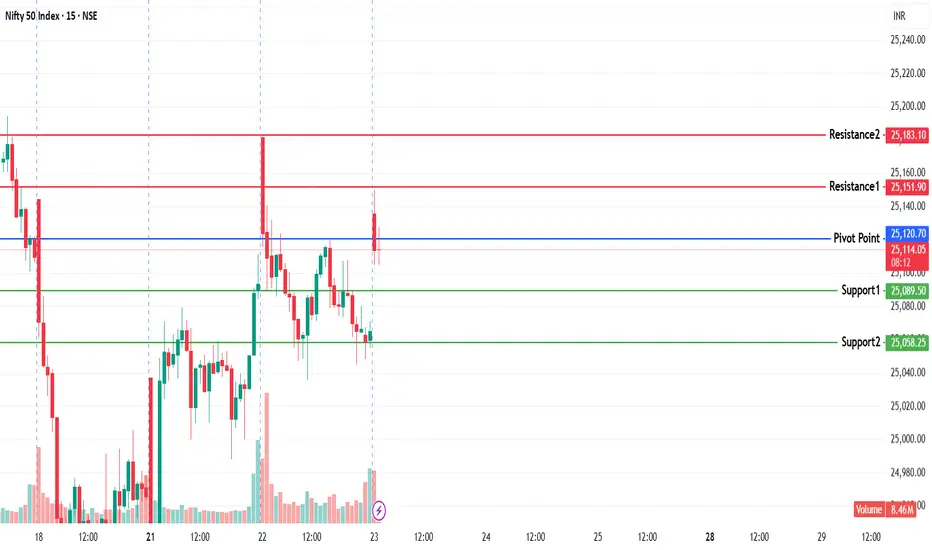
NIFTY KEY LEVELS FOR 23.07.2025NIFTY KEY LEVELS FOR 23.07.2025
If the candle stays above the pivot point, it is considered a bullish bias; if it remains below, it indicates a bearish bias. Price may reverse near Resistance 1 or Support 1. If it moves further, the next potential reversal zone is near Resistance 2 or Support 2. If these levels are also broken, we can expect the trend.
If the range is narrow, the market may become volatile or trend strongly. If the range is wide, the market is more likely to remain sideways
📢 Disclaimer
I am not a SEBI-registered financial adviser.
The information, views, and ideas shared here are purely for educational and informational purposes only. They are not intended as investment advice or a recommendation to buy, sell, or hold any financial instruments.
Please consult with your SEBI-registered financial advisor before making any trading or investment decisions.
Trading and investing in the stock market involves risk, and you should do your own research and analysis. You are solely responsible for any decisions made based on this research.
nifty1. if nifty touch raising channel resistance tomorrow then pattern will change then nifty is sideways to bullish in short-term .
2. if nifty touch resistance on 23 july then only we get perfect entry for short.
note: on 23 july we can see doji candle in daily .if not then wait.
tomorrow nifty is bullish. any day we see a doji candle above 25300. then we can sell on next day or on the same day after 3pm.
if you want to short on top then keep eye on 23 july. on 23 if touch rising channel resistance then we can short.
but,
on 23 nifty is sideways and form a doji candle in daily basis.

NIfty50 analysis for 23/07/2025nifty has been in a bearish trend over the past week and recently faced a strong rejection from the 25180–25200 zone, which aligns with a key resistance level on the daily time frame. price action suggests a possible retracement toward the 24780–24800 support zone. this area holds significance as a potential demand zone. it’s crucial to observe price behavior around this level — a strong reaction here could offer clues for the next directional move. wait for confirmation before taking any fresh positions.
Big Move? No Problem – Sell CE and Let Theta Work!Hello Traders!
We’ve all seen those days when the market opens with a big gap-up or gives a strong rally – and most traders start panicking. But if you’ve been into option writing, you know that’s exactly when opportunity shows up.
High IV + inflated premiums = perfect setup to sell Calls (CE) and let Theta (time decay) do all the work for you.
Why this works so well after a big move:
CEs become expensive:
After a sharp rally, call options are overpriced. That’s your edge as a seller.
Theta kicks in fast:
If price starts to cool off or even just go sideways, the time decay starts eating the premium quickly.
Price usually settles down:
Markets don’t rally forever. After a big move, some pause or pullback is very common.
You don’t need to be 100% right:
Even if the price doesn’t fall, you still make money as long as it doesn’t fly through your strike.
Some ground rules for this strategy:
Sell Out-of-the-Money (OTM) Calls:
Pick a strike that’s at least 1–2% away from current price with decent premium.
Find nearby resistance:
Sell near technical resistance zones where price usually slows down.
Don’t sell into crashing IV:
Make sure IV is still high. If it's already falling, your edge is gone.
Always use a stop loss:
Set a level where you'll exit if the trade goes against you. Never hold naked without a plan.
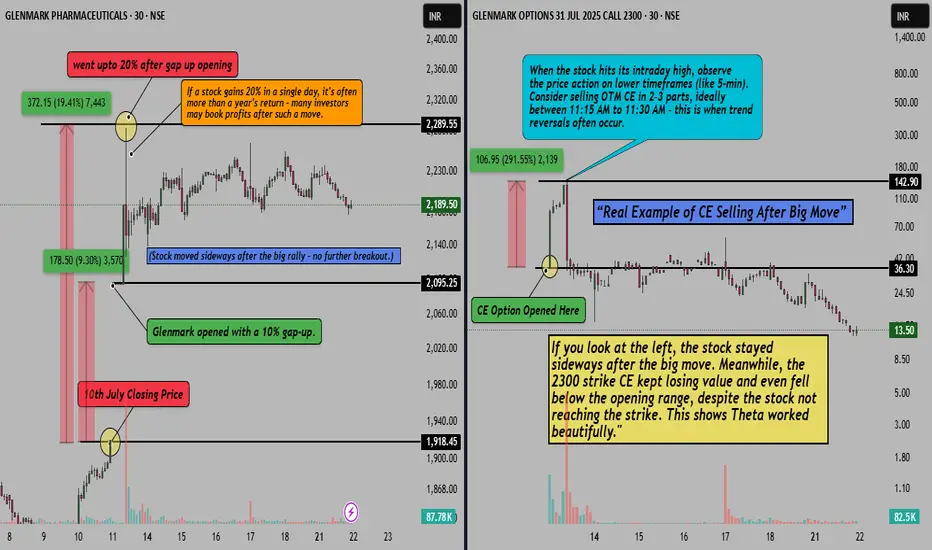
Let’s Talk Real Example – Glenmark 2300 CE Sell
Check the chart above 👆
Glenmark gave a huge 10% gap-up and rallied up to 20% intraday . That’s a crazy move – and we know what that means: CEs were loaded with premium .
So around 11:15 AM (when the stock hit the top), we started selling the 2300 strike OTM CE .
What happened next?
Price went sideways. No breakout. But the premium kept falling hard. Even though price didn’t hit 2300, CE collapsed – pure Theta magic!
Rahul’s Tip
When premiums are juicy after a big move, you don’t need to do much. Just sell smart, manage your risk, and let Theta take care of the rest.
Final Thoughts:
CE selling isn’t about catching reversals. It’s about taking advantage of overpriced options and letting time work for you.
So next time the market gives a big rally, don’t chase it. Just chill, sell smart, and let Theta kill the premium!
Do you sell options after big moves too? Share your views or setups in comments!
niftynifty on 2 support zone rising channel and fibbo 60%. nifty may be reverse from here upto 25400. may be on august 1 week. we see nifty 24550-24500 level.

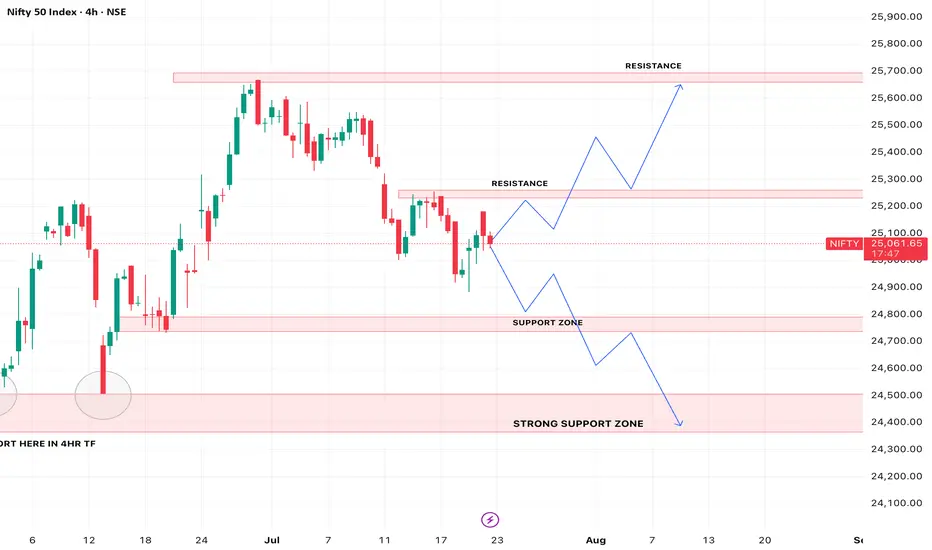
NIFTY - Trading levels and plan for 18-July-2025📊 NIFTY INTRADAY TRADING PLAN – 18-Jul-2025
Gap Opening Consideration: 100+ points from previous close
📍 KEY LEVELS TO MONITOR
🟥 Last Resistance: 25,340 – 25,365
🟥 Major Resistance: 25,430
🟧 Opening Resistance: 25,265
🟨 No Trade Zone: 25,055 – 25,127
🟩 Last Intraday Support Zone: 24,932 – 24,970
🟢 Major Support: 24,832
🚀 SCENARIO 1: GAP-UP OPENING (Above 25,365) 📈
(Gap-up considered as 100+ points above previous close)
If Nifty opens above 25,365 , it indicates bullish strength. Wait for a pullback near 25,340–25,365 for potential long entries.
If price sustains, expect a possible rally toward 25,430+ , which is the next resistance zone.
Avoid chasing entries; use 15–30 min candle confirmation to avoid false breakouts.
Options Strategy: Focus on ATM or slightly OTM Call Options or try a Bull Call Spread for limited risk.
⚖️ SCENARIO 2: FLAT OPENING (Between 25,055 – 25,127) 🟠
(Flat range aligns with the No Trade Zone )
This is a tricky zone with indecision between bulls and bears. Avoid initiating any trade immediately.
If Nifty breaks and sustains above 25,127 , bullish bias may emerge toward 25,265 – 25,340 .
On breakdown below 25,055 , a short trade setup opens targeting 24,932 – 24,970 zone .
Wait for clear hourly close before taking action in either direction.
Options Strategy: Consider Strangle or Iron Fly strategies for range-based volatility exploitation.
📉 SCENARIO 3: GAP-DOWN OPENING (Below 24,932) 🚨
(Gap-down considered below previous close by 100+ points)
If Nifty opens below 24,932 , monitor price action near the 24,832 major support .
If the support fails and prices break down below 24,832 , expect further downside pressure.
However, if price finds buying interest at 24,832 and bounces, you may consider scalping long with tight stop loss.
Options Strategy: Deploy ATM or ITM Put Options or Bear Put Spreads to play downside with defined risk.
💡 RISK MANAGEMENT & OPTIONS TRADING TIPS
🛑 Never risk more than 1–2% of your capital on any single trade.
⏳ Avoid entering trades during the first 15–30 minutes ; let volatility settle.
📉 Use Hourly candle close to determine validity of breakouts/breakdowns.
⚖️ Prefer spread strategies like Bull Call or Bear Put to cap your risk.
🧠 Avoid revenge trading after losses—stick to your trading plan.
📌 SUMMARY & CONCLUSION
Bullish View: Above 25,365, look for long opportunities up to 25,430 with stop-loss below 25,340.
Range-Bound View: Between 25,055–25,127 (No Trade Zone) – wait for breakout/breakdown confirmation.
Bearish View: Below 24,932 – focus on support at 24,832; breach can accelerate fall.
Action Plan: Wait for price behavior near key levels before committing capital.
⚠️ DISCLAIMER: I am not a SEBI-registered analyst. This analysis is for educational and informational purposes only. Please consult your financial advisor before taking any trade or investment decisions.
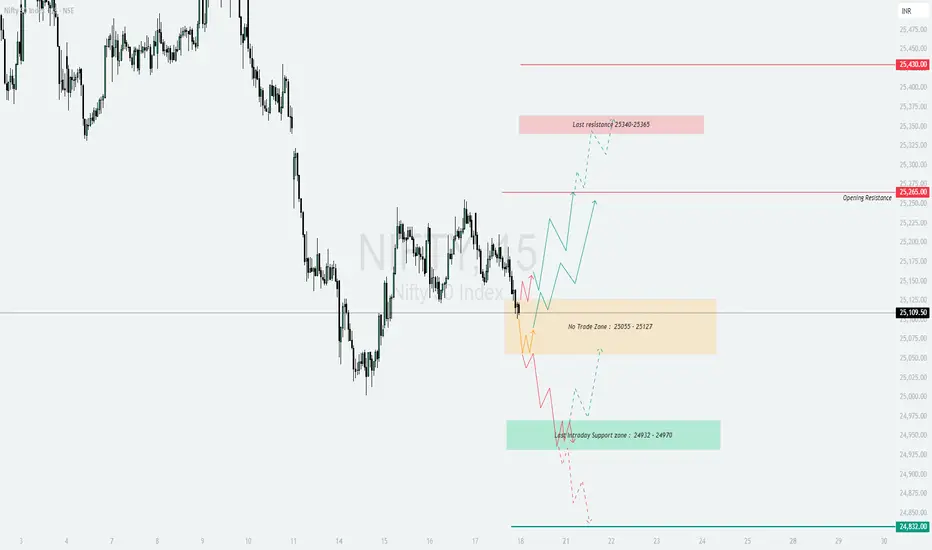
NIFTY : Trading plan and levels for 17-July-2025📊 NIFTY INTRADAY TRADING PLAN – 17-Jul-2025
200+ Points Gap Opening Considered Significant | Educational Structured Trading Plan
📍 KEY ZONES & LEVELS TO MONITOR
🟥 Opening Resistance Zone: 25,376 – 25,340
🔴 Last Intraday Resistance: 25,430
🟧 Opening Support Zone: 25,083 – 25,102
🟩 Last Intraday Support Zone: 24,932 – 24,970
🚀 SCENARIO 1: GAP-UP OPENING (Above 25,376) 📈
If NIFTY opens above 25,376 with 100+ points gap-up, expect buyers to dominate initially, pushing towards 25,430 (Last Intraday Resistance) .
Avoid aggressive longs exactly at the open. Let the first 15-minute candle settle to confirm strength.
If price sustains above 25,430 with volume, look for further upside, but be mindful of exhaustion near round numbers.
Options Tip: Prefer ATM Call Options with tight stop-loss or Bull Call Spread to manage risk better.
📊 SCENARIO 2: FLAT OPENING (Between 25,102 – 25,376) ⚖️
This range marks the consolidation area between Opening Support and Opening Resistance Zone .
Price behavior here is crucial for intraday direction bias.
If price holds above 25,224.40 post-open, bias is slightly bullish towards the Resistance Zone.
If price breaks below 25,102 , sellers may drag it towards Last Intraday Support 24,932 – 24,970 .
Options Tip: Consider Iron Fly or Strangle setups if premiums are attractive. Be patient for breakouts.
📉 SCENARIO 3: GAP-DOWN OPENING (Below 25,083) ⚠️
If NIFTY opens below 25,083 with 100+ points gap-down, expect weakness to persist.
Primary downside target becomes Last Intraday Support Zone: 24,932 – 24,970 .
Sell-on-rise strategy is preferred after 15-minute candle confirmation below 25,083 .
Options Tip: Focus on ATM or ITM Put Options or use Bear Put Spreads for safer execution.
💡 RISK MANAGEMENT TIPS FOR OPTIONS TRADERS
📏 Always risk only 1–2% of total capital per trade.
⏳ Avoid trades during the first 15–30 minutes to let volatility settle.
🔐 Respect Hourly Candle Close stops rather than reacting to wicks.
⚖️ Prefer Spreads and Hedged Strategies in highly volatile or uncertain conditions.
🚫 Avoid over-leveraging especially in expiry week or event-heavy days.
📌 SUMMARY & CONCLUSION
Bullish Bias: Gap-up above 25,376 → Target 25,430
Neutral Range: Between 25,102 – 25,376 → Wait for breakout confirmation
Bearish Bias: Gap-down below 25,083 → Target 24,932 – 24,970
Trade with a calm mindset, respecting the levels and waiting for candle confirmations to reduce false entries.
⚠️ DISCLAIMER: I am not a SEBI-registered analyst. This plan is purely for educational and informational purposes. Always consult your financial advisor before making any investment decisions.

NIFTY : Trading plan for 16-Jul-2025📊 NIFTY 50 INTRADAY TRADING PLAN – 16-Jul-2025
Strategy prepared with 15-Min chart observation. Gap openings 100+ points considered significant for intraday volatility.
📍 IMPORTANT LEVELS TO WATCH
🟥 Opening / Last Intraday Resistance: 25,340
🟧 Opening Resistance / Support Zone: 25,225
🟧 Opening Support: 25,132 – 25,150
🟩 Last Intraday Support: 25,053
🟩 Buyer’s Support Zone: 24,950 – 24,981
🟥 Profit Booking Zone: 25,408 – 25,430
🚀 SCENARIO 1: GAP-UP OPENING (Above 25,340) 📈
If NIFTY opens above 25,340 , it indicates a strong bullish sentiment. However, watch for immediate profit booking around the Profit Booking Zone 25,408 – 25,430 .
Do not rush into trades immediately. Wait for a 15-minute candle close above 25,340 to confirm continuation.
If it fails to hold 25,340, there can be a quick dip toward 25,225 again.
Options Tip: Prefer ATM or Slightly ITM CE for momentum continuation. Avoid far OTM options due to theta risk on gap-up days.
📊 SCENARIO 2: FLAT OPENING (Between 25,132 – 25,225) 🔄
A flat opening suggests an indecisive mood. Watch how prices behave around Opening Resistance 25,225 and Opening Support 25,132 – 25,150 .
If price sustains above 25,225 with good volume, expect a bullish move toward 25,340 .
If price breaks and sustains below 25,132 , expect weakness toward 25,053 or even 24,950 – 24,981 .
Options Tip: Use ATM Straddles/Strangles if market consolidates between 25,132 – 25,225 for premium decay setups.
📉 SCENARIO 3: GAP-DOWN OPENING (Below 25,053) ⚠️
A gap-down opening below 25,053 creates immediate bearish pressure. First downside support to monitor is 24,950 – 24,981 (Buyer’s Support Zone) .
If this zone holds, expect reversal buying with a stop-loss below 24,950 .
If 24,950 breaks, avoid fresh longs. Downtrend extension possible below this zone.
Options Tip: On gap-down days, prefer Bear Put Spreads or ATM Put Options for controlled risk instead of buying far OTM PEs.
💡 RISK MANAGEMENT TIPS FOR OPTIONS TRADERS
Risk only 1–2% of your capital per trade.
Avoid chasing prices in the first 15 minutes after the opening bell.
Prefer ATM/ITM options for directional trades.
Always mark Stop Loss and Stick to it strictly.
Control position sizing—don’t over-leverage on gap opening days.
📌 SUMMARY & CONCLUSION
Bullish Scenario: Above 25,340 → Target 25,408–25,430.
Range-Bound Scenario: Between 25,132 – 25,225 → Watch consolidation before acting.
Bearish Scenario: Below 25,053 → Target 24,950–24,981.
Always stay disciplined with entries and exits. Risk control should be your primary focus as an options trader.
⚠️ DISCLAIMER: I am not a SEBI-registered analyst. This trading plan is shared purely for educational purposes. Please do your own analysis or consult a certified financial advisor before acting on this information.

Nifty possible movement for the upcoming trading session.Nifty closed around the support zone forming a long lower tail showing some bullishness today.
Though the market has moved after a long time and can move on the either side.
Levels are marked and possible movements are also plotted.
Wait for the price action and trade accordingly.
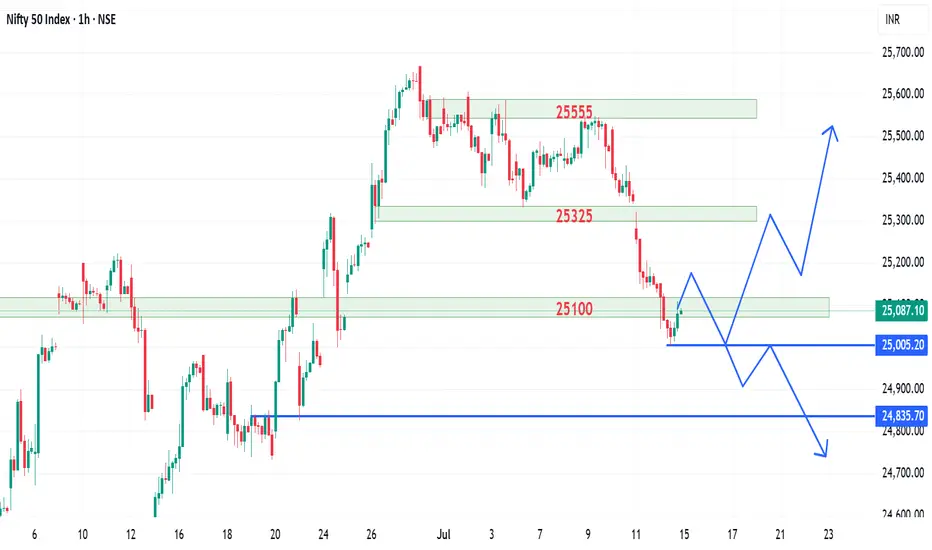
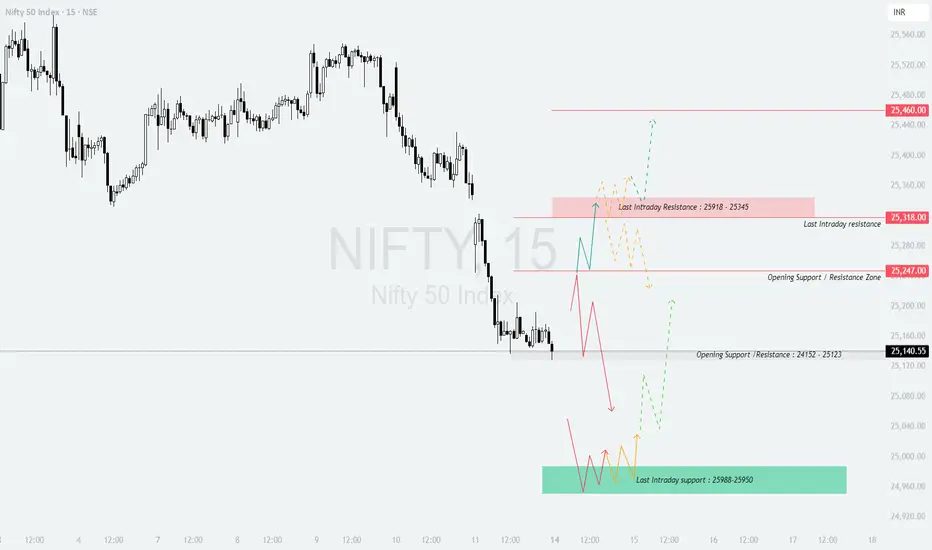
NIFTY : Trading levels and Plan for 14-Jul-2025b]📊 NIFTY 50 INTRADAY PLAN – 14 JULY 2025 (15-Min Chart Study)
Educational insights for all opening scenarios: Gap-Up, Flat, and Gap-Down.
📍 Previous Close: 25,140.55
📌 Gap opening threshold considered: 100+ points
⏱️ Tip: Let the first 15–30 minutes settle before entering trades based on levels.
📌 KEY LEVELS TO MONITOR
Resistance Zone: 25,460
Last Intraday Resistance: 25,318
Opening Support / Resistance Zone: 25,247
Opening Support / Resistance Zone: 25,152 – 25,123
Last Intraday Support Zone: 25,088 – 25,050
🚀 SCENARIO 1: GAP-UP OPENING (Above 25,247) 📈
Bias: Bullish continuation possible
If Nifty opens above 25,247 , watch for continuation towards 25,318 (Last Intraday Resistance) .
Sustainable strength above 25,318 can lead to 25,460 . That’s the upper profit booking zone.
If price shows exhaustion candles near 25,460, avoid fresh longs. Instead, look for selling opportunities with tight stop-loss.
Options Traders: Prefer ATM or slightly ITM calls; avoid chasing far OTM CE after gap-up. Time decay will be sharp in such cases.
📊 SCENARIO 2: FLAT OPENING (Near 25,140 – 25,152) 🔄
Bias: Neutral-to-bearish bias
If the market opens around 25,140 – 25,152 , focus on whether the 25,152 – 25,123 zone holds as support or flips as resistance.
If price holds above 25,152, there’s potential for a bounce towards 25,247.
If price breaks and sustains below 25,123, expect a gradual drift towards the Last Intraday Support: 25,088 – 25,050 .
Avoid quick trades here — observe the first 30 minutes’ range before committing capital.
📉 SCENARIO 3: GAP-DOWN OPENING (Below 25,050) ⚠️
Bias: Bearish with bounce attempt from lower supports
If Nifty opens below 25,050 , immediate attention should be given to Last Intraday Support: 25,088 – 25,050 .
If that zone breaks, next major support becomes psychological round numbers or extreme supports which may form intraday.
Aggressive selling should only be considered if prices show no reaction around this zone. Watch for hammer or reversal patterns before taking contra long trades.
Options Traders: Avoid buying deep OTM puts after a large gap-down as premiums often get inflated due to IV spikes.
💡 OPTIONS TRADING – RISK MANAGEMENT TIPS
Focus on ATM or ITM strikes to reduce theta impact on both CE and PE buying.
Apply Stop-Loss based on 15-minute candle closes instead of absolute price ticks to avoid noise.
If VIX is high, hedge with vertical spreads instead of naked options buying.
Strictly maintain a 1–2% max risk of your capital per trade.
Avoid over-trading after 2:45 PM as theta erosion accelerates in options.
Keep tracking Bank Nifty as well for broader market cues.
📌 SUMMARY & CONCLUSION
Bullish Trigger: Above 25,247 → Target 25,318 – 25,460
Neutral Zone: 25,140 – 25,152 → Wait and watch zone
Bearish Trigger: Below 25,123 → Watch 25,088 – 25,050 for bounce
Keep your discipline intact and avoid emotional trades.
Options premium decay is real — always respect time and structure.
⚠️ DISCLAIMER: I am not a SEBI-registered analyst. This trading plan is for educational purposes only. Please do your own analysis or consult with a financial advisor before making trading decisions.