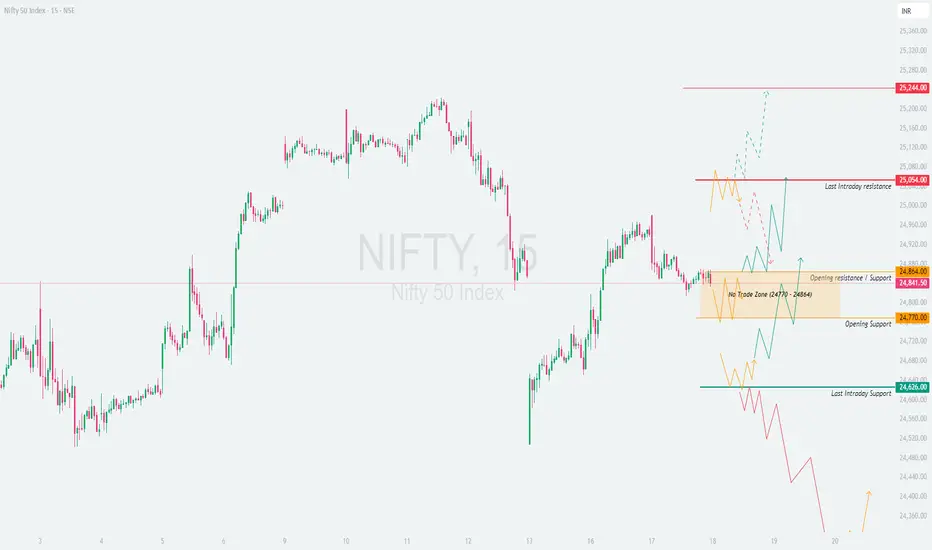
NIFTY : Trading levels for 18-Jun-2025📘 NIFTY TRADING PLAN – 18-Jun-2025
🕒 Chart Timeframe: 15-min | 📍 Previous Close: 24,841.50
📏 Gap Opening Threshold: 100+ points
🔼 GAP-UP OPENING (Above 24,964):
If NIFTY opens above the No Trade Zone (24,864) by more than 100 points, the price will likely test the upper resistance zone near 25,054 (Last Intraday Resistance) .
✅ Plan of Action:
• Avoid chasing right at open. Observe the first 15–30 mins for confirmation above 25,054.
• Sustainable move above 25,054: Look for long trades toward 25,244, with SL below 25,000.
• Rejection at 25,054 zone: Consider short trades only if there’s a clear reversal pattern, targeting back toward 24,864.
• Book profits partially near 25,150 if long, as market may consolidate.
📘 Educational Tip: Sharp gap-ups often face profit booking at resistance zones. Focus on confirmation via strong candles + volume to avoid false moves.
⚖️ FLAT OPENING (Between 24,770 – 24,864):
Flat open near the No Trade Zone (24,770 – 24,864) suggests indecision or potential sideways movement early in the session.
✅ Plan of Action:
• No Trade inside this band until clear breakout or breakdown is seen.
• Break above 24,864: Consider intraday longs toward 25,054, SL below 24,820.
• Break below 24,770: Enter shorts targeting 24,626, with SL above 24,800.
• Avoid trading between 24,770–24,864 during consolidation — it’s where stop losses typically get hit from both sides.
📘 Educational Tip: Trading in the No Trade Zone is like catching a coin toss — instead, let market pick a direction, then follow it with clarity .
🔽 GAP-DOWN OPENING (Below 24,670):
A gap-down below 24,770, especially near or under the Last Intraday Support – 24,626 , brings into play the Buyer’s Support Zone (24,253 – 24,320) .
✅ Plan of Action:
• If opening is near 24,626 and shows breakdown below, ride shorts till 24,420 – 24,320.
• Look for potential reversal setups inside 24,253–24,320 zone for long trades.
• Reclaiming 24,626 with bullish candles could invite short-covering.
• Avoid new shorts inside Buyer’s Zone unless breakdown below 24,253 happens with volume and structure.
📘 Educational Tip: Gaps near support zones give best long risk/reward, but never buy blindly — wait for confirmation candle + sustained buying interest .
🛡 OPTIONS TRADING RISK MANAGEMENT TIPS:
✅ 1. Wait 15–30 mins post-open to avoid false breakouts or reversal traps.
✅ 2. Avoid over-leveraging on gap days — increase accuracy, reduce lot size.
✅ 3. Prefer spreads (Bull Call/Bear Put) if volatility is high to control premium erosion.
✅ 4. Use SL on candle close basis (preferably 15-min), not just trigger wicks.
✅ 5. Exit intraday trades 10–15 mins before close if targets aren't hit to avoid time decay spikes.
📊 SUMMARY – KEY LEVELS TO WATCH:
• 🟢 Bullish Setup:
– Above 24,864 → Target: 25,054 → 25,244
– SL: Below 24,820 (on longs)
• 🔴 Bearish Setup:
– Below 24,770 → Target: 24,626 → 24,320
– Breakdown SL: Above 24,800
• 🟧 No Trade Zone: 24,770 – 24,864 — Let direction confirm
• 🟩 Support Zones: 24,626 / 24,320 / 24,253
• 🟥 Resistance Zones: 25,054 / 25,244
📌 Decision Point: Breakout above 24,864 or below 24,770 decides momentum.
⏱ Watch the first 15-min candle structure for decisive moves.
📢 DISCLAIMER: I am not a SEBI-registered analyst. This trading plan is purely for educational and learning purposes. Please consult your financial advisor before taking any trading or investment decision.
Niftyoptions
Nifty chart for 17th june 2025Looks like Nifty is in a range. Also, it took support on 24500 level.
Disclaimer: All information provided here is for educational purposes and not a recommendation, advice, research report, or stock tip of any nature. Analysis Posted here is just our view/personal study method on the stocks, commodities or other instruments and assets.
How to Use India VIX to Size Your Positions!Hello Traders!
Position sizing is one of the most ignored aspects of trading, yet it’s what separates consistent traders from gamblers. Today, let’s talk about a powerful tool many overlook: India VIX . When used correctly, VIX helps you adjust your position size based on market volatility , keeping your risk in check and improving your win rate.
What is India VIX?
India VIX = Volatility Index: It measures the expected volatility in Nifty for the next 30 days based on options pricing.
Higher VIX = Higher Fear: A rising VIX indicates uncertainty, panic, and more wild moves.
Lower VIX = Calm Markets: A falling VIX reflects confidence, low volatility, and tight price action.
Why Position Sizing Should Depend on VIX
High VIX Days (Above 16–18): Markets are more volatile. Reduce your position size to control your stop-loss risk.
Low VIX Days (Below 12–13): Markets are calmer. You can size up slightly because expected range is tighter.
Helps Avoid Overleveraging: Using the same lot size in all volatility zones is a recipe for disaster.
Rahul’s Easy VIX-Based Sizing Rule
VIX < 13 → Normal Size
→ You can use your standard lot size, as market is stable.
VIX 13–17 → 75% Size
→ Slightly reduce position to handle range expansion.
VIX > 17 → 50% or Less
→ Market is aggressive, reduce size and tighten risk control.
Real Impact on Traders
Avoid Big Drawdowns: A good trade in high VIX can still hurt due to huge slippage or wide stop-losses.
Smoother Equity Curve: Smaller positions in wild markets help protect capital, while bigger trades on calmer days optimize returns.
Confidence to Hold Longer: You can hold with peace of mind when sizing matches market mood.
Conclusion
India VIX is not just an index — it’s a risk barometer. Use it to fine-tune your trade size, especially if you're trading options, intraday setups, or expiry-based strategies. Don’t just focus on entries — manage your size smartly and stay in the game longer!
How do you adjust your size during high volatility? Let’s discuss in the comments!

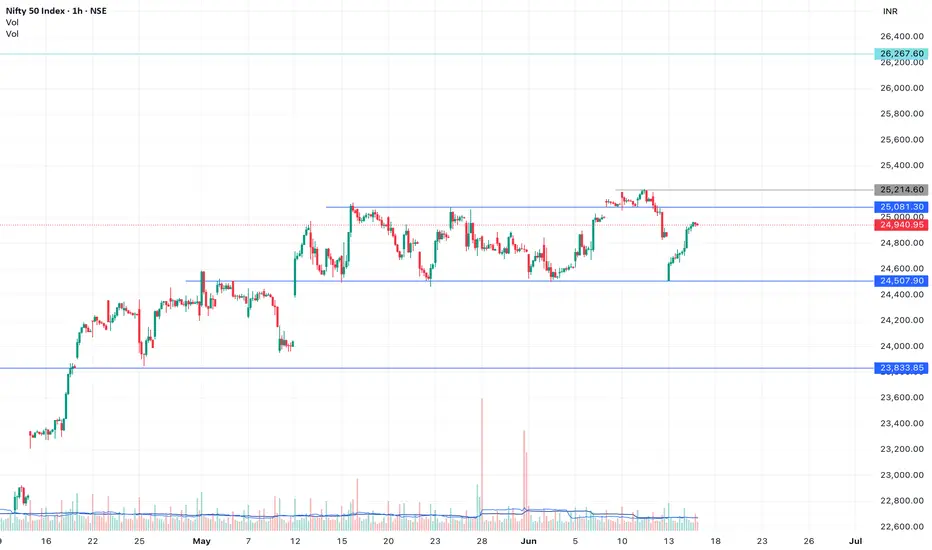
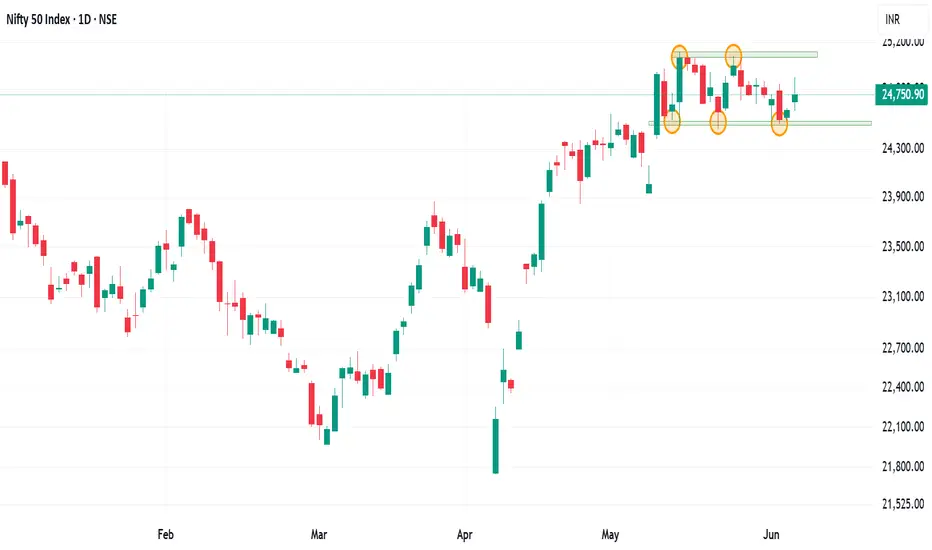
Outlook on nifty 50 for the next week. Is it going trending?Nifty 50 on the daily chart is trading in a range and has respected the zone quite effectively.
Index has remained sideways since a 3.82% move on 12th may. Market trade in cycle and after a sideways cycle, a trending market is predicted.
Either side movement can be seen in the index as 18 bars or 24 days it has remained in the range.
Major Resistance :- 25125, 25500
Major support :- 24500, 23930
This 600 range and change into same range of trending market.
Even the moving averages are coinciding and forming a MA gate which can give good momentum trading setup
Wait for the price action near the price levels before forming a trading basis. Trade only the setup and wait for the retest on either side.
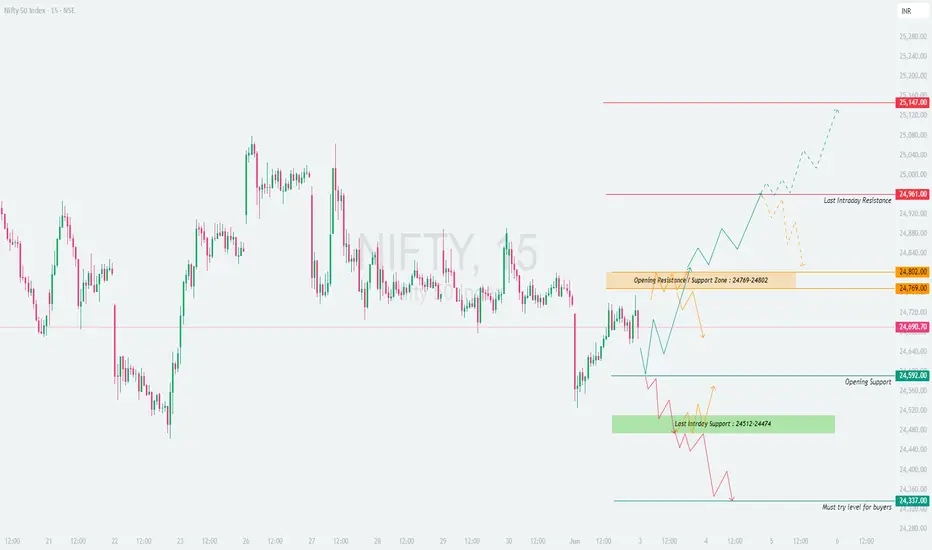
NIFTY : Trading levels and plan for 03-Jun-2025📘 NIFTY 50 – TRADING PLAN for 03-Jun-2025
🕒 Timeframe: 15-minute Chart Structure
📍 Gap Opening Threshold: 100+ points from the previous close of 24,690.70
🔼 GAP-UP OPENING (Above 24,802):
A gap-up above the Opening Resistance / Support Zone (24,769 – 24,802) signals early bullish sentiment. However, Nifty will face immediate resistance at 24,961, which is the Last Intraday Resistance . If that is crossed, the path opens toward 25,147, the next major resistance level.
✅ Plan of Action:
• Let the first 15–30 minutes unfold. If price sustains above 24,802, and forms a bullish 15-min structure (e.g., a higher high candle or retest + bounce), then consider going long above 24,820–24,840 zone.
• Targets:
→ First: 24,961
→ Extended: 25,147
• Stop-loss: Below the retest candle or under 24,769, depending on entry zone.
• Avoid chasing trades directly near 24,961. Let the level either break cleanly or give a pullback opportunity.
🧠 Educational Insight: Gap-ups tend to get tested. Don’t trade breakout levels blindly — instead, wait for a strong base formation or retest bounce before entering.
⚖️ FLAT OPENING (Between 24,690 – 24,769):
This zone lies within the broader consolidation area and right below the Opening Resistance Zone. It’s a sensitive area where the market may attempt either a base-building process or fake breakouts.
✅ Plan of Action:
• Avoid trading immediately at open. Let price test either side of the 24,769 – 24,802 resistance band.
• Long Setup: A clear 15-min candle close above 24,802 with volume support allows a long trade targeting 24,961 and possibly 25,147, with SL below 24,769.
• Short Setup: If price rejects 24,769 – 24,802 with a strong bearish pattern (e.g., evening star or shooting star), consider a short toward 24,592, with SL above 24,802.
• Treat this area as “No Trade Zone” unless a clear breakout or breakdown occurs.
🧠 Educational Insight: Most false breakouts happen in sideways zones like this. Let structure unfold with confirmation before you commit to a direction.
🔽 GAP-DOWN OPENING (Below 24,592):
A gap-down below 24,592 indicates early weakness, and price may head towards the Last Intraday Support Zone (24,512 – 24,474) . The final buyer defense level rests at 24,337, tagged as the Must Try Level for Buyers .
✅ Plan of Action:
• Allow 15–30 minutes to observe market reaction.
• If price holds above 24,512 – 24,474 zone and gives bullish reversal candles (hammer, bullish engulfing), it could offer a long trade toward 24,592 / 24,690.
• Aggressive Shorts: If price breaks and sustains below 24,474, look for quick scalps toward 24,337, with tight SL above 24,474.
• Reversal Longs: At 24,337, only buy if a clear bullish pattern confirms reversal; otherwise, avoid catching a falling knife.
🧠 Educational Insight: Don’t assume every support will bounce. Wait for bullish confirmation or trend shift signals. Panic selling is common on gap-downs, but reward comes only with patience.
🛡 RISK MANAGEMENT TIPS FOR OPTIONS TRADERS:
✅ 1. Avoid trading the first 5–15 minutes post-gap opening — especially with naked options. Let price stabilize.
✅ 2. Use spreads (Bull Call / Bear Put) to reduce risk and theta decay in directional bias.
✅ 3. Don’t overleverage just because premiums look cheap — IV crush can wipe you out fast.
✅ 4. Keep a time-based stop-loss for option buys — if price doesn’t move in your direction within 15–20 mins after entry, reassess.
✅ 5. Always follow the chart, not your emotions . Don’t hold losing trades hoping for a reversal.
📊 SUMMARY & CONCLUSION:
• 🟢 Bullish Above: 24,802, Targets: 24,961 / 25,147
• 🔴 Bearish Below: 24,592, Targets: 24,474 / 24,337
• 🟧 No Trade Zone: 24,690 – 24,769 → Wait for breakout/rejection structure
• 🟩 Support Zones: 24,592 / 24,474 / 24,337
• 🟥 Resistance Zones: 24,802 / 24,961 / 25,147
• ⏱ Time-based Rules: Let 15–30 mins develop to avoid false breakouts and overtrading
✨ Final Thought: Respect the plan. Let the chart tell you what to do — not your bias. The best trades are usually the most boring, disciplined ones.
📢 DISCLAIMER: I am not a SEBI-registered analyst. This trading plan is for educational and informational purposes only. Please consult a SEBI-registered financial advisor before taking any investment or trading decision.
Iron Condor vs Batman – Who Wins the Real Option Writing Battle?Hello Traders!
In today’s post, we break down two powerful non-directional option strategies — Iron Condor and Batman . Both are used by experienced option writers to profit from range-bound markets. But which one gives you better control, flexibility, and real edge in volatile environments? Let’s decode it.
What is an Iron Condor?
A combination of Bear Call Spread + Bull Put Spread , placed at a safe distance from the spot price.
Risk-defined and premium-rich strategy used when you expect the market to stay in a tight range.
Profit zone lies between the short strikes , but max loss occurs if price breaches beyond sold wings.
Most effective in low IV, stable trend, or sideways market zones .
Example Payoff Chart (Iron Condor):
👉 Refer to the image below for a live payoff example created using Nifty options.
Note: This chart is just to help you understand the structure practically. Please don’t treat it as a live buy/sell recommendation.
What is the Batman Strategy?
A twist on Iron Condor — instead of flat short wings, it adds OTM Long Options (Calls and Puts) far from current price.
Looks like a Batman mask on the payoff chart — hence the name.
More flexible and safer in volatile markets because the long options act as additional hedges.
Great for event trading (Fed days, RBI, earnings) where sudden spikes can hurt naked spreads.
Example Payoff Chart (Batman Strategy):
👉 Check the second image for a Batman-style payoff — you’ll see the clear double hump!
Note: Again, this example is for educational clarity only — not a trading signal.
Iron Condor vs Batman – Which is Better?
Iron Condor = Higher ROI but Higher Risk: Great if you’re confident in the range and want more premium.
Batman = Lower ROI but Safer Profile: Ideal when expecting possible spikes or IV expansion.
Iron Condor needs adjustments faster when breached. Batman gives more breathing room due to long legs.
Risk-Reward Balance: Batman sacrifices some profit for better tail-risk protection.
When to Choose Which?
Choose Iron Condor: When IV is low, market is calm, and no major events ahead.
Choose Batman: When IV is rising, events are near, or you’re uncertain about direction but expect movement.
Use Iron Condor in weekly expiry zones ; Batman shines in monthly or event weeks .
Rahul’s Tip
If you’re trading around news, policy days, or high gamma zones — Batman gives protection without killing premium . For silent expiry weeks, stick to a wide Iron Condor with delta-neutral bias . Adjust smartly if breached.
Conclusion
Iron Condor is like a high-speed train — fast but risky.
Batman is like a glider — slower, but safer in stormy skies.
Choose your ride based on the weather — market volatility.
If you found this post valuable, don't forget to LIKE and FOLLOW!
I regularly share real-world trading setups, actionable strategies, and learning-focused content — all from real trading experience, not theory. Stay connected if you're serious about growing as a trader!

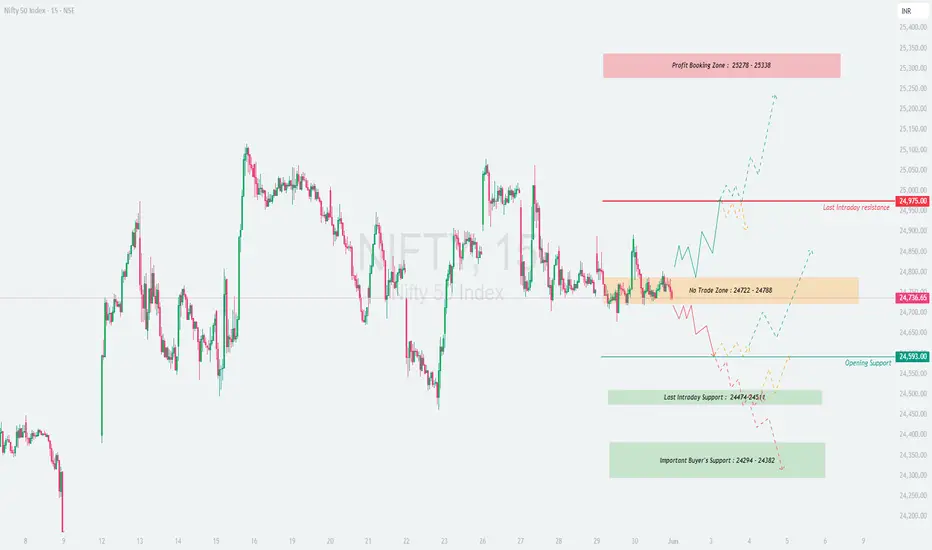
NIFTY : Trading Levels and Plan for 02-JUN-2025📘 NIFTY 50 – TRADING PLAN for 02-Jun-2025
🕒 Timeframe: 15-minute Chart Structure
📍 Gap Opening Threshold: 100+ points from previous close of 24,736.65
🔼 GAP-UP OPENING (Above 24,875):
If Nifty opens with a gap-up above the upper end of the No Trade Zone (24,722 – 24,788) , it indicates early strength and a potential breakout. However, it will face immediate resistance near the psychological mark of 24,975, which is the Last Intraday Resistance .
✅ Plan of Action:
• If the first 15–30 minutes show strength above 24,875 with bullish candles and follow-through volume, look to enter long above 24,900–24,975.
• Targets:
→ First: 24,975
→ Extended: 25,278 – 25,338 (Profit Booking Zone)
• Stop-loss: Below 15-min support candle or under 24,788 for confirmation-based trades.
• Avoid entering long trades directly near 24,975 unless a pullback-retest happens and sustains above.
🧠 Educational Tip: Don’t chase gap-ups blindly. Wait for confirmation like bullish engulfing or retest near breakout zone before taking the trade.
⚖️ FLAT OPENING (Between 24,722 – 24,788):
This is the No Trade Zone , meaning price is in indecision and trapped between key levels. Market may consolidate or build a base before directional movement.
✅ Plan of Action:
• Avoid trading the first 15–30 minutes. Let the price break out of this zone decisively.
• Break Above 24,788: Go long with SL below 24,722, targets: 24,975 / 25,278
• Break Below 24,722: Go short with SL above 24,788, targets: 24,593 / 24,474
• Watch for fakeouts – ensure breakout is supported by strong candle close and not just a wick.
🧠 Educational Tip: No Trade Zones are created for a reason – they usually trap impatient traders. Let the market choose direction and join the trend.
🔽 GAP-DOWN OPENING (Below 24,593):
A gap-down below Opening Support (24,593) suggests early weakness. Nifty may try to test deeper support levels near 24,474 – 24,451 (Last Intraday Support) and further toward 24,294 – 24,382 (Important Buyer’s Support).
✅ Plan of Action:
• Watch the 24,474 – 24,451 zone for signs of reversal. If a bullish reversal candle forms, a long entry can be attempted targeting:
→ 24,593
→ Extended: 24,722
• If 24,451 breaks decisively, expect momentum to carry prices toward 24,294 – 24,382.
• Short Trades: Can be taken only if price rejects bounce zones with bearish structure (e.g., bearish engulfing or retest failure).
🧠 Educational Tip: Don’t buy into weakness without confirmation. Bearish momentum tends to accelerate if support zones break early in the day.
🛡 RISK MANAGEMENT TIPS FOR OPTIONS TRADERS:
✅ 1. Avoid buying far OTM options after a gap opening – stick to ATM or near ATM strikes for better delta.
✅ 2. Use spreads (Bull Call/Bear Put) when expecting directional move with defined risk.
✅ 3. Never trade without a stop-loss ; even best setups fail in volatile markets.
✅ 4. Wait for the 15–30 minute structure to develop before taking directional trades.
✅ 5. Don’t average losers – instead, analyze the trade thesis and exit quickly if invalidated.
📊 SUMMARY & CONCLUSION:
• 🟢 Bullish Above: 24,788, Targets: 24,975 / 25,278 – 25,338
• 🔴 Bearish Below: 24,722, Targets: 24,593 / 24,451 / 24,294
• 🟧 No Trade Zone: 24,722 – 24,788 → Avoid initial trades, wait for breakout
• 🟩 Support Levels: 24,593 / 24,474 / 24,294
• 🟥 Resistance Levels: 24,975 / 25,278 / 25,338
• 📌 Key Rule: Let the structure confirm the bias – don't trade on emotions or pre-conceived notions.
✨ Final Note: Trade with discipline. Best trades don’t come every day — but risk-managed ones preserve your capital always.
📢 DISCLAIMER: I am not a SEBI-registered analyst. The trading plan shared above is strictly for educational purposes. Please consult with a SEBI-registered financial advisor before making any trading or investment decisions.
Nifty trading idea for short term💡 📊
Nifty 50
Resistance: 25080
Support: 24700 at 20 DMA
Bank Nifty resistance: 55900
#Nifty #BankNifty #Intraday #trading #breakoutstocks

NIFTY : Trading levels and Plan for 29-May-2025📘 NIFTY 50 – TRADING PLAN for 29-May-2025
📈 Based on 15-min structure and key zones
📍 Gap Opening Threshold: 100+ points from previous close of 24,757
🔼 GAP-UP OPENING (Above 24,857):
If Nifty opens above 24,857+, it will open above the current Opening Resistance Zone: 24,748 – 24,786 , creating early bullish momentum.
✅ Plan of Action:
• Let the price settle in the first 15–30 mins. Avoid chasing green candles in the first 5 mins.
• If Nifty sustains above 24,891 (Opening Resistance), bullish momentum is confirmed. You may initiate long trades (Call options or Futures) with targets at 24,997 (Last Intraday Resistance) and trail SL at 24,891 .
• Once price reaches 24,997, partial profit booking is advised, as it’s a strong resistance zone.
• In case of a sharp pullback toward the 24,748–24,786 zone, observe for bullish reversal patterns (hammer, engulfing) before considering re-entry.
• A failure to sustain above 24,891 followed by bearish price action may lead to a trap. Wait for confirmation before going short.
🧠 Educational Tip: A gap-up followed by sideways movement or rejection at resistance often leads to profit-booking. Be cautious if momentum fades quickly.
⚖️ FLAT OPENING (Between 24,748 – 24,786):
This is a tricky Opening Support-Resistance Zone , often referred to as the "No Trading Zone" due to choppy price action.
✅ Plan of Action:
• Stay out initially – wait for either a breakout above 24,786 or a breakdown below 24,748 to take a directional trade.
• A 15-min candle close above 24,786 with volume confirmation can lead to upward momentum targeting 24,891 → 24,997 .
• If Nifty breaks and sustains below 24,748 , consider short trades toward 24,702 → 24,667 .
• Avoid overtrading in this zone; wait for clean structure and direction. Sideways zones are premium killers in options.
🧠 Educational Tip: Price often consolidates near open when inside a resistance-support overlap. Don't anticipate the move — participate only when confirmation arrives.
🔽 GAP-DOWN OPENING (Below 24,657):
If Nifty opens more than 100 points lower (below 24,657), it opens near the Opening Support Zone: 24,667 – 24,702 or possibly close to Last Intraday Support: 24,592 .
✅ Plan of Action:
• Observe early reactions around 24,592 . If this level holds and bullish reversal patterns emerge, you can go long for an intraday bounce toward 24,702+ with a tight SL below 24,592.
• If Nifty breaks 24,592 and sustains below on 15-min candle close, you may initiate Put trades or shorts, targeting 24,391 → 24,326 (Important Buyer’s Support).
• Be cautious near 24,391–24,326 zone — sharp reversals often occur there as it’s a critical demand zone.
• Avoid emotional shorting just because of gap-down; confirm weakness through patterns like breakdown and retest.
🧠 Educational Tip: Many retail traders short gap-downs only to be trapped in V-shape recoveries. Patience and pattern confirmation matter more than the gap itself.
🛡 RISK MANAGEMENT TIPS FOR OPTIONS TRADERS:
📌 Always follow 15-min candle close SLs for directional confirmation.
📌 Use spread strategies like Bull Call/Bear Put spreads on high IV days to limit risk.
📌 Avoid trades inside overlapping zones like 24,748 – 24,786 unless a breakout/breakdown occurs.
📌 Stick to maximum 1–2 trades a day. Avoid overtrading due to boredom or FOMO.
📌 Define your Risk:Reward ≥ 1:2 before entering any trade.
📌 Don’t average losing positions. Respect your stop-loss.
📌 Protect profits using trailing SL once targets start hitting.
📊 SUMMARY & CONCLUSION:
• 🟢 Bullish Above: 24,891 → Targets: 24,997
• 🔴 Bearish Below: 24,592 → Targets: 24,391 / 24,326
• 🟧 Opening Support-Resistance Zone: 24,748 – 24,786
• 🟩 Support Zone: 24,667 – 24,702
• 🟥 Last Intraday Support: 24,592
• 💚 Strong Buyer's Zone: 24,391 – 24,326
✨ Key Rule: Follow the flow — don’t predict it. Let price tell you what it wants to do and then ride the wave.
📢 DISCLAIMER: I am not a SEBI-registered analyst. This plan is shared purely for educational purposes. Please consult a certified financial advisor before making any trading or investment decisions. Trade at your own risk. 💼📉📈

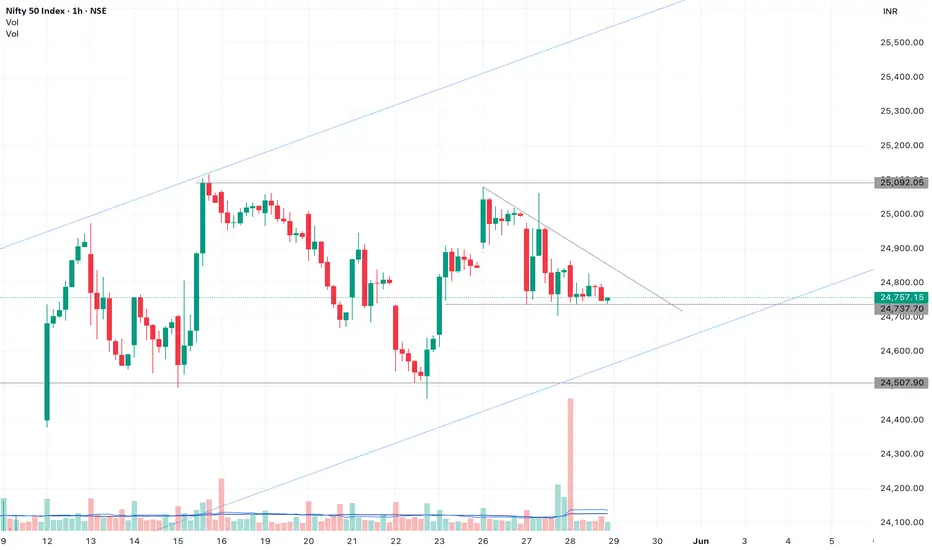
Nifty chart for 29th May 2025Looks like Nifty is forming a triangle pattern.
Disclaimer: All information provided here is for educational purposes and not a recommendation, advice, research report, or stock tip of any nature. Analysis Posted here is just our view/personal study method on the stocks, commodities or other instruments and assets.
NIFTY : Trading levels and Plan for 28-May-2025📘 NIFTY TRADING PLAN – 28 MAY 2025
🕰 Based on 15-min price structure & support/resistance zones
📍 Gap opening considered when price opens 100+ points above or below the previous close (24,837)
🔼 GAP-UP Opening (Above 24,937 – 100+ points):
If Nifty opens above 24,937+ , it enters the zone between Last Intraday Resistance (25,000) and moves toward the Profit Booking Zone (25,285 – 25,347) .
✅ Plan of Action:
• Avoid aggressive entries in the first 15–30 minutes. Let price action settle and confirm sustainability.
• A 15-min candle close above 25,165 with strong volume may signal a breakout toward the Profit Booking Zone at 25,285–25,347 .
• Pullbacks near 25,000–25,165 acting as a new support can offer good CE entries for continuation.
• However, if Nifty shows reversal signs (bearish engulfing or shooting star) near the Profit Booking Zone, traders may consider light PE positions for a possible retracement.
🧠 Educational Insight: Gap-ups into major resistance should never be chased blindly. Let the market confirm whether bulls have the strength to sustain or not.
⚖️ FLAT Opening (Between 24,701 – 24,937):
This zone is where Nifty opens near the Opening Resistance (24,837–24,861) or Opening Support Zone (24,666–24,701) .
✅ Plan of Action:
• Mark this range as the NO TRADE ZONE initially. Wait for a breakout above 24,937 or breakdown below 24,666 before taking directional trades.
• If Nifty sustains above 24,861 with strong green candles, you may initiate CE positions with targets of 25,000 – 25,165 .
• A breakdown below 24,666 with rejection at retest opens PE opportunities toward 24,594 and lower.
• If the market stays sideways between 24,701–24,861 , stay on the sidelines. Avoid theta decay traps in options.
🧠 Educational Insight: In sideways zones, wait for price confirmation instead of anticipation. Let price break levels and retest for high-probability trades.
🔽 GAP-DOWN Opening (Below 24,737 – 100+ points):
In this case, Nifty opens below Opening Support Zone (24,666–24,701) or even the Last Intraday Support (24,594) .
✅ Plan of Action:
• If price finds support near 24,594 and shows bullish reversal signs (hammer, bullish engulfing), a bounce toward 24,701+ is possible.
• Breakdown and a 15-min close below 24,594 will likely take Nifty toward the Buyer’s Important Support Zone (24,326 – 24,391) .
• Use PE options if 24,594 breaks decisively and price fails to reclaim it on a retest.
• For aggressive traders, any retest of 24,666–24,701 acting as resistance can provide a PE entry with tight SL.
🧠 Educational Insight: Gap-downs into support zones often trap sellers if support holds. Watch for exhaustion or follow-through before deciding direction.
🛡 RISK MANAGEMENT TIPS FOR OPTIONS TRADERS:
📌 Use 15-min candle close SL to avoid emotional exits.
📌 Avoid overtrading. Stick to 1–2 high-quality trades only.
📌 Avoid buying options right after the open – let premiums stabilize.
📌 Always calculate Risk:Reward Ratio before placing a trade.
📌 Don’t trade inside the noise zone (24,701–24,861); wait for levels to be breached.
📌 Use spreads (Bull Call / Bear Put) if volatility is high.
📊 SUMMARY & CONCLUSION:
• 🔼 Bullish Breakout Zone: Above 25,165 → Target: 25,285 / 25,347
• 🔽 Bearish Breakdown Zone: Below 24,594 → Target: 24,391 / 24,326
• 🟧 No Trade Zone: 24,701 – 24,861
• 🟩 Opening Support Zone: 24,666 – 24,701
• 🟥 Profit Booking Resistance Zone: 25,285 – 25,347
📌 Wait for price structure to confirm direction. Use patience and discipline – not emotions. Great setups reward prepared traders.
📢 DISCLAIMER: I am not a SEBI-registered analyst. This trading plan is purely for educational purposes. Please consult your financial advisor before taking any investment decisions. Trade wisely and protect your capital. 💼📈📉

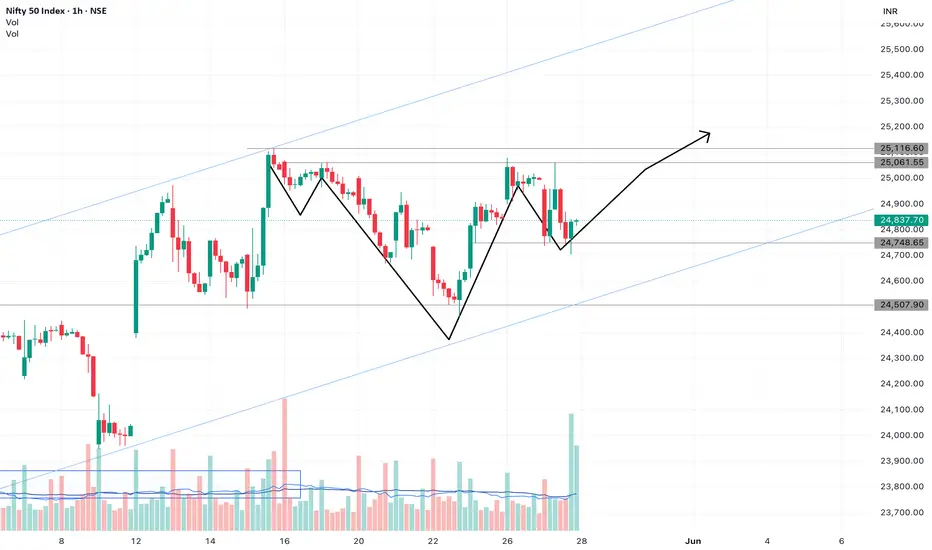
Nifty analysis for 28th May 2025Looks like Nifty is forming an inverse head and shoulders pattern.
Disclaimer: All information provided here is for educational purposes and not a recommendation, advice, research report, or stock tip of any nature. Analysis Posted here is just our view/personal study method on the stocks, commodities or other instruments and assets.
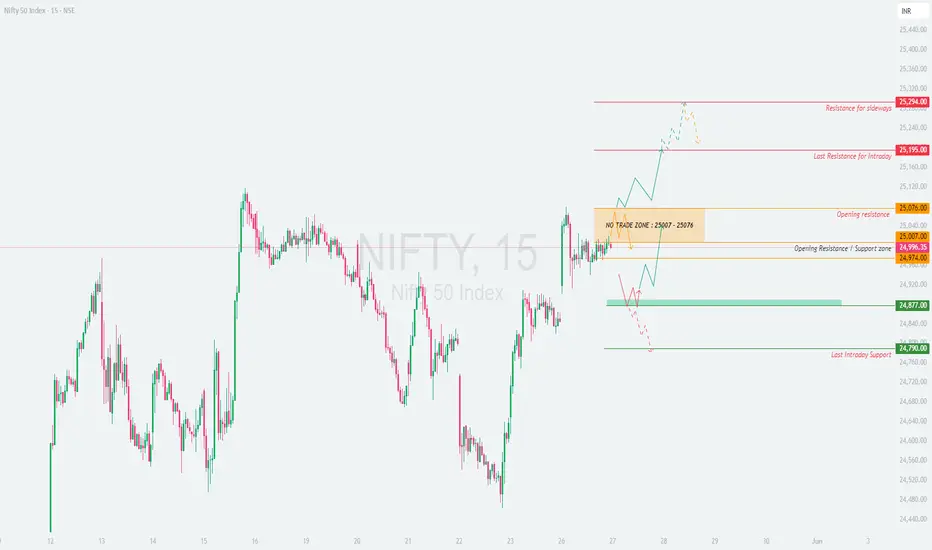
NIFTY : Trading levels and Plan for 27-May-2025📈 Nifty 50 Trading Plan – 27 May 2025
🔍 Chart Structure Analysis with Strategic Plan of Action
GAP-UP Opening (Above 25,076 – 100+ points):
If Nifty opens with a strong gap-up above 25,076 , we are stepping into the Opening Resistance zone , heading towards the Last Intraday Resistance at 25,195 and even towards 25,294 – Resistance for sideways price action .
✅ Plan of Action:
• Avoid early entries in the first 15-30 mins to let volatility settle.
• If price sustains above 25,195 on a 15-min candle close, potential momentum may push it to 25,294+ .
• Option buyers may consider buying CEs with tight SL below 25,076 on a retest for a favorable risk-reward.
• If price shows rejection from 25,195–25,294, watch for reversal patterns to scalp PEs with SL above 25,294 .
🧠 Education Tip: Gaps often trap retailers. Confirmation is key! Avoid aggressive trades at resistance without a proper base.
FLAT Opening (Between 25,007 – 25,076):
A flat start means price is within the NO TRADE ZONE (25,007–25,076). This zone offers low conviction as both bulls and bears wait for direction.
✅ Plan of Action:
• Wait and watch. Don’t force trades here.
• Trade only on clean breakout above 25,076 or breakdown below 25,007 with good volume .
• Avoid options buying here, theta decay will kill premiums.
• Look for directional breakouts post 10:00 AM for clarity.
🧠 Education Tip: No Trade Zone exists to protect your capital. Preserve energy for high-probability setups.
GAP-DOWN Opening (Below 24,877 – 100+ points):
A strong gap-down below 24,877 would take price into a decisive Buyer's Support Zone (24,877 – 24,791) or even to last intraday support at 24,790 .
✅ Plan of Action:
• If price holds above 24,790 – 24,877 zone , intraday pullback likely. Watch for reversal signals to scalp CEs with tight SL below 24,790 .
• Breakdown below 24,790 with volume may trigger further downside. Can aim for lower supports.
• Avoid chasing puts after a gap down—wait for a retest or consolidation before entry.
🧠 Education Tip: Buyer zones often act as magnets for smart money entries. Respect structure before shorting blindly.
💡 Options Trading Risk Management Tips:
• Use stop losses on candle-close basis and avoid mental SLs.
• Never buy options when premiums are inflated post-gap moves without confirmation.
• Use spreads (e.g., Bull Call or Bear Put spreads) on volatile days to reduce premium decay.
• Avoid over-leveraging—stick to 1–2 trades with proper planning.
• Hedge if you’re carrying positions overnight.
📊 Summary & Conclusion:
• 🔸 No Trade Zone: 25,007 – 25,076 (Avoid initiating fresh trades here).
• 🔼 Bullish breakout levels: Above 25,076 → Target 25,195 / 25,294
• 🔽 Bearish breakdown levels: Below 24,790 → Possible downside pressure.
• 💚 Buyer's Zone Support: 24,877 – 24,791
🔔 Remember: The market does not reward speed but precision and patience. Focus on execution based on structure and not emotions.
📌 Disclaimer: I am not a SEBI-registered analyst. The information provided is for educational purposes only. Please do your own analysis or consult your financial advisor before taking any trade. Trade safe and smart! 💼📉📈
Nifty analysis for 26th May 2025Looks like Nifty has formed an inverse head and shoulders pattern and it already broke the pattern moving upside.
Disclaimer: All information provided here is for educational purposes and not a recommendation, advice, research report, or stock tip of any nature. Analysis Posted here is just our view/personal study method on the stocks, commodities or other instruments and assets.

Nifty Intraday Levels for 26-May-25
Nifty closed above resistance level with support of Trendline
Bearish < 24760
Bullish > 24880
Wait for Proper Rejection/Pattern :
@Support : Bullish
@Resistance : Bearish
*All views for educational purpose only
Gamma Zone Reversal Strategy – Real Data Based Intraday Setup!Hello Traders!
In today’s post, we’ll explore the Gamma Zone Reversal Strategy — a high-accuracy intraday setup that uses option data to identify powerful reversal zones. This strategy is especially effective on expiry days and is based on real-time behavior of market makers.
What is a Gamma Zone?
A Gamma Zone is a strike where option sellers have heavy Open Interest (OI) and high Gamma exposure.
These zones are often defended strongly by market makers to avoid delta risk, causing sharp intraday reversals.
Ideal Gamma Zones are identified by high Gamma + high OI + high volume near current spot price.
Real Market Example: Nifty 24900 PE (29 MAY 2025 Expiry)
Let’s take a real-time example from Option chain data and assume tomorrow is expiry day:
Gamma: 0.08 (High)
OI Change: +37624
Volume: 1156817
LTP: 194.05
Spot Price: 24845
This means that 24900 PE is a strong Gamma zone, where put writers have built huge positions. Market makers are likely to defend this zone to avoid rapid changes in Delta exposure — leading to a high chance of price bouncing from here. I am posting this educational idea today because there will be another 3 days to analyse this before 29th May expiry.
How to Trade Gamma Zone Reversal Strategy
Identify High Gamma Strikes: Look for strikes with high Gamma, strong OI addition, and heavy volume near spot.
Observe Price Reaction: Watch if price approaches these zones and forms rejection candles (e.g., Pin Bar, Hammer, Engulfing) on 5–15 min charts.
Entry Point: Enter when price gives confirmation — candle + VWAP support or volume spike.
Stop Loss: Place SL slightly beyond the Gamma zone (e.g., below 24900 if buying CE).
Target: Nearest resistance level (e.g., 25050 or 25100).
Why It Works So Well
Market Maker Hedging: They aggressively hedge around Gamma zones, creating powerful intraday moves.
Expiry Day Power: Gamma sensitivity is highest near expiry — ideal for scalpers and option buyers.
Data-Driven: This is based on real-time OI shifts, not assumptions or indicators.
Rahul’s Tip
Use Gamma zones in confluence with VWAP, OI change, and candle confirmation . Never trade blindly at a Gamma level — wait for price action to confirm the setup.
Conclusion:
The Gamma Zone Reversal Strategy is one of the most reliable setups for expiry-based intraday trading. It helps you follow smart money behavior and enter trades at turning points where market makers are active.
If you want to learn everything about Futures and Options from A to Z, follow us now — I'm bringing powerful educational content your way!
Do you track Gamma zones in your trading? Let us know in the comments — and suggest any topic you want us to post next!

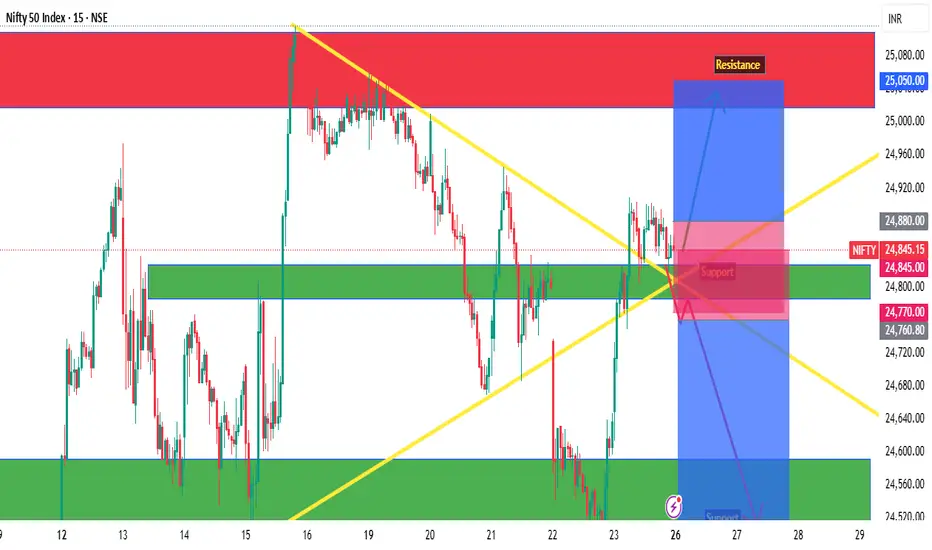
NIFTY : Trading levels and plan for 23-May-2025📊 Nifty Trading Plan – 23-May-2025
Chart Timeframe: 15 Min | Reference Spot Price: 24,637
Gap Opening Threshold: 100+ Points
🚀 Gap-Up Opening (100+ Points Above Previous Close)
If Nifty opens above 24,737 (i.e., 100+ points higher), it will directly enter the critical Opening Resistance Zone: 24,761 – 24,790 .
🟥 This zone has historically shown supply pressure, and a direct gap-up into it might lead to either a quick rejection or consolidation.
✅ Plan of Action:
– Avoid immediate long trades at open if price opens inside this zone.
– Wait for a 15-min candle to close above 24,790 to confirm bullish strength. If successful, Nifty could aim for 24,974, the last intraday resistance.
– If a bearish rejection pattern forms (like an inverted hammer or bearish engulfing) in this zone, consider a sell-on-rise setup targeting a retest of 24,648 and possibly down to 24,577.
– Ideal stop loss for shorts: Above 24,800–24,810.
🎓 Educational Insight: Gap-ups into resistance zones often trap breakout traders. Patience is key—let price confirm before acting.
📈 Flat Opening (within ±100 Points from Previous Close)
If Nifty opens between 24,537 – 24,737, it will be inside the indecisive zone between support and resistance.
🟧 This is often a low-conviction zone where both buyers and sellers test each other, causing choppy price action in the initial 30 minutes.
✅ Plan of Action:
– Avoid trading in the very first 15–30 minutes; let the market provide direction.
– If price holds above 24,648 and breaks out of 24,761, it can extend toward 24,790, and possibly test 24,974.
– If price fails to hold 24,577 and slips below 24,521, expect downside toward 24,196, the major support zone.
– Inside this range, prefer to trade only on confirmed breakouts or breakdowns with volume support.
🎓 Educational Insight: In flat openings, fakeouts are common. Let breakout candles be confirmed with size and volume.
📉 Gap-Down Opening (100+ Points Below Previous Close)
If Nifty opens below 24,537 (i.e., near 24,500 or lower), it will be close to the strong Opening Support Zone: 24,521 – 24,577 .
🟩 This zone has previously acted as a demand area and could attract buyers trying to play a reversal.
✅ Plan of Action:
– Observe price behavior near 24,521.
– If bullish reversal patterns emerge (e.g., hammer, bullish engulfing), and Nifty holds above this zone, consider long trade setups targeting a move back to 24,648 and potentially 24,761.
– If Nifty breaks down with a 15-min close below 24,521, sellers may gain control. Look for a further decline to 24,196, the last strong support.
– Ideal stop loss for longs: Below 24,500.
– Ideal stop loss for breakdown shorts: Above 24,540.
🎓 Educational Insight: Don't blindly buy into support zones—watch for confirmation candles to avoid catching a falling knife.
🛡️ Options Trading – Risk Management Tips
✅ Trade with a predefined stop-loss based on spot levels, not just option premiums.
✅ Use ATM or slightly ITM options to minimize time decay and benefit from delta movement.
✅ Avoid buying OTM options at open, especially on flat or range-bound days .
✅ Don’t trade in No Trade Zones (24,577 – 24,648) unless a clear breakout/breakdown happens.
✅ Book partial profits and trail SL once your trade starts working.
✅ Never overleverage —risk only 1–2% of your capital per trade.
✅ Take a break after 2 stop-losses ; overtrading reduces clarity and increases risk.
📌 Summary & Conclusion
🔹 Opening Resistance Zone: 24,761 – 24,790
🔹 Last Resistance: 24,974
🔹 Opening Support / Resistance Mid-Zone: 24,648
🔹 Support Zone: 24,577 – 24,521
🔹 Last Support: 24,196
🕒 First 15–30 mins are crucial . Let price action unfold before executing any trade.
🎯 Only enter trades after confirmation candles near key zones .
⚖️ Risk-to-reward setups are best near edges of the support/resistance levels , not in the middle zone.
📈 Trend confirmation + volume + candlestick patterns = High Probability Setup .
⚠️ Disclaimer:
I am not a SEBI-registered analyst. This trading plan is shared for educational and informational purposes only. Always consult with a registered financial advisor before taking any investment or trading decisions.
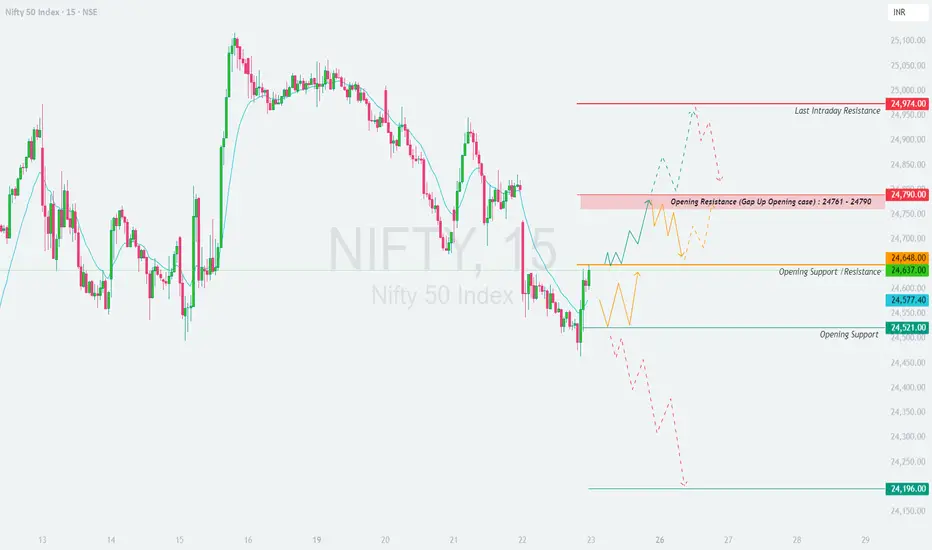
NIFTY : Trading levels and Plan for 22-May-2025📊 Nifty Trading Plan – 22-May-2025
Chart Timeframe: 15 Min | Reference Price: 24,800
Gap Opening Threshold: 100+ points
🚀 Gap-Up Opening (100+ Points Above Previous Close)
If Nifty opens above 24,900+, the price is likely to open directly inside or just below the Opening Resistance Zone: 24,889 – 24,904 .
🟥 This is a supply area and could trigger initial selling if price shows signs of rejection (wicked candles, indecision). Traders must avoid chasing longs on open and instead wait for either a breakout or rejection.
✅ If price sustains above 24,904 with a strong bullish candle close (preferably 15min or 1hr), you can initiate long trades targeting the Intraday Resistance Zone: 24,974 – 25,021 . If momentum continues, watch for a potential rally toward 25,136.
🔄 On the flip side, if the opening is followed by sharp rejection at 24,904 and the price falls back below 24,860, it may signal a failed breakout and can be a shorting opportunity back toward 24,800 and even the support zone at 24,738–24,718.
🎯 Plan of Action:
– Avoid impulsive longs at open.
– Long only on candle close above 24,904.
– Short if strong rejection appears and price falls below 24,860.
📈 Flat Opening (within ±100 Points)
If Nifty opens around 24,750 – 24,850, the price will be stuck between a crucial resistance (24,889–24,904) and support (24,738–24,718).
🟨 The initial price action will be range-bound. Let the market settle in the first 15–30 minutes and observe whether it breaks the upper resistance or support zones .
🟢 If price climbs and breaks 24,904 with a bullish confirmation candle, it opens the path to move higher toward 24,974 – 25,021, and eventually 25,136.
🟠 Conversely, if the price starts slipping below 24,718, and especially below 24,670.90 (last intraday support), sellers could gain control and drag the price toward the major demand zone 24,475 – 24,521 (Buyer's Support Zone).
🎯 Plan of Action:
– Wait for breakout from either 24,904 or breakdown below 24,718.
– Long trade setup above 24,904 with SL below breakout candle.
– Short setup below 24,718 with SL above breakdown candle.
📉 Gap-Down Opening (100+ Points Below Previous Close)
If Nifty opens around 24,650 or lower, it is opening directly near the Last Intraday Support: 24,670.90 .
🟦 This support can trigger a bounce if defended, and could present a quick long trade back toward 24,718 – 24,738 , possibly even 24,800 if momentum sustains.
🔻 However, if the price fails to hold this support and breaks below 24,670.90 early in the session, bears could take it down to the Buyer's Support Zone: 24,475 – 24,521 .
📌 Watch this green zone for possible bottom-fishing or reversal setups, especially if there’s a bullish reversal candle with volume. Otherwise, a clean breakdown below 24,475 could extend selling pressure further.
🎯 Plan of Action:
– If support holds → Buy on bullish reversal with tight SL.
– If breakdown below 24,670 → Short with target 24,475 zone.
– Below 24,475 → Avoid bottom fishing unless confirmed reversal.
🛡️ Risk Management Tips for Options Traders
✅ Avoid buying deep OTM options at the open; they lose premium fast if the move doesn't come immediately.
✅ Position sizing is key —never risk more than 1–2% of your capital on a single trade.
✅ Use Stop Loss based on spot level breakout/failure , not on premium value.
✅ Don't average losing trades. Wait for structure re-entry if SL hits.
✅ Trail your profits if in the green—book partials or move SL to cost to protect gains.
✅ Avoid trading first 15 minutes unless you're experienced in handling volatility.
📌 Summary & Conclusion
– Opening Resistance: 24,889 – 24,904
– Intraday Resistance: 24,974 – 25,021 | Final Target: 25,136
– Opening Support: 24,718 – 24,738 | Last Intraday Support: 24,670.90
– Major Buyer’s Support: 24,475 – 24,521
🎯 Key Idea: Trade the reaction at zones, not the prediction. Let the price action confirm your bias. Don’t rush into positions at the open—wait for confirmation to improve your risk-reward ratio.
⚠️ Disclaimer:
I am not a SEBI-registered analyst. This trading plan is shared for educational and informational purposes only. Please consult your financial advisor before making any investment or trading decisions.
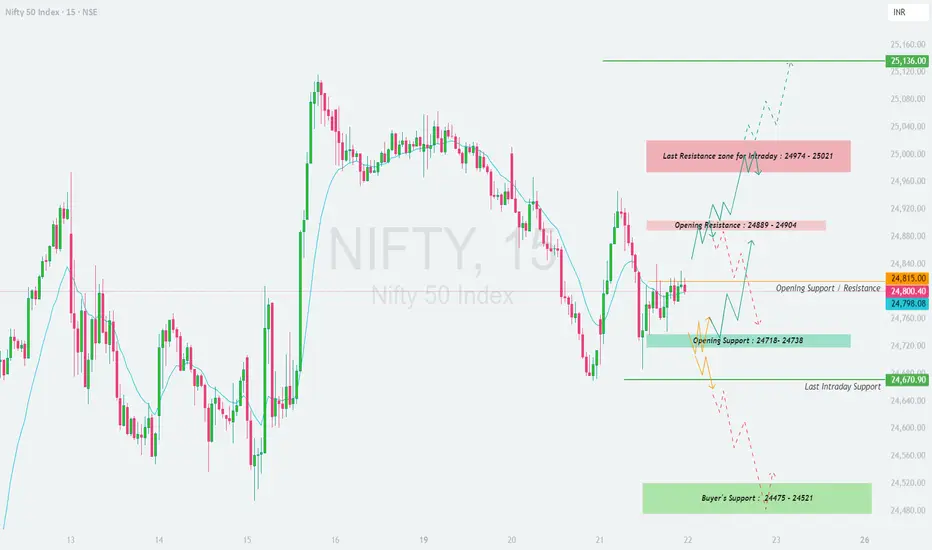
NIFTY : Trading Levels and Plan for 21-May-2025📅 NIFTY Trading Plan – 21st May 2025
🕘 Timeframe: 15-Minute | 🧠 Approach: Structure + Reaction Zones + Momentum Psychology
📊 Key Price Zones to Watch:
🔴 Last Intraday Resistance: 24,911
🔺 Breakout Resistance: 25,019
🟠 Opening Resistance: 24,818
🟢 Opening Support: 24,627
🟩 Buyer’s Demand Zone: 24,415 – 24,432
🧱 Critical Demand Base: 24,323
📈 Scenario 1: GAP UP Opening (🔼 100+ points) – Opening Above 24,818
If Nifty opens directly above the Opening Resistance of 24,818 due to a bullish gap-up, it enters a low-volume zone that could push prices toward 24,911 and even 25,019 .
Do NOT chase long entries blindly post gap-up. First 15–30 minutes will decide the strength of bulls.
If a strong 15-minute candle closes above 24,911 , a potential breakout to 25,019 may play out.
Only enter long trades if price holds above 24,911 with good volume.
If price faces rejection at 24,911 , short-term reversal trades back to 24,818 → 24,750 are possible.
Avoid overtrading above 25,019 ; it’s uncharted territory and momentum may fade quickly.
📌 Educational Note: Gap-ups often trap emotional buyers. Look for signs of sustainability before entering. If candles show exhaustion or long upper wicks, it's a red flag.
⚖️ Scenario 2: FLAT Opening (±100 points) – Between 24,627 to 24,818
A flat opening gives both bulls and bears room to maneuver, making it the most flexible condition to work with structure-based plans.
If price sustains above 24,750–24,760 (the pivot area), buyers may push toward 24,818 → 24,911 .
Clear bullish strength beyond 24,911 can target 25,019 , but only after volume confirmation.
On the flip side, if price breaks below 24,627 , short trades toward the Demand Zone: 24,415–24,432 become active.
Wait for bearish structure (e.g., breakdown + retest rejection) to confirm shorts.
Use the opening 15-minute candle high/low as your first trigger range for bias.
📌 Educational Note: Flat opens are all about who dominates first. Let the market decide. Don’t be early; price action is your teacher — not your ego.
📉 Scenario 3: GAP DOWN Opening (🔽 100+ points) – Opening Below 24,627
A gap-down opens doors to panic-selling but also offers opportunity if the demand zone absorbs pressure.
If price opens around 24,550–24,600 and forms a base, a bounce toward 24,627 → 24,750 is highly probable.
However, if price immediately slides into 24,415–24,432 (buyer zone), watch for reversal patterns like hammer, bullish engulfing, or double bottom.
If breakdown occurs below 24,415 , then 24,323 becomes the final lifeline. A close below this may trigger sharp intraday sell-offs.
Only short if 15-min candle closes below 24,415 and fails retest.
📌 Educational Note: Panic gaps test emotional discipline. Don't assume rebounds—wait for confirmation. It's okay to miss the first move and catch the trend later.
🛡️ Options Trading – Risk Management Tips:
✅ Avoid Far OTM Buying: Unless you see trending moves, far OTM options will decay quickly.
✅ Use Defined-Risk Spreads: Prefer Bull Call or Bear Put Spreads on breakout/breakdown confirmations.
✅ Keep SL Fixed in % Terms: Suggested: 30–40% SL of premium for option buyers.
✅ Use the Opening Candle High/Low: As SL reference for naked option positions.
✅ Avoid Overnight Carry: Especially for naked options—risk can be unlimited.
✅ Reassess After 2 Failed Trades: Market might be rangebound or volatile beyond logic.
📌 Summary & Conclusion:
🔼 Above 24,911: Momentum bullish → Target 25,019
🔄 Between 24,627 – 24,818: Neutral zone → Let structure form
🔽 Below 24,627: Weakness → Test of 24,432 → 24,323 possible
📌 Core Principle: Let the market confirm your bias. Be a sniper, not a machine gunner. Clear structure = clear edge.
📢 Disclaimer:
I am not a SEBI-registered analyst . This content is purely for educational and informational purposes [/b
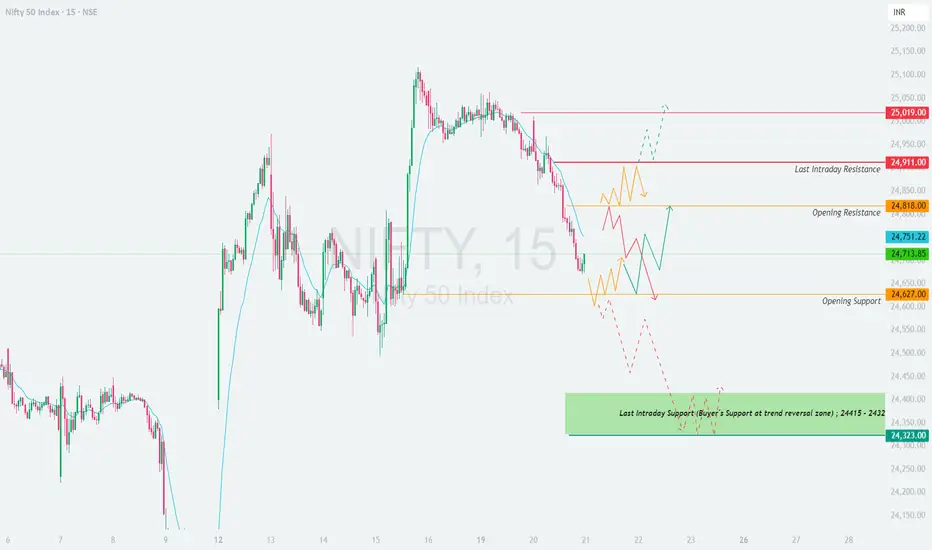
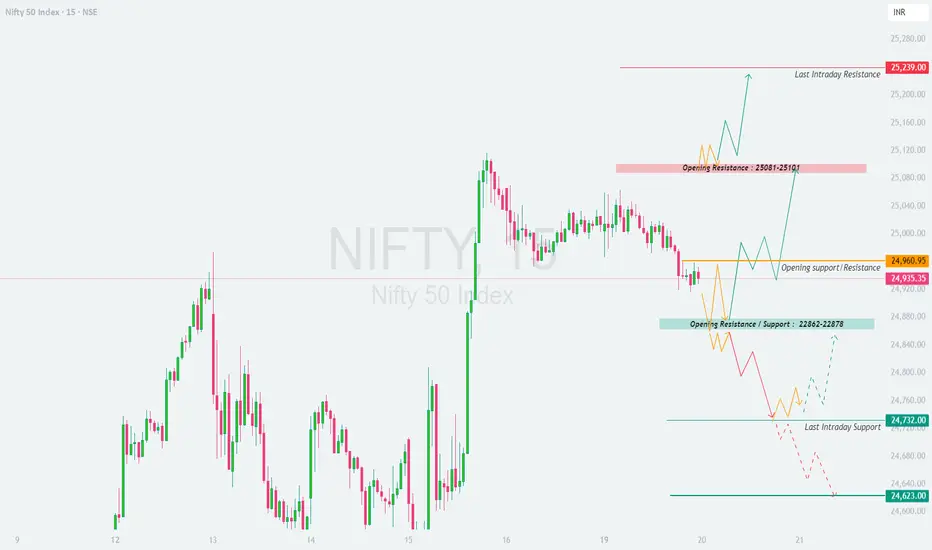
NIFTY : Trading levels and Plan for 20-May-2025📅 NIFTY Trading Plan – 20th May 2025
🕒 Timeframe: 15-Minute | 🎯 Strategy Focus: Price Reaction Zones + Structure-Based Trading + Psychological Triggers
📌 Key Zones to Watch:
🔴 Resistance Zone: 25,081 – 25,101
🟠 Opening Pivot Zone: 24,960 – 24,980
🟦 Initial Support/Resistance: 24,862 – 24,878
🟢 Last Intraday Support: 24,732
🟢 Final Breakdown Support: 24,623
🔺 Last Intraday Resistance: 25,239
📈 Scenario 1: GAP UP Opening (🔺 100+ points) – Opening Above 25,050
If Nifty opens with a strong gap-up directly into or above the resistance zone 25,081 – 25,101 , it enters a supply zone from where reversals have occurred in the past.
Avoid rushing into long trades immediately after a gap-up.
Wait for a 15-minute candle close above 25,101 with strong follow-up buying volume to confirm breakout strength.
On confirmation, expect targets toward 25,180 → 25,239 (last intraday resistance) .
However, if price gets rejected from the resistance zone with upper wicks or bearish engulfing candles, then short trades toward 24,980 → 24,960 become favorable.
A failed breakout from this level often leads to a short-trap liquidation move.
📌 Educational Note: A gap-up into resistance is a liquidity magnet. Always seek candle confirmation before acting. Momentum traders should only participate if the breakout sustains with strength.
⚖️ Scenario 2: FLAT Opening (Within ±100 points) – Between 24,860 – 24,980
This scenario offers the most balanced opportunity to trade both sides, depending on where price moves post-opening.
If price sustains above 24,980 for 15–30 minutes, a breakout attempt toward 25,081 → 25,101 is likely.
A clear break and close above 25,101 may trigger long trades aiming for 25,180 → 25,239 .
On the downside, if price fails to hold above 24,960 and breaks below 24,878 , a slide toward 24,732 → 24,623 can unfold.
For rangebound movement, you may consider deploying neutral strategies like Iron Fly or ATM straddle with tight SLs.
📌 Educational Note: Flat opens are where the market seeks direction. Don’t trade the first candle — observe whether buyers or sellers dominate before committing capital.
📉 Scenario 3: GAP DOWN Opening (🔻 100+ points) – Opening Below 24,860
A gap-down below the initial support zone 24,862–24,878 sets a bearish tone, but it can trap emotional sellers if not confirmed.
If the price opens near 24,840–24,860 and shows early signs of holding, a short-covering move back to 24,960 is possible.
However, if price breaches below 24,732 (last intraday support) , the index could slide further toward 24,623 .
Avoid buying blindly just because it's a gap-down — instead, wait for a reversal confirmation (hammer, morning star).
Momentum traders can go short below 24,732 with SL above 24,780, targeting 24,650 – 24,623 .
📌 Educational Note: Gap-downs often trigger panic. Smart traders stay calm and react only when price gives clean structure — don’t bottom fish unless a reversal structure appears.
🛡️ Options Trading – Risk Management Tips:
✅ Respect the Premium Decay: Avoid buying far OTM options on Tuesday unless there's strong momentum confirmation.
✅ Set SL as a % of Premium: Use a 30–40% SL of premium for long option positions.
✅ Hedge Naked Options: If selling options, always hedge using defined-risk spreads.
✅ Use Time-Decaying Strategies: Calendar spreads or neutral plays work better in choppy zones.
✅ Position Sizing is Key: Don’t risk more than 1–2% of capital per trade — it protects your mental capital too.
✅ Avoid Holding Naked Positions Overnight: Carry only if hedged or directional clarity is backed by event data.
📊 Summary & Conclusion:
🔼 Above 25,101: Bullish momentum likely → Target 25,180 – 25,239
🔄 Between 24,862 – 24,980: Neutral zone → Wait for breakout or breakdown
🔽 Below 24,862: Bearish tone → Target 24,732 – 24,623 on confirmation
📌 Key Lesson: Let price confirm the move. React, don’t predict. Level-based action always wins over emotions.
📢 Disclaimer:
I am not a SEBI-registered analyst . The above content is shared purely for educational and informational purposes. Please consult your financial advisor or do your own research before taking any trades.
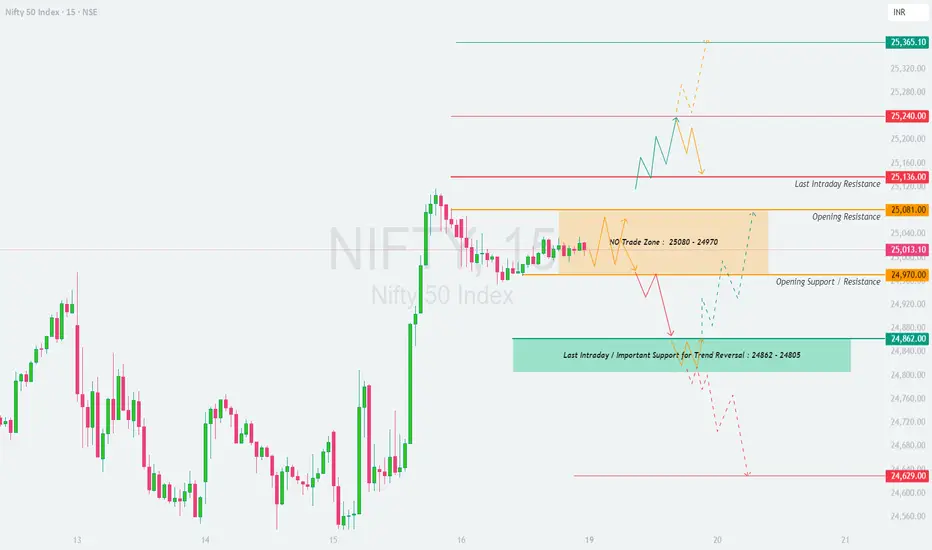
NIFTY : Trading levels and Plan for 19-May-2025📅 NIFTY 50 Trading Plan – 19th May 2025
⏰ Timeframe: 15-Minute | 🧠 Approach: Actionable, Risk-Reward Based, Psychological Zones
📍 Chart Key Levels:
🔸 No Trade Zone: 25,080 – 24,970
🟥 Opening Resistance: 25,081
🟧 Opening Support / Resistance: 24,970
🟩 Strong Support Zone: 24,862 – 24,805
🟥 Last Intraday Resistance: 25,136
🔺 Target/ATH Zone: 25,240 → 25,365
🟥 Breakdown Zone: Below 24,862 leads to weakness with next support at 24,629
📈 Scenario 1: GAP UP Opening (100+ Points Up) – Above 25,136 🚀
If Nifty opens with a gap-up above 25,136 , prices will already be near or inside the resistance zone. Avoid chasing trades at open.
Wait for a 15-min candle to close above 25,240 . This confirms strength and opens the way toward the ATH zone of 25,365+ .
Book profits gradually near ATH zone, and expect possible selling pressure here.
If price fails to sustain above 25,240 , avoid fresh longs and look for rejection patterns (like bearish engulfing) for quick intraday shorts back to 25,136 .
📌 Educational Note: When the market opens in a resistance zone, let it settle for the first 15–30 minutes to avoid false breakouts.
📉 Scenario 2: FLAT Opening (within 50 pts of previous close) – Inside No Trade Zone (24,970–25,080) 🔄
Opening in this range creates confusion. This zone is best avoided for fresh trades unless a breakout/breakdown is confirmed.
If price breaks above 25,081 with strong bullish momentum, you may consider a long entry targeting 25,136 → 25,240 .
If price breaks down below 24,970 , you can initiate short positions with target toward 24,862 → 24,805 .
Avoid any position inside the orange zone until one side is clearly broken.
📌 Educational Note: No Trade Zones often result in whipsaw moves – stay disciplined and wait for clean direction.
📉 Scenario 3: GAP DOWN Opening (100+ Points Down) – Below 24,862 ⚠️
If the market opens below the key support zone of 24,862 , sentiment turns bearish.
Look for follow-through selling below 24,805 to target 24,629 .
However, any bounce-back from 24,805 – 24,862 zone with volume confirmation can be used for intraday reversal trades back to 24,970 .
Wait for a proper rejection candle or bullish engulfing pattern before taking reversal long trades.
📌 Educational Note: Strong support zones can lead to high risk-reward reversal trades if combined with proper price action.
💡 Options Trading – Risk Management Tips:
🛡️ Always hedge directional positions when holding beyond intraday.
⏳ Avoid buying options when IV is high, especially after gap-ups.
💰 Use defined SLs like hourly candle closes to avoid panic exits.
📉 If trading breakout with options, consider buying near the money for better delta impact.
📊 Summary:
✅ Above 25,240 = bullish continuation zone
⚠️ 25,081 – 24,970 = No Trade Zone
🔻 Below 24,862 = Trend reversal or fresh weakness
Wait for first 15–30 min candle to confirm trade direction. Avoid emotional entries and focus on clean breakout or reversal confirmation patterns.
📢 Disclaimer:
I am not a SEBI-registered analyst . All views shared are for educational purposes only. Please do your own research or consult with a financial advisor before taking any trades.
Nifty 50 Technical Analysis - May 16, 2025Nifty 50 Technical Analysis - May 13, 2025
Current Market Overview:
Closing Price: The Nifty 50 closed at 25,035.30, Up 395.20 points.
Day Range: Low: 24,750.00 | High: 25,400.00
Market Sentiment: The market exhibited strong bullish momentum, driven by positive global cues, including a ceasefire between India and Pakistan and optimism around US-China trade negotiations
Chart for your reference

Nifty Bull 4 hours chartNifty 4Hours trend
Nifty BUY trend has been started in 4hrs timeframe.
Good opportunity Whenever Candle comes near 200SMA or 50SMA.
But before rally might give retacement.
