NIFTY : Intraday Trading levels and Plan for 26-Mar-2025
📊 Current Market Status:
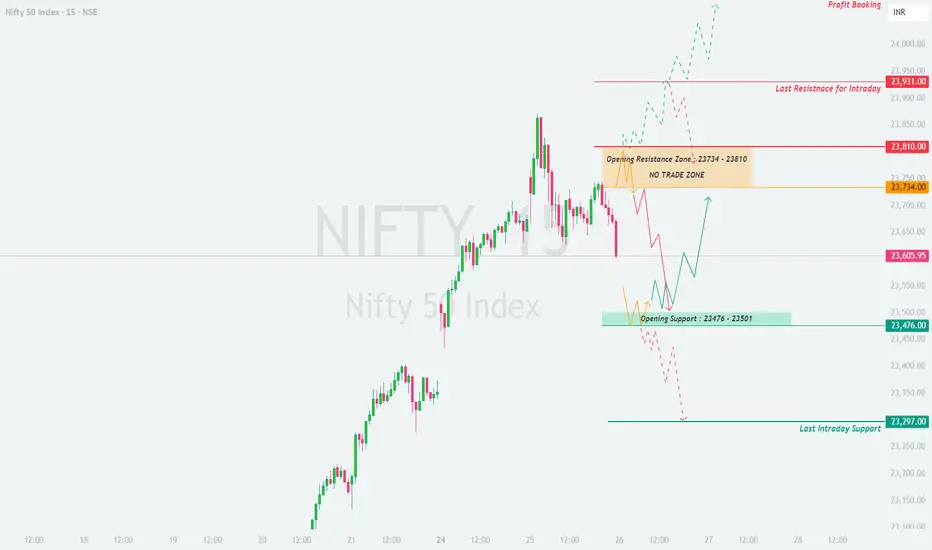
NIFTY closed at 23,605.95, showing a decline from recent highs. The price action suggests that the index is at a crucial juncture, with key resistance and support levels defining tomorrow’s possible movement. Let’s analyze the plan for different opening scenarios.
🔼 Scenario 1: Gap-Up Opening (100+ points)
If NIFTY opens above 23,734, it will enter the Opening Resistance Zone (23,734 – 23,810), which is a crucial level for bulls. A sustained breakout above this zone will determine further upside movement.
✅ Plan of Action:
If NIFTY sustains above 23,810, expect a move towards 23,931 (last intraday resistance). A further breakout above 23,931 could take it towards 24,087 (Profit Booking Zone).
If the index rejects 23,810 and starts reversing, look for short opportunities targeting 23,734 → 23,605.
Avoid trading within the No Trade Zone (23,734 – 23,810) unless a clear breakout or breakdown occurs.
🎯 Pro Tip: A strong gap-up near 23,810 might trigger profit booking, so avoid aggressive longs unless momentum is confirmed.
⚖ Scenario 2: Flat Opening (Within ±100 points)
A flat opening around 23,605 means NIFTY is indecisive, requiring confirmation at key levels before entering trades.
✅ Plan of Action:
Upside case: If NIFTY breaks above 23,734, it could retest 23,810, and a breakout above that can push it towards 23,931 – 24,087.
Downside case: If the index breaks below 23,605, expect selling pressure towards the Opening Support Zone (23,476 – 23,501).
Neutral Approach: Avoid trading within the No Trade Zone (23,734 – 23,810) unless a strong breakout occurs.
🎯 Pro Tip: If volatility is low, options traders can use Iron Condors or Straddle Sells for range-bound strategies.
🔽 Scenario 3: Gap-Down Opening (100+ points)
If NIFTY opens below 23,476, bearish sentiment might take control, and we must assess the strength of support zones.
✅ Plan of Action:
If price sustains below 23,476, expect a decline towards 23,297 (Last Intraday Support).
If price takes support at 23,476 – 23,501 and rebounds, a potential pullback entry can be considered, targeting 23,605 – 23,734.
Watch for trap setups—if NIFTY opens low but quickly reverses above 23,476, it could be a bear trap leading to a short squeeze.
🎯 Pro Tip: In a gap-down scenario, avoid panic selling and wait for a breakdown retest before entering trades.
⚠️ Risk Management Tips for Options Traders
🔹 Avoid over-leveraging – Trade within your risk capacity and manage exposure wisely.
🔹 Theta Decay Awareness – Options traders should be mindful of premium decay, especially near expiry.
🔹 Hedge Your Positions – Use spreads instead of naked options to reduce risk.
🔹 Wait for Confirmation – Never enter trades based on emotions; always wait for price action confirmation.
📌 Summary & Conclusion
📍 Key Levels to Watch:
🟥 Resistance: 23,734 → 23,810 → 23,931 → 24,087
🟧 No Trade Zone: 23,734 – 23,810
🟦 Support: 23,476 – 23,501 → 23,297
🔸 Bullish Bias: Above 23,810 for targets of 23,931 – 24,087
🔸 Bearish Bias: Below 23,476 for a move towards 23,297
🔸 Neutral/Range-Bound: If price remains between 23,734 – 23,810
🎯 Final Advice:
Follow levels with discipline.
Avoid overtrading in No Trade Zones.
Let the first 15-30 minutes settle before making aggressive trades.
📢 Disclaimer
I am not a SEBI-registered analyst. This analysis is for educational purposes only. Please do your research or consult with a financial advisor before making trading decisions.
🚀 Stay updated on live trading levels & setups!
Niftyoptions
NIFTY : Intraday Trading Levels and Plan for 25-Mar-2025📅 NIFTY 50 Trading Plan – 25th March 2025
⏰ Timeframe: 15-min | 📊 Index Spot Reference: 23,674
🔍 Opening Scenario 1: GAP-UP Opening (100+ points)
If NIFTY opens significantly higher and trades above the 23,750 mark:
Keep a close eye on the Opening Resistance Zone between 23,863–23,931 . This area has historically acted as supply pressure, and price may show signs of rejection or pause here. If price action shows exhaustion in this zone (long upper wicks or bearish reversal candles), it can offer a high-probability short opportunity with tight risk. If a 15-min candle sustains and closes above 23,931 , Nifty may continue its bullish momentum towards the next level around 24,089 – marked as the “Last and Strong Resistance for Intraday.” Avoid aggressive buying near resistance. Instead, look for a pullback entry post-breakout with SL below the breakout candle’s low.
🧠 Tip: Don’t chase price. Let it stabilize before entry. In options, use OTM puts to short with defined SL and strict risk reward of at least 1:2.
🔍 Opening Scenario 2: FLAT Opening (±100 points)
If NIFTY opens near Friday’s close (23,651–23,674):
Wait for the first 15–30 mins to settle volatility. The price is currently in the middle of a decision zone. Watch for directional cues near 23,582–23,651 . Holding above this zone with strength can signal a move towards resistance zones mentioned above. If the index breaks below 23,582 , it may test the next demand zone between 23,507–23,491 . For bullish bias, price must sustain above 23,651 with volume and momentum. Look for bullish reversal candles like Hammer or Bullish Engulfing for confirmation.
🧠 Tip: For flat openings, straddles or strangles can be considered in options, but manage the premiums with strict SL, especially if the index remains range-bound.
🔍 Opening Scenario 3: GAP-DOWN Opening (100+ points)
If NIFTY opens around or below 23,500:
Watch 23,507–23,491 zone for any immediate bounce-back reaction. If buyers step in with volume, a quick pullback to 23,582+ is possible. If price slips below 23,491 , then 23,368 becomes the last support for the day. Breakdown below 23,368 could lead to a sharp fall toward lower psychological supports. Reversal trades should only be taken if there’s a bullish candle confirmation near support zones with increasing volume. If Nifty stabilizes and forms a base near 23,368, short-covering rallies can be sharp and tradeable.
🧠 Tip: Use spreads (bear call or bull put) in high volatility gaps. Avoid naked options with aggressive sizing post gap-down as premiums get inflated.
💡 Risk Management Tips for Options Traders:
Always trade with a fixed capital allocation per setup – ideally 2–5% of total capital. Don’t hold losing positions past your defined stop loss – honor SL with discipline. For intraday option trades, use 5-min/15-min candles to trail SL for locking in profits. Avoid holding zero-value options till expiry unless it's part of a hedge. Focus more on setups with favorable risk-reward, not just option premiums.
📌 Summary & Conclusion:
✅ Upside Zones to Watch: 23,863–23,931 (resistance), 24,089 (extension target)
✅ Support Zones: 23,582 → 23,507 → 23,491 → 23,368
✅ Strategy Focus: Wait for clear price action in respective zones; avoid emotional trades on gap days. Respect the market structure and plan trades only with confirmations.
⚠️ Disclaimer: I am not a SEBI-registered analyst. This plan is shared purely for educational and informational purposes. Please consult with your financial advisor before making any trading decisions.

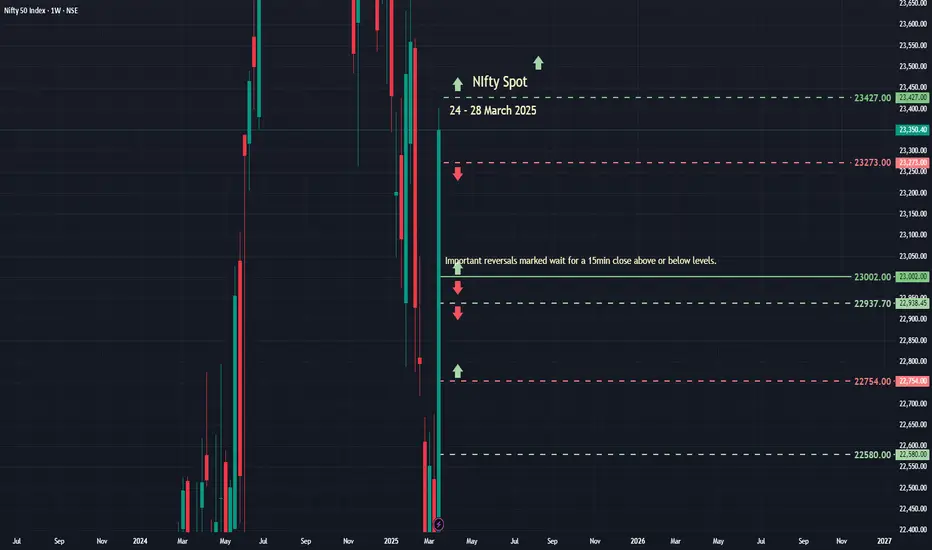
Nifty SpotNifty Spot
for 24 - 28 March 2025
last week NS opened @ 22353.15 as O=L
gave incredible 1000+ points
The important level is 23427 (30min close) for the market to give a fresh breakout.
Similarly if the market makes a 30m close below 23427 then probably 23400 PE can be a bes t bet for options players....
Again exiting position at a level mentioned below that...
Level to level trading is recommended...
Happy trading and Profit making with proper planning..
Like.. Share.. Comment...
NIFTY Prediction for Tomorrow – March 25, 2025What happened on last day:
As we discussed, the NIFTY has been in a sideways accumulation phase, and it has now broken to the upside.
If we look at the chart now:
The market is trading just below the 200 EMA (1D-tf) , which is acting as a strong resistance. Price has shown strong bullish momentum and has successfully broken out from the descending PINK trendline , which had held the price for over 10 months.
Structure-wise, NIFTY is forming higher highs and higher lows , suggesting a clear shift in momentum from bearish to bullish.
Price is trading above the 13, 50, and 100 EMAs , but still below the 200 EMA , which remains the immediate level to cross.
RSI = 64 , showing strong bullishness but not yet in the overbought zone — bulls still have strength.
Price is also trading above VWAP , confirming healthy bullish bias on the day.
All important breakout levels, retest zones, and trendlines are clearly marked on the chart.
Support levels: 22,775, 21,987, 21,840
Resistance levels: 23,600, 23,870, 24,790
If we look at the OI data:
PCR = 1.1 , showing a strong bullish structure in the options market.
There is strong Put writing at 23,000, 23,100, and 23,200 levels which are likely to act as near-term supports.
On the upside, significant Call writing is seen at 23,600, 23,700, and 23,800 levels — making them key resistance levels.
We are currently in the last week of the March monthly expiry (27 Mar) , so this OI structure gives strong directional cues.
If we look at the news & sentiment:
INDIA VIX = 12.6 , showing low volatility expectations.
No negative macro or global cues, INR and crude oil are stable.
Sentiment across financial media is cautiously bullish , with attention on whether NIFTY can sustain above the 23,600 zone.
I am expecting
The market to be sideways to bullish unless it breaks above 23,600 decisively, which could lead to further rally toward 23,870 and 24,790 .
Reasons:
✅ Breakout from 10-month falling channel
❗Price > EMA(13, 50, 100) but just below 200 EMA (Bullish but watch for breakout)
✅ Volume spike confirms institutional participation
✅ Clean higher-low structure forming
✅ Above 50 EMA and approaching 200 EMA
Verdict: Sideways or Bullish
Plan of action:
Sell 23,600 CE and 23,600 PE — hold the position within range.
Exit one leg if price breaks on either side with momentum and volume.

Nifty weekly analysis for 17/03/2025Nifty is trading between 100 EMA (weekly) and 20 EMA (daily). A good support from the weekly moving average is there and resistance on the daily charts.
A continuous support from 22300 level is there as the market has remained in a range whole week.
If the market tried to breach the support level, the support of weekly 100 EMA can be the other support around 22030 else it will take support around 21800.
In case the market starts to recover from the bottom and creates a higher high higher low formation it has to take out the resistance of 22650 and 22758.
Major levels are plotted in the charts. Just wait for the price action to confirm the entry into a trade else another sideways market can be seen.
Inside candle formation on the daily charts is also there and break out/down can be traded accordingly. Different trading approaches can help in capturing a good trade.
Wait for the price action near the levels before entering the market.

Nifty50 If a hourly candle sustains or Close below white trend line then it could test 22490 -- 22505 within 11th March .
Disclaimer :
It's a personal view not a financial advice and I assume no responsibility and liability whatever outcome arises.

Nifty - Sell on RiseStrong supply area in multiple time frames like Daily / 125 / 75
Also a strong gap area
Expected resistance zone to fall between 22630 - 22730
Upside Sl above 22800
Downside targets 22400 & 22000
Entry with 15/25 min candle confirmation only

Nifty weekly analysis for 10/03/2025.Is this the end of the fall or its just a retracement. The market after a while has given some hope of a green week.
It is a retest or a base formation no body knows. Nifty is trading around 22550 levels and looks somewhat positive for the coming week.
Market is still in the down trend and bullish trend will only be confirmed once a 'W' pattern is formed on higher time frame or a break out is done.
On the hourly charts, market remained in a range for the last trading session, the sideways market can continue as it may form a base and trend reverses from here.
In case the market remains in the trend lower levels of 21800-850 might be coming. Else market may start travelling on the higher side hitting the resistance levels.
Major support levels :- 22310-360, 22050-090
Resistance levls :- 21620, 21760
A gap filling trade on the higher side can be seen in the coming week as a gap is pending.
Watch for the price action and trade accordingly. A sideway or volatile market is more probable as the market has been trading in a trend.

NIFTY prediction for tomorrow 5th March 25Nifty has been falling continuously for a month. If we look at the structure using price action.
If we look at the chart now:
The market is trading near the support zone. The market might take support at nearly 22,000 levels. Price is trading far away from the EMA, which shows the market is going to take some pullback to the upside. The market is going to be sideways for some time unless it breaks the Pink trendline to the upside.
Support levels: 21840, 21250
Resistance levels: 22775, 23488, 50 EMA, 200 EMA
If we look at the OI data:
PCR = 0.8, which shows a slightly bullish structure in the market. The market has 22100 as max pain. The market has good PE writing at lower levels; 22000 and 21900 have very good PE writing, which will act as good support in this area.
I am expecting
The market is to be sideways unless it breaks the PINK trendline.
Reason:
RSI = 21 shows a bullish structure. (Weak Bearish -> Bulls might start buying, soon)
Price < EMA(13, 50, 200), which indicates a good Bearish structure. (Bearish)
PCR = 0.8 indicates a slightly bullish bias direction in the market.
Price < VWAP shows a good Bearish structure in the market.
Verdict: Sideways
Plan of action:
follow the chart levels. You better go with the bound strategy.

Nifty Trading Strategyy for 03rd March 2025📈 Nifty Trade Setup 📉
💰 Entry Strategy:
🔼 Buy Above: The high of the 1-hour candle that closes above 22,250
🎯 Targets: 22,316 | 22,395 | 22,473
🔽 Sell Below: The low of the 15-minute candle that closes below 22,100
🎯 Targets: 22,029 | 21,934 | 21,855
📊 Trade Explanation:
Why wait for a candle close?
A 1-hour candle closing above 22,250 confirms bullish strength, filtering out false breakouts.
A 15-minute candle closing below 22,100 provides an early signal of bearish momentum.
Advantages of this approach:
Reduces false breakouts and whipsaws.
Aligns with price action confirmation, increasing trade accuracy.
Works well with additional indicators like RSI, MACD, Moving Averages, or Volume Analysis for extra confirmation.
⚠️ Disclaimer:
I am not a SEBI-registered analyst or advisor. The information provided here is for educational and informational purposes only and should not be considered as financial or investment advice. Trading in the stock market involves significant risk, and there is no guarantee of profit. You are solely responsible for your trading decisions, and it is strongly recommended to conduct your own research or consult a SEBI-registered financial professional before making any trading or investment decisions. Past performance is not indicative of future results.

Nifty Trading Strategy for 24th Feb 2025📊 NIFTY INTRADAY TRADING PLAN 📊
🔹 Strategy:
This plan is based on the breakout of a key level after a confirmed 15-minute candle close.
🟢 Buy Setup (Bullish Breakout)
✅ Entry Condition: Enter a buy position above the high of the 15-minute candle that closes above 22,921.
✅ Targets:
🎯 First Target: 22,966
🎯 Second Target: 23,038
🎯 Final Target: 23,099
✅ Stop Loss: Below the low of the entry candle.
✅ Risk Management: Follow a risk-reward ratio of at least 1:2.
🔴 Sell Setup (Bearish Breakdown)
✅ Entry Condition: Enter a sell position below the low of the 15-minute candle that closes below 22,700.
✅ Targets:
🎯 First Target: 22,653
🎯 Second Target: 22,608
🎯 Final Target: 22,562
✅ Stop Loss: Above the high of the entry candle.
✅ Risk Management: Avoid overleveraging and use a stop-loss strategy.
⚠ Important Notes:
📌 Wait for levels to come into play – If there is a big gap-up or gap-down, do not rush into a trade. Instead, wait for price action confirmation at the key levels.
📌 A lost opportunity could be capital saved – Patience is key! If the setup doesn't align, it's better to stay out than force a trade.
📌 Avoid trading during high-impact news events – Volatility can cause sudden price movements.
🚨 Disclaimer:
This analysis is for educational and informational purposes only and should not be considered financial or investment advice. I am not SEBI-registered. Trading in financial markets involves significant risk, and past performance is not indicative of future results. Trade responsibly and use proper risk management. 🚀📉

Option Buying, Selling & Hedging: Key Nifty Strategies
Hey traders! Today, we’re diving into the exciting world of options trading. We’ll compare three key strategies: Option Buying , Option Selling , and Option Hedging . Let’s break them down with a real-time example of Nifty options and understand how each of them works.
Option Buying (Call Option)
Trade Details:
Strike Price: 22950 CE
Expiry Date: 27th February 2025
Premium: 191
Probability of Profit: 33.36%
Maximum Profit: Undefined
Maximum Loss: 14,325 (-99.85%)
Breakeven Point: 23141.0
Payoff Chart Analysis:
When you buy a Call Option , your loss is limited to the premium you paid (14,325).
The profit potential is unlimited if the underlying asset (Nifty) moves significantly higher.
The payoff chart shows a steep upward curve , indicating significant profit if the market goes up, but also highlighting the steep loss if the market doesn’t move in your favor.
Option Selling (Put Option)
Trade Details:
Strike Price: 22950 PE
Expiry Date: 27th February 2025
Premium: 189.6
Probability of Profit: 61.54%
Maximum Profit: 14,220 (7.41%)
Maximum Loss: Undefined
Breakeven Point: 22761.0
Payoff Chart Analysis:
When you sell a Put Option , you receive premium upfront and aim to profit from minimal market movement.
Maximum loss is potentially unlimited if the market falls drastically.
Profit is capped at the premium received (14,220), making it a strategy suited for range-bound markets .
The payoff chart shows a gradual upward slope , with limited profit potential and high risk if the market moves sharply lower.
Option Hedging (Buy and Sell Combination)
Trade Details:
Sell Put Option (22950 PE) at 189.6
Buy Put Option (22850 PE) at 146.65
Net Credit: 3,221 (7.72%)
Maximum Loss: 4,279 (-10.26%)
Breakeven Point: 22908.0
Payoff Chart Analysis:
Option Hedging involves combining option buying and option selling to limit risk while maintaining profit potential.
The maximum loss is capped , which is crucial for managing risk in volatile markets.
This strategy offers moderate profit (3,221) with a relatively higher probability of profit (50.49%).
The risk-to-reward ratio (1:0.75) suggests a more balanced approach than buying or selling options alone.
Real-World Application:
Option Hedging is beneficial when you expect volatility but want to control potential losses by limiting exposure.
Example: Combining a short Put with a long Put to create a bullish or neutral strategy in uncertain market conditions.
Key Comparisons
Profit Potential:
Buying options offers unlimited profit .
Selling options offers limited profit but carries unlimited risk .
Hedging offers a moderate profit with capped loss , balancing risk and reward.
Risk and Loss:
Buying options has a limited loss (premium paid).
Selling options exposes you to unlimited loss .
Hedging reduces risk by capping both profit and loss, offering more control.
Probability of Profit:
Selling options usually has a higher probability of profit due to premium collection .
Buying options typically has a lower probability due to the need for significant market movement.
Hedging strikes a balance, with 50.49% probability of profit .
Break-even Point:
For option buyers , the break-even point is above the strike price, meaning the underlying asset needs to rise substantially for you to profit.
For option sellers , the break-even point is lower than the strike price, meaning the underlying asset can drop slightly before you start losing money.
Hedging combines both, providing a controlled risk environment.
Real-World Application
Option Buying (Call):
Great for when you expect sharp upward moves .
Example: You buy a Call option because you believe the market is going to soar, and you want to capture that upside.
Option Selling (Put):
Ideal for stable or slightly bullish markets .
Example: You sell a Put option because you believe the market will stay the same or rise slightly, and you’re comfortable taking the risk in exchange for the premium.
Option Hedging:
Perfect when you expect volatility but don’t want to take on excessive risk.
Example: You combine a short Put with a long Put to create a bullish or neutral strategy in uncertain market conditions.
Risk Management Considerations
For Option Buying:
Know your maximum loss (the premium you paid) and never risk more than you can afford to lose.
Control your risk by picking options that fit your risk tolerance and market expectations.
For Option Selling:
Ensure you have enough margin to cover potential losses.
Always be aware of the unlimited risk that comes with selling options.
For Hedging:
Balance risk and reward effectively by using both buying and selling strategies.
Helps you minimize the impact of extreme market movements while still being in the game.
Conclusion
All three strategies— Option Buying , Option Selling , and Option Hedging —have their pros and cons. The best one for you depends on your market outlook, risk tolerance, and trading goals.
What strategy do you prefer? Let me know in the comments!

Nifty - At Crucial PointNifty current area from 22640 to 22910 becomes a very crucial zone now
If tries to sustain n takes support then expect nifty to hover near support for few days before going back up again near 23600
But if the pressure continues and nifty successfully breaks and closes below 22640 in the daily TF
Then expect the same area (22640 - 22910) to act as a resistance and also Nifty can go to touch downside target of 21880

Nifty Intraday Trading Strategy for 14th Feb 2025📊 Nifty Intraday Trading Strategy – Key Levels 📊
📌 Buy Setup
🔹 Buy Above: 23,185 (Only after confirmation)
🎯 Target 1: 23,220
🎯 Target 2: 23,260
🎯 Target 3: 23,310
📍 Stop Loss: Below the 15-minute candle low after breakout confirmation.
🔹 Conditions for Buying:
✅ A 15-minute candle must close above 23,185 to confirm the breakout.
✅ Enter a buy position only if the price crosses above the high of this 15-minute candle.
✅ Wait for a retest or sustained momentum before entering a trade.
✅ Ensure volume confirmation and market trend alignment before taking a position.
📌 Sell Setup
🔹 Sell Below: 22,964 (Only after confirmation)
🎯 Target 1: 22,910
🎯 Target 2: 22,860
🎯 Target 3: 22,820
📍 Stop Loss: Above the 15-minute candle high after breakdown confirmation.
🔹 Conditions for Selling:
✅ A 15-minute candle must close below 22,964 to confirm the breakdown.
✅ Enter a sell position only if the price drops below the low of this 15-minute candle.
✅ Avoid early entries—wait for a proper close below this level.
✅ Watch for volume confirmation and trend continuation before entering a short position.
⚠ Important Notes:
🔸 Risk Management: Always use stop-loss and proper position sizing to protect your capital.
🔸 Market Conditions: Consider global cues, economic data, and overall sentiment before trading.
🔸 Volatility Caution: Avoid trading during high-impact news events and sudden spikes.
📌 Disclaimer: I am not a SEBI-registered analyst. This analysis is for educational purposes only and should not be considered financial advice. Please consult a certified financial professional before making any trading decisions. Trade at your own risk.

Nifty Intraday Trading Levels for 13th Feb 2025Nifty Intraday Trading Levels
🔹 Buy Setup:
Buy Above: 23,146
📍 Targets: 23,180, 23,230, 23,295, 23,350
🔹 Sell Setup:
Sell Below: 22,950
📍 Targets: 22,900, 22,840, 22,790, 22,740
📌 Trade Execution Strategy:
Buy Confirmation: Enter a long position only if a 15-minute candle closes above 23,146, and buy above the high of that candle.
Sell Confirmation: Enter a short position only if a 15-minute candle closes below 22,950, and sell below the low of that candle.
This method helps filter out false breakouts and provides better confirmation for trades.
📌 Market Outlook & Risk Management:
If Nifty breaks above 23,146 with strong volume, it may continue its bullish trend and hit higher targets.
If Nifty falls below 22,950, it may indicate selling pressure, leading to lower support levels.
Risk Management: Always use a stop-loss to manage risk and protect capital.
📢 Disclaimer:
I am not SEBI registered, and this analysis is for educational purposes only. Trading in the stock market involves high risk, and past performance does not guarantee future results. Always conduct your own research and consult a SEBI-registered financial advisor before making any trading decisions. I am not responsible for any financial losses incurred based on this information. 🚨

Nifty Downtrend Movement upto 23200Symbol Nifty
Timeframe 15 min
Analysis Breakout from the channel. Down trend movement .Target expect is 23200
We hope our analysis is adding value to your trading journey.
Please note: Published ideas are for educational purposes only. Trade at your own risk.
Also, please respect the risk - stop loss (SL) should not be more than 2% of the capital.
DISCLAIMER: We are not SEBI registered. All the ideas posted in this channel are solely for educational purposes."

Nifty Intraday Trading Levels for 07th Feb 2025Nifty Intraday Trading Levels
Buy Setup
📌 Buy Above: The high of the first 15-minute candle that closes above 23,774
🎯 Targets: 23,822, 23,901, 23,935, 23,963, 23,992
🛑 Stop Loss: Below the low of the breakout candle
Sell Setup
📌 Sell Below: The low of the first 15-minute candle that closes below 23,544
🎯 Targets: 23,484, 23,434, 23,385, 23,307, 23,275
🛑 Stop Loss: Above the high of the breakdown candle
⚠️ Disclaimer
I am Not SEBI Registered. This analysis is for educational purposes only and does not constitute financial advice. Trading involves risk, and past performance does not guarantee future results. Always do your own research or consult a financial advisor before trading. 🚀

NIFTY Intraday Trade Setup For 6 Feb 2025NIFTY Intraday Trade Setup For 6 Feb 2025
Bullish-Above 23810
Invalid-Below 23760
T- 24050
Bearish-Below 23600
Invalid-Above 23650
T- 23355
NIFTY has closed on a slight bearish note with 0.18% cut today. Yesterday we discussed that index closed above 50 EMA but we will consider a bullish reversal only after a pullback. Looks it tuned and gave a small decline. However it may decline further below today's low. As of now 23800 looks a turning point for a bullish trigger. 23600 will be a confluence zone.
Coming to Thursday's trade setup, if index opens flat and a 15 Min candle closes above 23810 then we will long for the target of 24050.
For selling we need a 15 Min candle close below 23600. T- 23555.
In case of a big gap up/down, wait till 10 o'clock and mark the high and low of the trading range (5MIN). Trade on this range breakout.
==========
I am Not SEBI Registered
This is my personal analysis for my personal trading. Kindly consult your financial advisor before taking any actions based on this.

Nifty key levels for 03.02.2025Nifty key levels for 03.02.2025
If Nifty breaks the upper or lower range, we can expect momentum. The consolidation zone will be favorable for option sellers, while a breakout on either side will benefit option buyers.
Disclaimer:
I'm not a SEBI Registered financial advisor. These views are purely educational in nature. You are solely responsible for any decisions made based on this research.

NIFTY Trading Strategy For 3rd February 2025NIFTY Trading Strategy:
Buy Strategy:
Entry Point: Buy above the high of the 15-minute candle that closes above 23635
Targets:
First Target: 23690
Second Target: 23740
Third Target: 23799
Stop-Loss: The stop-loss will be set at the low of the candle that breaks out above 23635.
Sell Strategy:
Entry Point: Sell below the low of the 15-minute candle that closes below 23305
Targets:
First Target: 23260
Second Target: 23205
Third Target: 23169
Stop-Loss: The stop-loss will be set at the high of the candle that breaks down below 23305.
Time Frame:
15-Minute Time Frame: This strategy is based on the 15-minute time frame, allowing for shorter-term trading opportunities and quicker responses to market movements.
Important Points:
Stop-Loss Orders: Always use stop-loss orders to manage risk and protect your capital.
Monitor Market Conditions: Continuously monitor market conditions and news that could impact the NIFTY index.
Technical Indicators: Consider using technical indicators and chart patterns to confirm entry and exit points.
Disclaimer: I am not SEBI registered. Please conduct your own research and consult a professional financial advisor before making any investment decisions. Trading and investing involve significant risk of loss and are not suitable for every investor.

NIFTY Trading Strategy-BUDGET DAY 01st Feb 2025NIFTY Trading Strategy:
Buy Strategy:
Entry Point: Buy above the high of the 15-minute candle that closes above 23685
Targets:
First Target: 23743
Second Target: 23805
Third Target: 23900
Stop-Loss: The stop-loss will be set at the low of the candle that breaks out above 23685.
Sell Strategy:
Entry Point: Sell below the low of the 15-minute candle that closes below 23380
Targets:
First Target: 23320
Second Target: 23260
Third Target: 23165
Stop-Loss: The stop-loss will be set at the high of the candle that breaks down below 23380.
Time Frame:
15-Minute Time Frame: This strategy is based on the 15-minute time frame, allowing for shorter-term trading opportunities and quicker responses to market movements.
Important Points:
Stop-Loss Orders: Always use stop-loss orders to manage risk and protect your capital.
Monitor Market Conditions: Continuously monitor market conditions and news that could impact the NIFTY index.
Technical Indicators: Consider using technical indicators and chart patterns to confirm entry and exit points.
Disclaimer: I am not SEBI registered. Please conduct your own research and consult a professional financial advisor before making any investment decisions. Trading and investing involve significant risk of loss and are not suitable for every investor.

NIFTY Trading Strategy for 31th January 2025NIFTY Trading Strategy:
Buy Strategy:
Entry Point: Buy above the high of the 15-minute candle that closes above 23350
Targets:
First Target: 23399
Second Target: 23441
Third Target: 23483
Sell Strategy:
Entry Point: Sell below the low of the 15-minute candle that closes below 23190
Targets:
First Target: 23145
Second Target: 23100
Third Target: 23045
Disclaimer: I am not SEBI registered. Please conduct your own research and consult a professional financial advisor before making any investment decisions. Trading and investing involve significant risk of loss and are not suitable for every investor.

Nifty Trading Strategy for 29th january 2025Nifty Trading Strategy
Buy Strategy:
Buy Above: The high of the 15-minute candle that closed above 23,050
Targets: 23,090, 23,140, 23,190
Stop-Loss: Below the low of the 15-minute candle that closed above 23,050
Sell Strategy:
Sell Below: The low of the 15-minute candle that closed below 22,850
Targets: 22,803, 22,765, 22,725
Stop-Loss: Above the high of the 15-minute candle that closed below 22,850
Disclaimer:
I am not SEBI registered. This analysis is based on historical data and market trends. Past performance is not indicative of future results. Trading and investment involve risks, and you should conduct your own research or consult with a financial advisor before making any decisions.
